All General Market Organizations by Reference Level - Hay Group
All General Market Organizations by Reference Level - Hay Group
All General Market Organizations by Reference Level - Hay Group

Create successful ePaper yourself
Turn your PDF publications into a flip-book with our unique Google optimized e-Paper software.
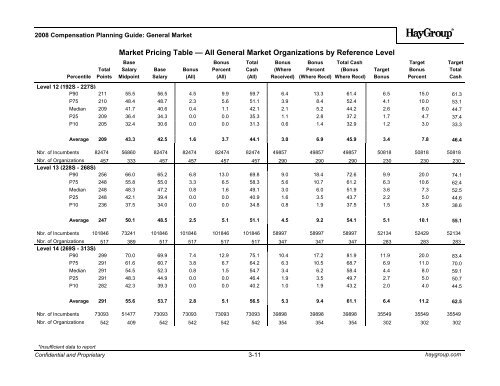
2008 Compensation Planning Guide: <strong>General</strong> <strong>Market</strong><br />
Percentile<br />
Total<br />
Points<br />
<strong>Market</strong> Pricing Table — <strong>All</strong> <strong>General</strong> <strong>Market</strong> <strong>Organizations</strong> <strong>by</strong> <strong>Reference</strong> <strong>Level</strong><br />
Base<br />
Salary<br />
Midpoint<br />
Base<br />
Salary<br />
Bonus<br />
(<strong>All</strong>)<br />
Bonus<br />
Percent<br />
(<strong>All</strong>)<br />
Total<br />
Cash<br />
(<strong>All</strong>)<br />
Bonus<br />
(Where<br />
Received)<br />
Bonus<br />
Percent<br />
(Where Recd)<br />
Total Cash<br />
(Bonus<br />
Where Recd)<br />
<strong>Level</strong> 12 (192S - 227S)<br />
P90 211 55.5 56.5 4.5 9.9 59.7 6.4 13.3 61.4 6.5 15.0 61.3<br />
P75 210 48.4 48.7 2.3 5.6 51.1 3.9<br />
8.4 52.4 4.1 10.0 53.1<br />
Median 209 41.7 40.6 0.4 1.1 42.1 2.1<br />
5.2 44.2 2.6 6.0 44.7<br />
P25 209 36.4 34.3 0.0 0.0 35.3 1.1<br />
2.8 37.2 1.7 4.7 37.4<br />
P10 205 32.4 30.6 0.0 0.0 31.3 0.6<br />
1.4 32.9 1.2 3.0 33.3<br />
Target<br />
Bonus<br />
Target<br />
Bonus<br />
Percent<br />
Target<br />
Total<br />
Cash<br />
Average 209 43.3 42.5 1.6 3.7 44.1 3.0<br />
6.9 45.9 3.4 7.8 46.4<br />
Nbr. of Incumbents 82474 56860 82474 82474 82474 82474 49857 49857 49857 50818 50818 50818<br />
Nbr. of <strong>Organizations</strong> 457 333 457 457 457 457 290 290 290<br />
230<br />
230 230<br />
<strong>Level</strong> 13 (228S - 268S)<br />
P90 256 66.0 65.2 6.8 13.0 69.8 9.0 18.4 72.6 9.9 20.0 74.1<br />
P75 248 55.8 55.0 3.3 6.5 58.3 5.6 10.7 61.2 6.3 10.6 62.4<br />
Median 248 48.3 47.2 0.8 1.6 49.1 3.0<br />
6.0 51.9 3.6 7.3 52.5<br />
P25 248 42.1 39.4 0.0 0.0 40.9 1.6<br />
3.5 43.7 2.2 5.0 44.6<br />
P10 236 37.5 34.0 0.0 0.0 34.8 0.8<br />
1.9 37.5 1.5 3.8 38.6<br />
Average 247 50.1 48.5 2.5 5.1 51.1 4.5<br />
9.2 54.1 5.1 10.1 55.1<br />
Nbr. of Incumbents 101846 73241 101846 101846 101846 101846 58997 58997 58997 52134 52429 52134<br />
Nbr. of <strong>Organizations</strong> 517 389 517 517 517 517 347 347 347<br />
283<br />
283 283<br />
<strong>Level</strong> 14 (269S - 313S)<br />
P90 299 70.0 69.9 7.4 12.9 75.1 10.4 17.2 81.9 11.9 20.0 83.4<br />
P75 291 61.6 60.7 3.8 6.7 64.2 6.3 10.5 68.7 6.9 11.0 70.0<br />
Median 291 54.5 52.3 0.8 1.5 54.7 3.4<br />
6.2 58.4 4.4 8.0 59.1<br />
P25 291 48.3 44.9 0.0 0.0 46.4 1.9<br />
3.5 49.7 2.7 5.0 50.7<br />
P10 282 42.3 39.3 0.0 0.0 40.2 1.0<br />
1.9 43.2 2.0 4.0 44.5<br />
Average 291 55.6 53.7 2.8 5.1 56.5 5.3<br />
9.4 61.1 6.4 11.2 62.5<br />
Nbr. of Incumbents<br />
Nbr. of <strong>Organizations</strong><br />
73093 51477 73093 73093 73093 73093 39898 39898 39898<br />
542 409 542 542 542 542 354 354 354<br />
35549<br />
302<br />
35549<br />
302<br />
35549<br />
302<br />
*Insufficient data to report<br />
Confidential and Proprietary<br />
3-11<br />
haygroup.com
2008 Executive Compensation Report: <strong>General</strong> <strong>Market</strong><br />
<strong>Group</strong> Head - 0005<br />
Total<br />
Points<br />
(S)<br />
Base<br />
Salary<br />
Midpoint<br />
($000)<br />
Base<br />
Salary<br />
($000)<br />
<strong>Reference</strong>d <strong>by</strong> Job Size<br />
Annual Compensation<br />
Incentive<br />
($000)<br />
Incentive<br />
as a % of<br />
Base<br />
Salary<br />
Total<br />
Cash<br />
($000)<br />
Target<br />
Total<br />
($000)<br />
Value of<br />
Long-term<br />
Incentives<br />
($000)<br />
Long-term<br />
Incentives<br />
as a % of<br />
Base Salary<br />
Total<br />
Direct<br />
Compensation<br />
($000)<br />
Percentile<br />
<strong>Level</strong>s 29-30 (3581S - 5060S)<br />
P90 1 4656 585.8 700.0 770.2 128.6 1339.1 1400.0 1390.0 277.3 2649.5<br />
P75 2 4656 570.0 584.4 486.5 99.3 1101.8 1046.3 1065.9 200.3 2070.5<br />
Median 3 3920 483.0 460.0 389.8 85.5 845.0 815.0 743.3 158.6 1638.0<br />
P25 4 3916 391.7 365.0 271.3 60.3 633.3 614.1 447.6 101.0 1110.7<br />
P10 5 3916 362.4 326.0 132.4 34.4 498.0 526.8 192.4 56.8 743.5<br />
Average 6 4220 479.3 495.3 424.2 88.9 912.3 891.4 850.9 165.4 1708.1<br />
Number of:<br />
Incumbents 59 32 59 58 58 59 52<br />
49 49 53<br />
<strong>Organizations</strong> 32 16 32 32 32 32 29<br />
26 26 28<br />
<strong>Level</strong> 30 (4251S - 5060S)<br />
P90 1 4656 574.0 700.0 775.0 135.9 1669.3 1400.0 1735.1 291.0 2986.0<br />
P75 2 4656 570.0 600.1 728.7 116.5 1290.9 1068.2 1065.2 179.0 2468.9<br />
Median 3 4656 471.5 525.0 412.5 82.5 845.0 912.6 718.9 157.5 1638.0<br />
P25 4 4656 381.0 431.1 285.3 60.5 681.8 722.7 581.1 102.7 1441.6<br />
P10 5 4656 364.6 361.0 207.7 46.1 602.8 547.2 381.0 62.6 952.8<br />
Average 6 4666 481.2 556.2 497.3 88.3 1031.9 995.5 1027.6 173.8 1990.6<br />
Number of:<br />
Incumbents 23 13 23 22 22 23 22<br />
19 19 21<br />
<strong>Organizations</strong> 16 8 16 16 16 16 15<br />
13 13 14<br />
<strong>Level</strong> 29 (3581S - 4250S)<br />
P90 1 4056 597.9 682.5 612.6 119.7 1194.6 1220.0 1211.2 242.5 2197.0<br />
P75 2 3920 533.3 542.5 442.1 95.7 930.7 950.1 1063.8 205.6 1961.3<br />
Median 3 3916 483.0 440.0 376.3 86.0 841.7 777.8 845.7 159.2 1632.4<br />
P25 4 3916 410.0 352.8 230.8 60.5 618.1 588.3 241.8 81.0 874.1<br />
P10 5 3916 365.6 254.4 68.3 19.3 445.7 428.5 147.9 42.2 636.5<br />
Average 6 3935 478.0 456.4 379.6 89.2 836.0 815.1 739.0 160.1 1522.7<br />
Number of:<br />
Incumbents 36 19 36 36 36 36 30<br />
30 30 32<br />
<strong>Organizations</strong> 22 13 22 22 22 22 19<br />
18 18 19<br />
<strong>Level</strong>s 27-28 (2551S - 3580S)<br />
P90 1 3371 700.0 761.0 754.0 149.3 1443.0 1501.5 1358.0 242.0 2016.1<br />
P75 2 3300 546.0 607.5 450.9 105.1 959.0 1023.9 686.4 149.9 1523.3<br />
Median 3 3232 427.3 460.0 350.2 75.0 814.5 825.9 431.3 90.8 1204.1<br />
P25 4 2786 350.2 360.7 215.6 49.3 652.4 582.3 215.0 58.3 933.1<br />
P10 5 2786 213.7 287.8 54.0 21.7 523.3 429.1 111.0 22.2 635.8<br />
Average 6 3098 450.9 502.6 380.6 82.9 876.6 894.8 593.6 120.2 1411.6<br />
Number of:<br />
Incumbents 58 30 58 57 57 58 48<br />
47 47 53<br />
<strong>Organizations</strong> 45 24 45 44 44 45 40<br />
35 35 41<br />
<strong>Level</strong> 28 (3021S - 3580S)<br />
P90 1 3536 678.1 765.4 729.4 141.3 1397.9 1450.4 1046.9 187.4 1964.0<br />
P75 2 3300 558.2 680.0 417.8 90.9 1002.1 1085.3 651.7 126.8 1476.2<br />
Median 3 3300 469.0 528.8 334.8 71.5 839.8 875.0 431.3 88.6 1252.6<br />
P25 4 3232 401.2 423.3 215.6 47.9 675.8 618.4 283.8 58.3 994.1<br />
P10 5 3232 248.6 328.0 0.0 0.0 568.0 450.0 155.7 28.3 815.1<br />
Average 6 3313 479.8 546.8 354.2 72.6 890.5 964.7 623.1 115.4 1460.8<br />
Number of:<br />
Incumbents 34 15 34 33 33 34 25<br />
29 29 32<br />
<strong>Organizations</strong> 28 14 28 27 27 28 23<br />
23 23 26<br />
Please Note:<br />
1) <strong>All</strong> compensation figures are reported in decimal thousands.<br />
2) <strong>All</strong> Annual and Long-term Incentive data presentations include eligible incumbents only.<br />
3) Total Direct Compensation represents the full value of executive annual compensation. However, it only includes incumbents for whom<br />
complete and valid information for base salary, annual incentive, and long-term incentive awards are available. Since this is a smaller<br />
sample of incumbents than available for base salary and total cash, direct comparisons between TDC and others are not appropiate.<br />
4) An asterisk (*) is used to ensure confidentiality and/or to suppress data where TDC is less than total cash.<br />
Confidential and Proprietary<br />
4-37<br />
haygroup.com
<strong>Hay</strong> Information Services<br />
Tax Accountants (1019, 1020, 1021)<br />
Percentile<br />
Total<br />
Points<br />
Base<br />
Salary<br />
Midpoint<br />
Base<br />
Salary<br />
Bonus<br />
(<strong>All</strong>)<br />
Bonus<br />
Percent<br />
(<strong>All</strong>)<br />
Total<br />
Cash<br />
(<strong>All</strong>)<br />
Bonus<br />
(Where<br />
Received)<br />
Bonus<br />
Percent<br />
(Where Recd)<br />
Total Cash<br />
(Bonus<br />
(Where Recd)<br />
Target<br />
Bonus<br />
Target<br />
Bonus<br />
Percent<br />
Target<br />
Total<br />
Tax Accountant III (1019)<br />
P90 478 103.2 99.4 17.0 19.2 113.1 18.6 20.6 117.4 14.0 15.0 112.4<br />
P75 478 91.8 88.7 9.5 12.2 99.0 13.0 14.4 102.9 10.9 12.5 101.8<br />
Median 478 85.7 83.5 6.4 8.0 85.8 8.9 10.8 94.9 8.0 10.0 93.4<br />
P25 478 75.3 71.4 0.0 0.0 75.0 6.5<br />
8.0 83.9 6.2 8.2 83.9<br />
P10 478 70.0 62.0 0.0 0.0 64.0 5.2<br />
7.0 68.8 5.3 6.2 68.7<br />
Inc. Wgtd 481 NA 80.2 6.5 7.7 86.6 9.5 11.4 91.6 8.8 10.7 90.4<br />
Org. Wgt 483 84.5 81.0 6.6 7.7 87.6 10.3 12.1 93.8 8.9 10.5 92.1<br />
Nbr. of Incumbents<br />
112 108 112 112 112 112 76 76 76<br />
73<br />
73<br />
73<br />
Nbr. of <strong>Organizations</strong><br />
40<br />
37 40 40 40 40 27 27 27<br />
26<br />
26<br />
26<br />
Tax Accountant II (1020)<br />
P90 405 85.4 81.0 10.1 14.2 88.4 11.0 17.7 89.2 9.3 13.0 90.8<br />
P75 404 77.1 75.9 7.3 10.8 81.4 9.2 12.3 84.1 7.8 10.0 83.9<br />
Median 404 71.8 65.4 3.3 5.1 70.3 6.2<br />
9.2 73.7 6.1 9.2 73.3<br />
P25 404 60.8 56.9 0.0 0.0 59.9 3.3<br />
5.2 66.3 3.6 6.0 63.4<br />
P10 403 55.0 50.1 0.0 0.0 50.8 1.6<br />
2.2 57.7 2.7 4.7 53.8<br />
Inc. Wgtd 406 NA 65.6 4.6 6.8 70.2 6.6<br />
9.8 73.6 6.1 8.9 72.0<br />
Org. Wgt 405 69.8 66.2 4.3 6.2 70.5 6.4<br />
9.4 74.2 6.0 8.7 72.9<br />
Nbr. of Incumbents<br />
138 127 138 138 138 138 95 95 95<br />
92<br />
92<br />
92<br />
Nbr. of <strong>Organizations</strong><br />
58<br />
52 58 58 58 58 35 35 35<br />
32<br />
32<br />
32<br />
Tax Accountant I (1021)<br />
P90 353 75.0 74.2 6.9 10.6 79.9 8.3 11.7 82.5 6.6 10.0 80.3<br />
P75 342 71.5 68.0 4.9 8.5 71.4 5.1<br />
9.0 73.0 5.1 8.0 72.7<br />
Median 342 65.5 57.0 2.7 5.0 60.9 4.3<br />
7.4 62.8 3.8 6.2 61.5<br />
P25 342 52.9 50.3 0.0 0.0 51.5 2.5<br />
4.4 54.5 2.8 5.2 53.9<br />
P10 342 47.2 45.3 0.0 0.0 46.2 1.7<br />
3.5 46.5 2.2 4.1 46.4<br />
Inc. Wgtd 343 NA 57.9 3.1 5.0 61.0 4.6<br />
7.6 63.9 4.0 6.8 61.9<br />
Org. Wgt 343 62.6 59.0 3.3 5.3 62.3 4.6<br />
7.5 63.9 4.2 7.0 63.6<br />
Nbr. of Incumbents<br />
93 87 93 93 93 93 62 62 62<br />
72<br />
72<br />
72<br />
Nbr. of <strong>Organizations</strong><br />
41<br />
35 41 41 41 41 26 26 26<br />
25<br />
25<br />
25<br />
*Insufficient data to report<br />
Confidential and Proprietary<br />
30<br />
haygroup.com