waiulaula watershed management plan - Mauna Kea SWCD
waiulaula watershed management plan - Mauna Kea SWCD
waiulaula watershed management plan - Mauna Kea SWCD

You also want an ePaper? Increase the reach of your titles
YUMPU automatically turns print PDFs into web optimized ePapers that Google loves.
WAIULAULA WATERSHED<br />
MANAGEMENT PLAN<br />
<strong>Mauna</strong> <strong>Kea</strong> Soil and Water Conservation District<br />
Carolyn Stewart, Jene Michaud, Mike Donoho and Orlando Smith<br />
2011<br />
Funding was provided jointly by the U.S. Environmental Protection Agency (EPA) under Section<br />
319(h) of the Clean Water Act, the Hawai‘i State Department of Health (DOH), Clean Water<br />
Branch, the National Oceanic and Atmospheric Administration (NOAA), and The Hawai‘i<br />
Department of Land and Natural Resources (DLNR). Although the information in this document<br />
has been funded by grants from these agencies, it may not necessarily reflect their views and<br />
no official endorsement should be inferred.<br />
i<br />
Wai‘ula‘ula Watershed Management Plan<br />
MK<strong>SWCD</strong>
TABLE OF CONTENTS<br />
TABLE OF CONTENTS ...................................................................................................ii<br />
List of Figures .................................................................................................................. v<br />
List of Tables ...................................................................................................................vi<br />
Acronyms ....................................................................................................................... vii<br />
Executive Summary ........................................................................................................ 1<br />
Chapter 1: Introduction .................................................................................................. 11<br />
1.1 Document Overview ............................................................................................ 11<br />
1.2 Watershed Management Plan Purpose and Process Used ................................. 12<br />
Chapter 2: Watershed Description ................................................................................ 16<br />
2.1 Physical and Natural Features ............................................................................. 16<br />
2.1.1 Watershed Boundaries .................................................................................. 16<br />
2.1.2 Hydrology ...................................................................................................... 18<br />
2.1.3 Climate and Precipitation .............................................................................. 24<br />
2.1.4 Flood Plains .................................................................................................. 26<br />
2.1.5 Riparian Areas .............................................................................................. 28<br />
2.1.6 Dams and Diversions .................................................................................... 28<br />
2.1.7 Topography and Elevation ............................................................................ 30<br />
2.1.8 Geology and Soils ......................................................................................... 31<br />
2.1.9 Vegetation ..................................................................................................... 34<br />
2.1.10 Native Wildlife ............................................................................................. 38<br />
2.1.11 Exotic and Invasive Species ........................................................................ 40<br />
2.2 Socio-Cultural Resources .................................................................................... 41<br />
2.2.1 Land Use Zones (State and County) ............................................................. 41<br />
2.2.2 Land Cover .................................................................................................... 49<br />
2.2.3 Population and Local Communities (Demographics) .................................... 49<br />
2.2.4 Land Uses – Historic and Current ................................................................. 50<br />
2.2.5 Water Uses – Historic and Current ................................................................ 54<br />
2.2.6 Flooding and Flood Control ........................................................................... 57<br />
2.2.7 Stormwater Management .............................................................................. 61<br />
2.2.8 Cultural Resources ........................................................................................ 62<br />
2.2.9 Relevant Authorities/Policies ......................................................................... 65<br />
2.2.10 Future Land Use Considerations ................................................................. 77<br />
Chapter 3: Water Quality Conditions ............................................................................. 80<br />
3.1 Ex<strong>plan</strong>ation and Meaning of Water Quality Parameters ...................................... 80<br />
3.2 Availability of Data ............................................................................................... 80<br />
3.3 Water Quality Standards ...................................................................................... 83<br />
3.4 Stream Data (nutrient and sediment concentrations) ........................................... 85<br />
3.4.1 Observed Concentrations ............................................................................. 85<br />
3.4.2 Are Streams Polluted? .................................................................................. 86<br />
3.5 Urban Runoff (nutrient and sediment concentrations) ......................................... 90<br />
3.5.1 Observed Concentrations ............................................................................. 90<br />
3.5.2 How Polluted is Waimea’s Urban Runoff?..................................................... 90<br />
ii<br />
Wai‘ula‘ula Watershed Management Plan<br />
MK<strong>SWCD</strong>
3.5.3 First Flush ..................................................................................................... 90<br />
3.5.4 Variations in the form of nitrogen .................................................................. 92<br />
3.6 Marine Data (nutrient, sediment, and algae concentrations) ............................... 93<br />
3.6.1 Observed Concentrations ............................................................................. 93<br />
3.6.2 Is the Ocean Polluted near the Mouth of the Wai‘ula‘ula Stream? ................ 94<br />
3.7 Watershed Loads (total amount of pollutants) ..................................................... 95<br />
3.7.1 Load Measurements ..................................................................................... 96<br />
3.7.2 Using the N-SPECT Model to Estimate Loads and Spatial Variability in<br />
Pollutants ............................................................................................................... 96<br />
3.7.3 Using the N-SPECT Model to Estimate Future Loads ................................. 104<br />
3.8 Toxics ................................................................................................................ 105<br />
3.9 Biological Data ................................................................................................... 105<br />
3.10 Summary ......................................................................................................... 109<br />
3.10.1 Pollutants of greatest concern and their spatial variability ......................... 109<br />
3.10.2 Information Gaps ....................................................................................... 109<br />
Chapter 4: Threats to the Water Quality of the Watershed .......................................... 111<br />
4.1 Nonpoint Sources of Pollution ........................................................................... 111<br />
4.1.1 Agriculture ................................................................................................... 111<br />
4.1.2 Urban/Suburban Runoff .............................................................................. 113<br />
4.1.3 Wastewater Disposal Systems .................................................................... 116<br />
4.1.4 Streambank Erosion .................................................................................... 118<br />
4.1.5 Feral Ungulates ........................................................................................... 120<br />
4.1.6 Invasive Plants ............................................................................................ 120<br />
4.1.7 Atmospheric Sources of Nitrogen ................................................................ 120<br />
4.2 Wildfire ............................................................................................................... 121<br />
4.3 Unexploded Ordnance ....................................................................................... 124<br />
4.4 Solid and Hazardous Waste .............................................................................. 126<br />
4.5 Flooding ............................................................................................................. 127<br />
4.6 Stream Diversions ............................................................................................. 127<br />
4.7 Climate Change ................................................................................................. 128<br />
Chapter 5: Recommended Management Measures .................................................... 129<br />
Chapter 6: Monitoring .................................................................................................. 173<br />
6.1 Implementation Monitoring ................................................................................ 173<br />
6.2 Land Use Monitoring .......................................................................................... 173<br />
6.3 Long-Term Routine Monitoring of Water Quality................................................ 174<br />
6.3.1 Recommendations for Long-term Baseflow Monitoring ............................... 174<br />
6.3.2 Recommended Long-term Marine Monitoring ............................................. 176<br />
6.3.3 Recommendations for Stormflow Monitoring ............................................... 177<br />
6.4 Monitoring of Watershed Condition .................................................................... 178<br />
6.4.1. Vegetation Monitoring ................................................................................ 178<br />
6.4.2. Stream Condition Assessment ................................................................... 181<br />
6.4.3. Erosion Monitoring ..................................................................................... 182<br />
6.4.4. Biological Surveys of Aquatic Species ....................................................... 184<br />
6.5 Monitoring Plan Implementation ........................................................................ 185<br />
6.5.1. Sampling and Analysis Plan (SAP) ............................................................ 185<br />
6.5.2. Data Management ...................................................................................... 185<br />
iii<br />
Wai‘ula‘ula Watershed Management Plan<br />
MK<strong>SWCD</strong>
6.5.3. Adaptive Management Approach ............................................................... 185<br />
Chapter 7: Bibliography ............................................................................................... 186<br />
iv<br />
Wai‘ula‘ula Watershed Management Plan<br />
MK<strong>SWCD</strong>
List of Figures<br />
Figure 1: Original Watershed Boundary ............................................................................................ 16<br />
Figure 2: Revised Watershed Boundary ............................................................................................ 17<br />
Figure 3: Overview of Streams in the Watershed ............................................................................... 19<br />
Figure 4: Upper Tributaries of Watershed ......................................................................................... 19<br />
Figure 5: Groundwater Aquifers ....................................................................................................... 23<br />
Figure 6: Annual Precipitation .......................................................................................................... 25<br />
Figure 7: Flood Insurance Rate Maps for Waimea and the Coast ........................................................ 27<br />
Figure 8: Topography of the Watershed ............................................................................................ 31<br />
Figure 9: Soil Types in the Watershed ............................................................................................... 32<br />
Figure 10: Soil Erodibility .................................................................................................................. 33<br />
Figure 11: Zones of Major Communities of Present Vegetation (McEldowney 1983) ........................... 36<br />
Figure 12: State Land Use Districts .................................................................................................... 42<br />
Figure 13: ALISH Agricultural Suitability ............................................................................................ 44<br />
Figure 14: County Zoning - Lower Watershed .................................................................................... 45<br />
Figure 15: County Zoning - Upper Watershed .................................................................................... 46<br />
Figure 16: County LUPAG Map .......................................................................................................... 48<br />
Figure 17: C-CAP Land Cover ............................................................................................................. 49<br />
Figure 18: Waimea Town Center Land Use Map - Parker Ranch 2020 Plan .......................................... 55<br />
Figure 19: Waimea Irrigation System (taken from DOA 2003) ............................................................ 57<br />
Figure 20: Proposed Pu‘ukapu Flood Control Project (Figure 3 from DLNR 1973) ................................ 59<br />
Figure 21: Dry Wells In and Around Waimea ..................................................................................... 62<br />
Figure 22: Critical Wastewater Disposal Areas for Hawai‘i Island ....................................................... 68<br />
Figure 23: DHHL Lālāmilo Residential Project .................................................................................... 79<br />
Figure 24: Sample Locations ............................................................................................................. 82<br />
Figure 25: Sub-basin Delineation of the Waiulaula Watershed for N-SPECT (from Gaut 2009) ............. 99<br />
Figure 26: Tributaries in the Wai‘ula‘ula Watershed Assessed for Runoff, Nutrient, and Sediment<br />
Contributions in Table 11 (Figure 19 in Gaut 2009) .................................................................. 101<br />
Figure 27: Modeled Sediment Sources ............................................................................................ 103<br />
Figure 28: Modeled Phosphorus Sources ......................................................................................... 103<br />
Figure 29: Modeled Nitrogen Sources ............................................................................................. 104<br />
Figure 30: Wai‘ula‘ula Watershed Wildfire History Map (1973-2009)............................................... 123<br />
Figure 31: Formerly Used Defense Sites (FUDS) in South Kohala (from Hawai‘i County 2008) ........... 125<br />
v<br />
Wai‘ula‘ula Watershed Management Plan<br />
MK<strong>SWCD</strong>
List of Tables<br />
Table 1: Comparison of Computed 100-Year Peak Discharge Rates (Table 11 in DHHL 2002) ............... 60<br />
Table 2: Land Cover in Four Drainage Basins ..................................................................................... 82<br />
Table 3: Water Quality Criteria for Streams ....................................................................................... 84<br />
Table 4: Open Coastal Waters Water Quality Criteria ........................................................................ 85<br />
Table 5: Nutrient and Sediment Concentrations in Samples Collected by Autosamplers. Values are<br />
discharge-weighted (EMC)........................................................................................................ 88<br />
Table 6: Summary of Stream Impairments for Nutrient and Sediment Based on Monitoring Data ...... 89<br />
Table 7: Grab Samples of Urban Storm Runoff Collected from Waimea Parking Lots and Roads .......... 91<br />
Table 8: Concentrations of Various Forms of Dissolved Nitrogen ....................................................... 93<br />
Table 9: Geometric Mean of Ocean Water Quality Measurements Made Near the Mouth of the<br />
Wai‘ula‘ula River and at Several Comparison Sites .................................................................... 94<br />
Table 10: Measured Loads ................................................................................................................ 97<br />
Table 11: Pollutant Coefficients (average concentrations in runoff) ................................................... 98<br />
Table 12: Model Prediction of Pollutant Concentrations .................................................................. 100<br />
Table 13: Relative contributions of major tributaries for pollutants displayed. ................................. 102<br />
Table 14: Current and Future Load Estimates from the N-SPECT Model (based on Gaut 2009: Table 33)<br />
.............................................................................................................................................. 104<br />
Table 15: Distribution of Biotic Sampling ........................................................................................ 106<br />
Table 16: Presence (P) of Species in Different Stream Reaches ........................................................ 107<br />
Table 17: Management Measures Applicable to the Waiulaula Watershed ...................................... 130<br />
Table 18: Priority Levels for Projects in the Wai‘ula‘ula Watershed Management Plan ..................... 133<br />
Table 19: Summary of Implementation Projects .............................................................................. 165<br />
Table 20: Project Timelines ............................................................................................................. 171<br />
vi<br />
Wai‘ula‘ula Watershed Management Plan<br />
MK<strong>SWCD</strong>
ac.<br />
ALISH<br />
ASEA<br />
BMP<br />
CDP<br />
CDUA<br />
CDUP<br />
CES<br />
cfs<br />
CNPCP<br />
CREP<br />
CWDA<br />
CWRM<br />
CZM<br />
DAR<br />
DEM<br />
DHHL<br />
DLNR<br />
DOA<br />
DOBOR<br />
DOH<br />
DOT<br />
DPW<br />
DWS<br />
EA<br />
eFOTG<br />
EIS<br />
EMC<br />
EPA<br />
ER<br />
FIRM<br />
FIS<br />
ft/d<br />
FUDS<br />
GIS<br />
gpd<br />
HAR<br />
HBS<br />
HCC<br />
HRS<br />
vii<br />
Acronyms<br />
acres<br />
Agricultural Lands of Importance to the State of Hawai‘i<br />
Aquifer Sector Area<br />
best <strong>management</strong> practice<br />
community development <strong>plan</strong><br />
Conservation District Use Application (DLNR)<br />
Conservation District Use Permit (DLNR)<br />
University of Hawai‘i's Cooperative Extension Service<br />
cubic feet per second<br />
Hawai‘i Coastal Nonpoint Pollution Control Program<br />
Conservation Reserve Enhancement Program<br />
DOH's Critical Wastewater Disposal Areas<br />
Hawai‘i Commission on Water Resource Management<br />
coastal zone <strong>management</strong><br />
DLNR's Division of Aquatic Resources<br />
digital elevation model<br />
Department of Hawaiian Homelands<br />
Hawai‘i Department of Land and Natural Resources<br />
Hawai‘i Department of Agriculture<br />
DLNR's Division of Boating and Ocean Recreation<br />
Hawai‘i Department of Health<br />
Hawai‘i Department of Transportation<br />
Hawai‘i County Department of Public Works<br />
Hawai‘i County Department of Water Supply<br />
environmental assessment<br />
NRCS's electronic Field Office Technical Guide<br />
environmental impact statement<br />
event mean concentration<br />
US Environmental Protection Agency<br />
enrichment ratios<br />
Flood Insurance Rate Map<br />
Flood Insurance Study<br />
feet per day (movement of groundwater)<br />
Formerly Used Defense Sites<br />
geographic information system<br />
gallons per day<br />
Hawai‘i Administrative Rules<br />
Bishop Museum's Hawai‘i Biological Survey<br />
Hawai‘i County Code<br />
Hawai‘i Revised Statutes<br />
Wai‘ula‘ula Watershed Management Plan<br />
MK<strong>SWCD</strong>
HWMO<br />
LCC<br />
LID<br />
LSB<br />
LUC<br />
LUPAG<br />
MG<br />
mgd<br />
MK<strong>SWCD</strong><br />
MSD<br />
MV<br />
N<br />
NARS<br />
NH4<br />
NPDES<br />
NRCS<br />
N-SPECT<br />
OSDS<br />
P<br />
SCAP<br />
SLH<br />
SMA<br />
TBD<br />
TMK<br />
TN<br />
TP<br />
TSS<br />
UIC<br />
USACOE<br />
USCG<br />
USDA<br />
USFWS<br />
USGS<br />
UST<br />
UXO<br />
WWMP<br />
Hawai‘i Wildfire Management Organization<br />
large capacity cesspool<br />
Low Impact Development<br />
University of Hawai‘i's Land Study Bureau<br />
Hawai‘i Land Use Commission<br />
Hawai‘i County General Plan Land Use Pattern Allocation Guide<br />
million gallons<br />
million gallons per day<br />
<strong>Mauna</strong> <strong>Kea</strong> Soil and Water Conservation District<br />
marine sanitation device<br />
mass-volume (curve)<br />
nitrogen<br />
Hawai‘i Natural Area Reserve System<br />
ammonium<br />
National Pollutant Discharge Elimination System (permit)<br />
USDA's Natural Resources Conservation Service<br />
Nonpoint Source Pollution and Erosion Comparison Tool<br />
onsite disposal system<br />
phosphorus<br />
CWRM's Stream Channel Alteration Permit<br />
Session Laws of Hawaii<br />
Special Management Area (permit)<br />
to be determined<br />
tax map key<br />
total nitrogen<br />
total phosphorus<br />
total suspended sediment<br />
Underground Injection Control (line or program)<br />
US Army Corps of Engineers<br />
US Coast Guard<br />
US Department of Agriculture<br />
US Fish and Wildlife Service<br />
US Geological Survey<br />
underground storage tank<br />
unexploded ordnance<br />
Wai’ula’ula Watershed Management Plan<br />
viii<br />
Wai‘ula‘ula Watershed Management Plan<br />
MK<strong>SWCD</strong>
1<br />
Executive Summary<br />
The Wai‘ula‘ula Stream <strong>watershed</strong> encompasses over 18,000 acres in the South Kohala District<br />
on Hawai‘i Island. The streams within this <strong>watershed</strong> flow more frequently than any other<br />
stream system in West Hawai‘i, creating important habitat for the native aquatic species. The<br />
nearshore waters of Kawaihae Bay, into which Wai‘ula‘ula flows, provide an important nursery<br />
ground not only for the native stream fishes but also for species important to the marine<br />
recreational, subsistence, and commercial fisheries. The upper reaches of the streams also<br />
provide water for both domestic and agricultural uses.<br />
The <strong>watershed</strong> supports a variety of land and water uses, ranging from agriculture to urban to<br />
commercial to conservation. The South Kohala District which encompasses this <strong>watershed</strong> has<br />
experienced tremendous population and residential growth over the past 20 years. Much of<br />
this growth has occurred within the <strong>watershed</strong>. In addition, the Hawai‘i County General Plan<br />
projects that this area will experience significant urban and suburban expansion over the next<br />
several decades. No studies have been done on the impacts of this cumulative and ongoing<br />
development on the riparian, stream, and coral reef habitats, and stream and coastal water<br />
quality. It is generally thought that the water quality within the <strong>watershed</strong> remains good.<br />
However, water quality monitoring undertaken by the <strong>Mauna</strong> <strong>Kea</strong> Soil and Water Conservation<br />
District (MK<strong>SWCD</strong>) indicates that, in some areas and for some pollutants, State water quality<br />
standards are exceeded.<br />
Through the Wai‘ula‘ula <strong>watershed</strong> <strong>management</strong> project, the MK<strong>SWCD</strong> seeks to be proactive in<br />
the <strong>management</strong> of this important <strong>watershed</strong>, focusing both on addressing existing sources of<br />
polluted runoff and threats to <strong>watershed</strong> health and preventing further degradation of the<br />
<strong>watershed</strong> resources as projected land use changes occur. The overall goal of the Wai‘ula‘ula<br />
<strong>watershed</strong> <strong>management</strong> <strong>plan</strong> is to maintain healthy stream and riparian environments, both in<br />
terms of water quality and habitat integrity, that sustain a healthy mauka-makai connection<br />
and promote community-based environmental stewardship.<br />
Chapter 1 provides an overview of the Wai‘ula‘ula <strong>watershed</strong> <strong>management</strong> <strong>plan</strong> and its<br />
purpose, and describes the process used to develop the <strong>plan</strong>. MK<strong>SWCD</strong> took the leading role in<br />
developing the Wai‘ula‘ula Watershed Management Plan (WWMP), with significant stakeholder<br />
involvement and community input. The <strong>watershed</strong> <strong>plan</strong>ning process was a multi-year effort to<br />
develop relationships, educate residents of the <strong>watershed</strong> on water quality issues, and seek<br />
land users and community help to identify contributing pollution sources in the <strong>watershed</strong> and<br />
recommend specific actions needed to effectively control sources of pollution. In developing<br />
the <strong>watershed</strong> <strong>management</strong> <strong>plan</strong>, the MK<strong>SWCD</strong> consulted a number of documents for<br />
assistance, including EPA’s Handbook for Developing Watershed Plans to Restore and Protect<br />
Our Waters (EPA 2005), Guidance Specifying Management Measures for Sources of Nonpoint<br />
Pollution in Coastal Waters (EPA 1993), and Updated Management Measures for Hawai‘i’s<br />
Coastal Nonpoint Pollution Control Program (Stewart 2009).<br />
Wai‘ula‘ula Watershed Management Plan MK<strong>SWCD</strong>
Chapter 2 describes the natural and socio-cultural resources of the <strong>watershed</strong>. The primary<br />
tributaries of the Wai‘ula‘ula <strong>watershed</strong> are Waikoloa and <strong>Kea</strong>nu’i’omanō streams, both of<br />
which originate at over 4,000-ft. elevation on Kohala Mountain and flow relatively parallel to<br />
one another until they join in a series of braided channels at about the 1,440-ft. elevation to<br />
form Wai‘ula‘ula, which terminates in the ocean in Kawaihae Bay. These streams flow yearround<br />
in their upper reaches but are intermittent in their lower reaches because of withdrawals<br />
upstream for domestic and agricultural purposes. There are permanent stream pools in the<br />
streams below Waimea that are apparently receiving some groundwater input. During storm<br />
events, stream levels and flows can increase rapidly, demonstrating the flashiness of Hawaiian<br />
streams.<br />
The Wai‘ula‘ula <strong>watershed</strong> extends from the 5,260-ft. elevation on Kohala Mountain to sea<br />
level over a distance of 8.5 miles, if measured as a straight line from headwater to estuary.<br />
Because of this steepness, climate varies considerably by elevation. The upper elevations are<br />
typically wet and cool, while the coastline is hot and arid. The <strong>watershed</strong> is typically affected by<br />
a regular pattern of orographic cloud formation and precipitation. Lower reaches of the<br />
<strong>watershed</strong> typically receive most of their moisture during Kona storms and localized convection<br />
events during the winter months. Annual rainfall in the <strong>watershed</strong> varies from about 120<br />
inches in the upper elevations to 7 inches at the coast. Drought conditions in the <strong>watershed</strong> in<br />
recent years have exacerbated the dry conditions in the lower <strong>watershed</strong>.<br />
The lands of the Wai‘ula‘ula <strong>watershed</strong> comprise the geological substrates of both Kohala<br />
Mountain and <strong>Mauna</strong> <strong>Kea</strong>. This geology has implications for both soil types and hydrology. The<br />
Wai‘ula‘ula <strong>watershed</strong> comprises several broad types of vegetation: forest, grassland,<br />
scrub/shrub and cultivated land. With the exception of the forested headwaters, much of the<br />
<strong>watershed</strong>’s vegetation has been altered over time. For the most part, <strong>plan</strong>t and animal<br />
communities reflect this change.<br />
In the Wai‘ula‘ula <strong>watershed</strong>, 69.4% of the lands are designated Agriculture, 21.2%<br />
Conservation, 0.5% Rural (small farms and low-density residential lots), and 8.9% Urban.<br />
Chapter 205, HRS, delegates the responsibility for zoning within the agricultural and rural<br />
districts to the counties. The urban district is entirely under county jurisdiction, and uses are<br />
controlled only by county zoning. While there is little urban or suburban development within<br />
the <strong>watershed</strong> at present, the County’s Land Use Pattern Allocation Guide shows substantial<br />
areas designated for urban and suburban expansion. Lands in the Conservation District are<br />
managed by the Department of Land and Natural Resources. A permit is required prior to any<br />
use of land in the Conservation District. Conservation lands include the Kohala Watershed<br />
Forest Reserve, Pu‘u o ‘Umi Natural Area Reserve, and Kohala Restricted Watershed.<br />
Chapter 2 also describes historic and current uses and the <strong>watershed</strong>’s land and water<br />
resources. It also summarizes relevant authorities at the county, state and federal levels that<br />
affect the <strong>management</strong> of natural resources and regulate potential sources of polluted runoff in<br />
the <strong>watershed</strong>.<br />
2<br />
Wai‘ula‘ula Watershed Management Plan MK<strong>SWCD</strong>
Chapter 3 provides water quality and biological data for the <strong>watershed</strong>, as well as estimations<br />
of pollutant loads. Autosamplers were used to collect stormwater runoff in three locations that<br />
was analyzed for nutrient and suspended sediment concentrations. At the Marine Dam site<br />
(where Waikoloa stream exits the high-elevation forest), the stream has relatively low<br />
concentrations of nitrate, ammonia, and orthophosphate (PO 4 ). At the sampling site<br />
downstream of Waimea Town (Sandalwood site), ammonia concentrations doubled, total<br />
phosphorus concentrations (TP) more than doubled, and nitrate concentrations quadrupled.<br />
The average nitrate concentration just barely exceeded the water quality standard. The TP<br />
concentration was nearly twice the allowable amount. At the sampling site near the mouth of<br />
the <strong>watershed</strong>, total nitrogen was high, with measured concentrations nearly twice what is<br />
allowed by State water quality standards.<br />
Nine samples of urban storm runoff were collected by taking grab samples of flowing water in<br />
parking lots, storm water running off of roads, or from pipes that collect parking lot/road<br />
runoff. All sites were located in Waimea, and samples were collected between November 2008<br />
and April 2009. Based on this limited amount of data, it appears likely that runoff from highuse<br />
paved areas exceeds water quality criteria for sediment (by a factor of five), total<br />
phosphorus (by a factor of four), total nitrogen (by a factor of three) and nitrate (measured<br />
values are only slightly greater than the standard). These results are not surprising as urban<br />
storm runoff is usually high in sediment and nutrients.<br />
During the period July 2006 through April 2008, the Department of Health (DOH) made<br />
frequent measurements of water quality at a number of coastal sites. Measurements in the<br />
nearshore waters of Kawaihae Bay at Wai‘ula‘ula were taken on 33 separate days. Comparison<br />
of measurement against the water quality standards shows that the Bay has too much<br />
ammonia (concentrations are 2.8 more than what is allowed) and too much chlorophyll<br />
(concentrations are double what is allowed). The high chlorophyll levels indicate that there is<br />
too much algae. It is likely the high ammonia levels are contributing to high excess algae.<br />
Because ammonia is rapidly converted to nitrate in the presence of oxygen, it is likely that the<br />
source of the ammonia is nearby. The measured nitrate and total nitrogen concentrations are<br />
near the standard. Total phosphorus concentrations are slightly above the standard.<br />
“Loads” are the total amount of a pollutant that is exported from a <strong>watershed</strong>. Loads are<br />
usually measured in pounds (of Nitrogen, Phosphorus, or Sediment) per year. Existing loads can<br />
be measured, although obtaining data is very expensive. Modeling can be used to estimate<br />
loads for locations where measurements are not available. Annual loads were, therefore,<br />
estimated for this <strong>watershed</strong> <strong>management</strong> <strong>plan</strong> using NOAA’s Nonpoint Source Pollution and<br />
Erosion Comparison Tool (N-SPECT) model. One advantage of using a model is that it provides<br />
explicit estimates of the contributions of each landcover class. N-SPECT can also identify areas<br />
that are particularly susceptible to erosion or predict the change in loads resulting from land<br />
use changes.<br />
3<br />
Wai‘ula‘ula Watershed Management Plan MK<strong>SWCD</strong>
The model’s estimate of sediment concentration (TSS) was about 20% higher than the<br />
measured concentration at the Marine Dam autosampler and more than double the measured<br />
concentration at the lower edge of the town of Waimea. It is possible that NSPECT underestimated<br />
the amount of sediment that is re-deposited a short distance from where it was<br />
eroded. Or, it is possible that some of the RUSLE/MUSLE coefficients are not appropriate to<br />
Hawai‘i. On an average annual basis, the model predicts that the nitrogen load from the<br />
<strong>watershed</strong> is approximately 23,000 kg or 1.4 kg/acre/year, while the predicted phosphorus load<br />
is 2,176 kg or 0.129 kg/acre/year (Gaut 2009). When compared to other <strong>watershed</strong>s in Hawai‘i,<br />
N-SPECT produced reasonable estimates of nitrogen and phosphorus loads; however, the<br />
limited water quality data collected by autosamplers within the Wai‘ula‘ula <strong>watershed</strong> suggest<br />
these estimates may be high (Gaut 2009).<br />
Assessment of ecosystem health can be based either on water quality or on biological<br />
populations. A healthy ecosystem is diverse and contains native species. Stream surveys reveal<br />
a wide array of native endemic and indigenous aquatic fish and macro-invertebrates in the<br />
<strong>watershed</strong>. According to Englund (2010), “[t]he relatively high 65% overall native aquatic insect<br />
biodiversity found within the entire Wai‘ula‘ula <strong>watershed</strong> is comparable to other high quality<br />
streams” (p. 12).<br />
Chapter 4 describes the threats to the water quality of the <strong>watershed</strong>. At this time, there are<br />
insufficient data to conclusively prioritize threats by load contribution or impacts to resources.<br />
The following threats are present in the <strong>watershed</strong>:<br />
• Nonpoint sources of pollution in the form of agriculture, urban/suburban runoff, onsite<br />
wastewater disposal systems, streambank erosion, disturbances by feral ungulates (pigs,<br />
goats), invasive <strong>plan</strong>ts, and atmospheric sources of nitrogen;<br />
• Wildfire;<br />
• Unexploded ordnance;<br />
• Solid and hazardous waste;<br />
• Flooding;<br />
• Stream diversions; and<br />
• Climate change.<br />
The chapter describes each of these threats in detail. Addressing the effects of some of these<br />
threats is beyond the scope of this <strong>watershed</strong> <strong>management</strong> <strong>plan</strong>.<br />
Chapter 5 describes <strong>management</strong> measures that can be implemented to achieve <strong>watershed</strong><br />
restoration and protection goals and address the existing impairments and threats described in<br />
Chapters 3 and 4. This <strong>plan</strong> focuses efforts primarily in the riparian corridor and on the land<br />
immediately adjacent to the riparian zone because these areas most directly impact the quality<br />
of the stream and nearshore waters and habitats. The <strong>watershed</strong> <strong>management</strong> <strong>plan</strong> describes<br />
a coordinated program of effective actions to be implemented to prevent and abate polluted<br />
runoff within the <strong>watershed</strong>, as well as address other threats that have a direct impact of<br />
overall <strong>watershed</strong> health and habitat integrity.<br />
4<br />
Wai‘ula‘ula Watershed Management Plan MK<strong>SWCD</strong>
Chapter 5 lays out <strong>watershed</strong> restoration and protection goals and objectives, as well as<br />
recommended projects and tasks to address the goals and objectives. It identifies<br />
implementing measures that will have the greatest likelihood of achieving the stated <strong>watershed</strong><br />
goals. Under each goal, there is a brief description of the problem to be addressed, estimated<br />
pollutant load reductions expected, and a table listing criteria by which to measure success in<br />
achieving that particular goal, followed by one or more measurable objectives. Under each<br />
objective there are one or more projects to implement the objective. Under each project there<br />
is a list of tasks, which are interim measurable milestones to gage progress toward project<br />
implementation. Worksheets for each project are provided in Appendix A, summarizing project<br />
tasks, implementation timeframe and schedule, pollutant load reduction estimates (if<br />
applicable), responsible entity and project partners, and an estimation of costs and technical<br />
assistance. Project timeframes and schedules assume a start date of 2012 for <strong>plan</strong><br />
implementation.<br />
Goal 1: Reduce nutrient loads in the Wai‘ula‘ula <strong>watershed</strong>.<br />
Objective 1a: Reduce nutrient loads in agricultural runoff from Lālāmilo Farm Lots by<br />
20% by 2019.<br />
Project NUTR-1: Assist farmers in Lālāmilo Farm Lots with the development<br />
and implementation of Conservation Plans to reduce polluted runoff. This<br />
project also addresses objectives for sediment control and stormwater<br />
<strong>management</strong>.<br />
Objective 1b: Fence 58,000-ft. of riparian corridors on <strong>Kea</strong>nu‘i‘omanō Stream to<br />
exclude livestock from streams by 2023.<br />
Project NUTR-2. Work with Parker Ranch and FR Cattle Co. to fence critical<br />
riparian areas that cattle are currently using to access water. This project<br />
will also address pathogens and sediment loads from eroding streambanks<br />
caused by cattle trampling.<br />
Objective 1c: Increase inspections and maintenance (pumping) of onsite wastewater<br />
disposal systems (OSDS) within the <strong>watershed</strong> by 20% by 2019.<br />
Project NUTR-3. By 2016, educate home owners about proper operation and<br />
maintenance of OSDS and the effects of failing OSDS on water quality, public<br />
health, and environmental conditions.<br />
Project NUTR-4. Work with local realtors and lenders to establish voluntary<br />
point-of-sale inspections of OSDS in critical areas of the <strong>watershed</strong> by 2017.<br />
Goal 2: Prevent an increase in sediment loads in the Wai‘ula‘ula <strong>watershed</strong>.<br />
Objective 2a: Reduce sediment loads in agricultural runoff from Lālāmilo Farm Lots<br />
by 20% by 2019.<br />
Project SED-1. Assist farmers in Lālāmilo Farm Lots with the development<br />
and implementation of Conservation Plans to reduce polluted runoff.<br />
(Implement concurrently with Project NUTR-1 above.)<br />
Objective 2b: By 2020, improve grazing efficiency as a way to prevent overgrazing<br />
and limit wildfire size to an average of 100 acres burned per year in the fire prone<br />
area between 1,200-ft. and 2,600-ft. elevation.<br />
5<br />
Wai‘ula‘ula Watershed Management Plan MK<strong>SWCD</strong>
Project SED-2. By 2013, extend the Waimea Irrigation Water System from<br />
Lālāmilo Farm Lots to the rock wall at the 1,200-ft. elevation.<br />
Project SED-3. Sub-divide large paddocks in the wildfire prone area between<br />
Lālāmilo and the rock wall at 1,200-ft. elevation into smaller paddocks by<br />
2016 to improve grazing efficiency of fine fuels.<br />
Objective 2c: By 2016, assess 100% of the <strong>watershed</strong>’s riparian corridors to identify<br />
eroding or unstable streambanks and monitor at least 10 sites over 3 years to<br />
determine annual erosion rates.<br />
Project SED-4. Identify eroding and unstable streambanks and install<br />
erosion pins in representative sites to monitor annual erosion rates.<br />
Objective 2d: Following fencing projects (FIRE-1 and FIRE-2), remove all feral goats<br />
from the lower <strong>watershed</strong> (rock wall down to the coast) by 2020.<br />
Project SED-5. Remove feral goats from the lower <strong>watershed</strong> between<br />
Queen Ka‘ahumanu Highway and the rock wall at the 1,200-ft. elevation by<br />
2014.<br />
Project SED-6. Remove goats from lower <strong>watershed</strong> below Queen<br />
Ka‘ahumanu Highway by 2020. This project would only occur following the<br />
fencing of this area under Project FIRE-2.<br />
Objective 2e: By 2022, restore 25% of bare land in the <strong>watershed</strong> contributing to<br />
erosion, using techniques described in the post-fire restoration manual (Project<br />
FIRE-6).<br />
Project SED-7. Identify and re-vegetate 25% of priority bare land<br />
contributing to sediment load in the <strong>watershed</strong> by 2022.<br />
Goal 3: Reduce wildfire occurrences and associated impacts to water quality and ecosystem<br />
health.<br />
Objective 3a: Reduce size of wildfires to an average of 100 acres burned per year by<br />
2015 in the fire prone area between Queen Ka‘ahumanu Highway and 1,200-ft.<br />
elevation by using grazing to manage fine fuel loads.<br />
Project FIRE-1. Fence lower <strong>watershed</strong> between Queen Ka‘ahumanu<br />
Highway and the rock wall at 1,200-ft. by 2013 to manage fine fuel loads<br />
with cattle grazing.<br />
Project FIRE-2. By 2018, develop a project to reduce the fuel load in the<br />
unfenced, ungrazed area below Queen Ka‘ahumanu Highway (to sea level)<br />
in consultation with land owners, Hawai‘i Wildfire Management<br />
Organization, NRCS, UH Cooperative Extension Service, and possible grazers.<br />
Objective 3b: By 2020, install measures within the <strong>watershed</strong> to facilitate rapid<br />
response by fire suppression agencies in the event of a fire start, to include reducing<br />
fuel loads in a 150-ft. to 300-ft. buffer zone around neighborhoods and along<br />
roadways by 80%.<br />
Project FIRE-3. Update fire resource maps that cover the Wai‘ula‘ula<br />
<strong>watershed</strong> by 2012.<br />
6<br />
Wai‘ula‘ula Watershed Management Plan MK<strong>SWCD</strong>
Project FIRE-4. Facilitate development and/or update of water use and<br />
access agreements between private land owners in the Wai‘ula‘ula<br />
<strong>watershed</strong> and fire response agencies by 2012.<br />
Project FIRE-5. Construct and/or maintain at least 6 miles of fuel breaks by<br />
2017 to protect residential communities in fire-prone areas from wildfire<br />
and to slow spread of fire starts along roadways in the <strong>watershed</strong>.<br />
Objective 3c: In cooperation with HWMO, develop a post-fire restoration manual of<br />
effective practices by 2015.<br />
Project FIRE-6. In cooperation with HWMO, develop a post-fire restoration<br />
manual of effective practices by 2015.<br />
Goal 4: Reduce the volume and increase the quality of stormwater runoff in the urban and<br />
suburban areas of the Wai‘ula‘ula <strong>watershed</strong>.<br />
Objective 4a: By 2020, treat 70% of urban stormwater runoff that is conveyed<br />
directly into streams and 30% of stormwater conveyed to dry wells in close<br />
proximity to stream channels.<br />
Project STORM-1. Install storm drain and curbside catch basin filter inserts<br />
by 2016 on priority drains/ basins that discharge directly into streams.<br />
Project STORM-2. By 2018, install catch basin filter inserts on priority dry<br />
wells that are in close proximity to streams, where stormwater carrying<br />
pollutants may rapidly seep into stream channels.<br />
Objective 4b: Conduct semi-annual educational events to engage residential<br />
property owners in managing stormwater onsite for three years before 2016.<br />
Project STORM-3. Develop and implement a public education and outreach<br />
program for residential stormwater <strong>management</strong>.<br />
Objective 4c: Decrease volumes flowing offsite and increase treatment of<br />
stormwater from existing commercial and residential developments by 15% by<br />
2023.<br />
Project STORM-4. Upgrade existing urban runoff control structures on a<br />
priority basis.<br />
Objective 4d: Develop written pollution prevention procedures for the operation<br />
and maintenance of existing County roads, highways, and bridges by 2019 to reduce<br />
pollutant loadings to surface waters.<br />
Project STORM-5. Work with the County to formalize operations and<br />
maintenance practices for County roads, highways, and bridges by<br />
developing written guidelines.<br />
Objective 4e: By promoting use of Low Impact Development techniques, reduce the<br />
volume of stormwater runoff conveyed offsite from new large developments by<br />
2025 so that total runoff volumes calculated by N-SPECT modeling of land use<br />
changes do not increase as urban and suburban expansion occurs.<br />
Project STORM-6. Develop and implement a LID outreach program for large<br />
landowners, developers, State and county land managers and permitting<br />
agencies, and engineering and land use <strong>plan</strong>ning firms by 2015.<br />
7<br />
Wai‘ula‘ula Watershed Management Plan MK<strong>SWCD</strong>
Goal 5: Restore and enhance riparian buffers that serve as protective filters for streams in<br />
the Wai‘ula‘ula <strong>watershed</strong>.<br />
Objective 5a: By 2025, restore 25,000-ft. of stream riparian corridor to provide an<br />
adequate buffer for managing stormwater, reducing pollutant loads by 10% from<br />
current levels, protecting from property loss due to flooding and erosion, and<br />
creating healthy habitat for native aquatic species.<br />
Project STREAM-1. By 2017, convert marginal agricultural lands within a<br />
15,000-ft. length of the stream corridor into native vegetation under the<br />
Hawai‘i Conservation Resource Enhancement Program.<br />
Project STREAM-2. Conduct semi-annual educational events, including<br />
hands-on events and demonstration projects, for three years before 2016 to<br />
educate the public about the importance of riparian buffers.<br />
Project STREAM-3. Prioritize riparian buffers for restoration, and work with<br />
land owner(s) to implement restoration project(s) on at least 10,000-ft. of<br />
priority stream corridors.<br />
Objective 5b: By 2018, establish a county regulatory mechanism that specifically<br />
protects wetlands and riparian areas of perennial streams on Hawai‘i Island.<br />
Project STREAM-4. Help draft policy language to enact an overlay district<br />
that explicitly protects wetlands and riparian areas.<br />
Goal 6: Protect aquatic habitat and manage instream flows.<br />
Objective 6a: By 2021, ensure that instream flows for the streams within the<br />
Wai‘ula‘ula <strong>watershed</strong> balance permitted sustainable water use and protection of<br />
the biological, chemical, and physical integrity of these waters, and that annual<br />
diversions do not exceed half the combined flows at the Marine Dam and<br />
Kohākōhau stream gauges.<br />
Project AQU-1. Work with landowners and the Water Commission to permit<br />
or remove 100% of illegal diversions by 2018.<br />
Project AQU-2. Evaluate need for specific instream flow standards for<br />
streams within the Wai‘ula‘ula <strong>watershed</strong> by 2019.<br />
Objective 6b: Maintain or improve the current native species diversity of fish and<br />
invertebrate communities in the Wai‘ula‘ula <strong>watershed</strong> by 2025.<br />
Project AQU-3. Consult with experts by 2016 to determine if existing dams<br />
and other instream structures are having a negative effect on ‘o‘opu<br />
instream migration.<br />
Project AQU-4. Prevent further introduction of invasive aquatic species into<br />
the streams and identify how to remove existing invasive species that<br />
threaten native species by 2020.<br />
Project AQU-5. By 2015, protect priority instream perennial pools that<br />
provide important habitat for native aquatic species.<br />
Goal 7: Increase public education, understanding, and participation regarding <strong>watershed</strong><br />
issues.<br />
8<br />
Wai‘ula‘ula Watershed Management Plan MK<strong>SWCD</strong>
Objective 7a: Increase stakeholder awareness and involvement by 15% by<br />
implementing an integrated <strong>watershed</strong> <strong>management</strong> information and education<br />
campaign by 2016.<br />
Project EDUC-1: Develop/ adapt and distribute educational materials<br />
related to <strong>watershed</strong> issues to community members. The majority of these<br />
educational materials relate to projects described above.<br />
Objective 7b: Recruit and engage volunteers to assist in at least two large<br />
community-based projects in the <strong>watershed</strong> every year beginning in 2013.<br />
Project EDUC-2: Provide on-the-ground service learning opportunities for<br />
school children and community members.<br />
Goal 8: Provide effective project administration and <strong>management</strong> to ensure long-term<br />
success.<br />
Objective 8a: Establish appropriate administrative framework by 2012 to allow for<br />
effective and timely implementation of the Wai‘ula‘ula <strong>watershed</strong> <strong>plan</strong>.<br />
Project ADMIN-1: Hire Wai‘ula‘ula <strong>watershed</strong> coordinator.<br />
Objective 8b: Implement monitoring program described in Chapter 6, following the<br />
timeframes established.<br />
Project: MONIT-1: When <strong>management</strong> <strong>plan</strong> implementation begins, initiate<br />
monitoring components described in Chapter 6.<br />
Using best professional judgment, <strong>management</strong> actions were assessed and prioritized based on<br />
a number of criterion, including load reduction potential, acreage affected, landowner buy-in,<br />
cost, ease of implementation, and community exposure (to facilitate education and outreach).<br />
This process, described in more detail in Chapter 5, resulted in projects being placed in high,<br />
medium, and low priority levels for implementation. These priority levels translated into an<br />
implementation schedule spanning 15 years.<br />
Chapter 6 outlines the monitoring component of the Wai‘ula‘ula <strong>watershed</strong> <strong>management</strong> <strong>plan</strong>.<br />
Monitoring is an essential part of <strong>watershed</strong> <strong>plan</strong>ning. Monitoring can identify emerging<br />
problems or document response to changes in land use or climate. Equally important,<br />
monitoring is needed to evaluate the effectiveness of implemented BMPs.<br />
PURPOSE OF MONITORING<br />
TYPE OF MONITORING<br />
Implementation Monitoring<br />
Implementation monitoring determines whether the <strong>management</strong> strategies outlined in the<br />
work <strong>plan</strong> are being implemented as written.<br />
Land Use Monitoring<br />
Changes in land use have the potential to result in changes to water quality or integrity of<br />
riparian habitats. Such changes should be tracked and correlated with changes in baseline<br />
water quality<br />
9<br />
Wai‘ula‘ula Watershed Management Plan MK<strong>SWCD</strong>
PURPOSE OF MONITORING<br />
Long-Term Monitoring of Water Quality<br />
Water quality monitoring will help identify<br />
whether new disturbances or <strong>management</strong><br />
activities are having a negative or positive<br />
impact on water quality; measure whether<br />
there are progressive changes in water quality,<br />
either for better or for worse; evaluate, when<br />
fires occur, whether there are downstream<br />
impacts; and evaluate year-to-year variability<br />
in order to more realistically evaluate pre- and<br />
post- monitoring of BMPs.<br />
TYPE OF MONITORING<br />
Long-Term Baseflow Monitoring<br />
Long-Term Marine Monitoring<br />
Stormflow Monitoring<br />
Monitoring of Watershed Conditions<br />
Vegetation Monitoring<br />
The purpose of the <strong>watershed</strong> condition<br />
monitoring is to assess the status and trend of<br />
<strong>watershed</strong> attributes to help determine if<br />
Wai‘ula‘ula <strong>watershed</strong> <strong>management</strong> efforts<br />
are achieving goals of maintaining and<br />
restoring a healthy <strong>watershed</strong>.<br />
• Stubble Height Monitoring<br />
• Fuel Loads<br />
• Vegetation Transects<br />
Stream Condition Assessment<br />
Erosion Monitoring<br />
• Infiltration Rates<br />
• Erosion Rates<br />
Biological Surveys of Aquatic Species<br />
A detailed sampling and analysis <strong>plan</strong> that outlines parameters to be monitored, sampling<br />
location and frequency, roles and responsibilities, documentation and records, quality control<br />
requirements, and chain of custody will be developed prior to implementation of <strong>management</strong><br />
projects.<br />
Chapter 7 provides an extensive biobliography. The appendices provide additional information<br />
of interest. Appendix A provides stand-alone worksheets for each project, summarizing project<br />
tasks, implementation timeframe and schedule, responsible entity and project partners, and an<br />
estimation of costs and technical assistance. Appendix B describes the relevant Coastal<br />
Nonpoint Pollution Control Program <strong>management</strong> measures. Appendix C identifies EPA’s nine<br />
key elements for developing an effective <strong>watershed</strong> <strong>management</strong> <strong>plan</strong>.<br />
10<br />
Wai‘ula‘ula Watershed Management Plan MK<strong>SWCD</strong>
Chapter 1: Introduction<br />
The Wai‘ula‘ula Stream <strong>watershed</strong> encompasses over 18,000 acres in the South Kohala District<br />
on Hawai‘i Island. The streams within this <strong>watershed</strong> flow more frequently than any other<br />
stream system in West Hawai‘i, creating important habitat for the native aquatic species. The<br />
nearshore waters of Kawaihae Bay, into which Wai‘ula‘ula flows, provide an important nursery<br />
ground not only for the native stream fishes but also for species important to the marine<br />
recreational, subsistence, and commercial fisheries. The upper reaches of the streams also<br />
provide water for both domestic and agricultural uses.<br />
The <strong>watershed</strong> supports a variety of land and water uses, ranging from agriculture to urban to<br />
commercial to conservation. The South Kohala District which encompasses this <strong>watershed</strong> has<br />
experienced tremendous population and residential growth over the past 20 years. Much of<br />
this growth has occurred within the <strong>watershed</strong>. In addition, the Hawai‘i County General Plan<br />
projects that this area will experience significant urban and suburban expansion over the next<br />
several decades. No studies have been done on the impacts of this cumulative and ongoing<br />
development on the riparian, stream, and coral reef habitats, and stream and coastal water<br />
quality. It is generally thought that the water quality within the <strong>watershed</strong> remains good.<br />
However, water quality monitoring undertaken by the <strong>Mauna</strong> <strong>Kea</strong> Soil and Water Conservation<br />
District (MK<strong>SWCD</strong>) indicates that, in some areas and for some pollutants, State water quality<br />
standards are exceeded. Through the Wai‘ula‘ula <strong>watershed</strong> <strong>management</strong> project, the<br />
MK<strong>SWCD</strong> seeks to be proactive in the <strong>management</strong> of this important <strong>watershed</strong>, focusing both<br />
on addressing existing sources of polluted runoff and threats to <strong>watershed</strong> health and<br />
preventing further degradation of the <strong>watershed</strong> resources as projected land use changes<br />
occur.<br />
The overall goal of the Wai‘ula‘ula <strong>watershed</strong> <strong>management</strong> <strong>plan</strong> is to maintain healthy stream<br />
and riparian environments, both in terms of water quality and habitat integrity, that sustain a<br />
healthy mauka-makai connection and promote community-based environmental stewardship.<br />
1.1 Document Overview<br />
This <strong>watershed</strong> <strong>management</strong> <strong>plan</strong> addresses both EPA's 9 key elements for <strong>watershed</strong>-based<br />
<strong>plan</strong>s and the applicable <strong>management</strong> measures for Hawai‘i's coastal nonpoint pollution control<br />
program (CNPCP). Chapter 2 describes the natural and socio-cultural resources of the<br />
<strong>watershed</strong>. Chapter 3 provides water quality and biological data for the <strong>watershed</strong>, as well as<br />
estimations of pollutant loads. Chapter 4 describes the threats to the water quality of the<br />
<strong>watershed</strong>, and Chapter 5 describes <strong>management</strong> measures that can be implemented to<br />
achieve <strong>watershed</strong> restoration and protection goals and address the existing impairments and<br />
threats. Chapter 6 outlines the monitoring <strong>plan</strong> to measure effectiveness of implementation<br />
efforts.<br />
11<br />
Wai‘ula‘ula Watershed Management Plan MK<strong>SWCD</strong>
1.2 Watershed Management Plan Purpose and Process Used<br />
The <strong>Mauna</strong> <strong>Kea</strong> Soil and Water Conservation District (MK<strong>SWCD</strong> or District) took the leading role<br />
in developing the Wai‘ula‘ula Watershed Management Plan (WWMP), with significant<br />
stakeholder involvement and community input. MK<strong>SWCD</strong> is a quasi-state agency established in<br />
1955 under Chapter 180, Hawai‘i Revised Statutes (HRS). Five volunteer directors administer<br />
the MK<strong>SWCD</strong> programs. The MK<strong>SWCD</strong> takes available technical, financial and educational<br />
resources and focuses them to meet the needs of the local land users for the conservation of<br />
soil, water and other related environmental resources. MK<strong>SWCD</strong> has a proven track record in<br />
developing and implementing <strong>watershed</strong> <strong>management</strong> <strong>plan</strong>s. Prior to initiating the Wai‘ula‘ula<br />
<strong>watershed</strong> <strong>plan</strong>ning effort, the MK<strong>SWCD</strong> was responsible for the Pelekane Bay <strong>watershed</strong><br />
<strong>management</strong> effort. In 2005, the MK<strong>SWCD</strong> received a contract from the Hawai‘i Department of<br />
Health (DOH) supported with Section 319(h) funding to develop the WWMP and, in 2010,<br />
received additional funding through the Hawai‘i Department of Land and Natural Resources<br />
(DLNR) to update the <strong>plan</strong>.<br />
The MK<strong>SWCD</strong> directors have been responsible for overseeing the project. The directors who<br />
have been involved since the beginning of this effort include: Jim Frazier; David Fuertes; Pete<br />
Hendricks; Robby Hind; Ken Kaneshiro; Brad Lau; Chris Robb; and Jim Thain. Carolyn Stewart<br />
was hired as the <strong>watershed</strong> coordinator. She has 20 years of experience in <strong>watershed</strong> <strong>plan</strong>ning<br />
and polluted runoff control. Consultants Mike Donoho, Jene Michaud, and Orlando Smith<br />
assisted with the development of the <strong>watershed</strong> <strong>management</strong> <strong>plan</strong>. Margaret Fowler,<br />
MK<strong>SWCD</strong> office manager, also contributed significantly to the project. Two University of<br />
Hawai‘i graduate students – Katie Gaut and James Tait – conducted their thesis work in the<br />
Wai‘ula‘ula <strong>watershed</strong>, providing information beneficial to the <strong>watershed</strong> <strong>plan</strong>ning effort.<br />
This <strong>watershed</strong> <strong>plan</strong>ning process has been a multi-year effort to develop relationships, educate<br />
residents of the <strong>watershed</strong> on water quality issues, and seek land users and community help to<br />
identify contributing pollution sources in the <strong>watershed</strong> and recommend specific actions<br />
needed to effectively control sources of pollution. While a <strong>watershed</strong> advisory group was<br />
initially formed in December 2005 to provide input into the <strong>watershed</strong> <strong>management</strong> <strong>plan</strong>ning<br />
efforts, the MK<strong>SWCD</strong> found that attendance was generally low. There are many community<br />
organizations and committees already in existence, and people were not interested in<br />
attending yet another meeting. Instead, the MK<strong>SWCD</strong> decided to meet with existing<br />
organizations and committees and seek input that way.<br />
Presentations were made at the following community meetings:<br />
April 18, 2006<br />
December 20, 2006<br />
March 1, 2007<br />
June 1, 2009<br />
REEFTALK public presentation at Thelma Parker Library<br />
Waimea Community Development Plan (CDP) Committee<br />
Waimea Community Association<br />
Watershed Public Event at Kahilu Theatre<br />
12<br />
Wai‘ula‘ula Watershed Management Plan MK<strong>SWCD</strong>
A community stream cleanup was held on April 12, 2008, and <strong>watershed</strong> personnel helped<br />
Parker School teachers and students with several additional stream cleanups. Presentations<br />
were made at the local schools about the <strong>watershed</strong>, and the MK<strong>SWCD</strong> regularly participated in<br />
local community events, such as festivals and fairs.<br />
In addition, there were numerous one-on-one meetings and site visits with land owners, land<br />
users, government personnel, school teachers, individuals, and other stakeholders to seek<br />
background information, to identify threats and sources of pollution, and to identify and discuss<br />
potential implementation projects. This regular dialogue with land owners, agency personnel,<br />
and other stakeholders helped shape the goals, objectives, and specific projects described in<br />
the WWMP. In particular, the District wanted to be sure there was “buy-in” from land users<br />
and responsible parties for the proposed projects.<br />
Stakeholders – defined as people or groups who have a stake, or an interest, in the outcome of<br />
a project – that contributed to the <strong>plan</strong>ning process fall into several categories:<br />
Land Owners/ Leasees:<br />
o Department of Land and Natural Resources<br />
o Hawai‘i County Department of Water Supply<br />
o Parker Ranch<br />
o KTA Shopping Center<br />
o Parker School<br />
o Hawai‘i Preparatory Academy<br />
o FR Cattle Co.<br />
o Queen Emma Land Co.<br />
o <strong>Mauna</strong> <strong>Kea</strong> Properties<br />
o County of Hawai‘i<br />
o State of Hawai‘i Department of Transportation<br />
o Various other private landowners adjacent to streams<br />
Government Agencies:<br />
o US Environmental Protection Agency<br />
o National Oceanic and Atmospheric Administration<br />
o US Geological Survey<br />
o US Army<br />
o Hawai‘i Department of Health<br />
o Hawai‘i Department of Land and Natural Resources<br />
o Commission on Water Resources Management<br />
o Hawai‘i Land Based Sources of Pollution LAS<br />
o Hawai‘i County Department of Public Works<br />
o Hawai‘i County Department of Water Supply<br />
13<br />
Wai‘ula‘ula Watershed Management Plan MK<strong>SWCD</strong>
14<br />
Community Groups, Organizations and Businesses:<br />
o Hawai‘i Wildfire Management Organization<br />
o Waimea Community Association<br />
o Waimea Outdoor Circle<br />
o Waimea Trails and Greenways<br />
o Starbucks<br />
Educational Institutions:<br />
o University of Hawai‘i at Hilo<br />
o Cornell University<br />
o Massachusetts Institute of Technology<br />
There were a number of documents that helped guide the development of this <strong>management</strong><br />
<strong>plan</strong>. The first is EPA’s Handbook for Developing Watershed Plans to Restore and Protect Our<br />
Waters (EPA 2005). While the document did not provide information to address specific issues<br />
that arise out of Hawai‘i’s unique environment (e.g., models, load reduction estimations,<br />
absence of data), it did provide a detailed process for building partnerships, gathering data,<br />
setting goals, and identifying <strong>management</strong> strategies. Its worksheets were particularly helpful<br />
in terms of asking the right questions of stakeholders and organizing information.<br />
The Guidance Specifying Management Measures for Sources of Nonpoint Pollution in Coastal<br />
Waters (EPA 1993) and the Updated Management Measures for Hawai‘i’s Coastal Nonpoint<br />
Pollution Control Program (Stewart 2009) were used to provide direction on potential sources<br />
of polluted runoff in the <strong>watershed</strong> and on the range of <strong>management</strong> strategies available to<br />
addresses those sources. Throughout the <strong>watershed</strong> <strong>plan</strong>ning process, MK<strong>SWCD</strong> made every<br />
effort to incorporate relevant Coastal Nonpoint Pollution Control Program 1 (CNPCP)<br />
<strong>management</strong> measures into the WWMP.<br />
In the context of the CNPCP, <strong>management</strong> measures are defined as “economically achievable<br />
measures for the control of pollutants from existing and new categories and classes of nonpoint<br />
sources of pollution, which reflect the greatest degree of pollutant reduction achievable<br />
through the application of the best available nonpoint pollution control practices, technologies,<br />
processes, siting criteria, operating methods, and other alternatives” (EPA 1993, p. 1-5). More<br />
simply stated, each <strong>management</strong> measure can be thought of as a goal towards which the State,<br />
county, local communities, and landowners can strive in order to improve water quality.<br />
As part of the <strong>plan</strong>ning process, the relevant <strong>management</strong> measures provided a starting point<br />
to help with development of goals and objectives for the Wai‘ula‘ula <strong>watershed</strong>, and<br />
recommended actions (“best <strong>management</strong> practices” or BMPs) to achieve those goals and<br />
1 In 1990, the US Congress required coastal states to develop and implement coastal nonpoint pollution control<br />
programs (CNPCP) to be approved by the National Oceanic and Atmospheric Administration (NOAA) and the US<br />
Environmental Protection Agency (EPA). The CNPCP, jointly administered by Hawai‘i’s Coastal Zone<br />
Management (CZM) Program and the Department of Health (DOH) is designed to protect coastal waters from<br />
polluted runoff and restore impaired coastal water quality.<br />
Wai‘ula‘ula Watershed Management Plan MK<strong>SWCD</strong>
objectives. They were used as a checklist of sorts to ensure that all existing and potential<br />
sources of water pollution in the <strong>watershed</strong> were addressed comprehensively. Some identified<br />
threats in the <strong>watershed</strong> are not directly related to water pollution (e.g., climate change,<br />
unexploded ordnance). However, they have a direct impact of overall <strong>watershed</strong> health and<br />
habitat integrity that sustains a health mauka to makai connection and ultimately contributes<br />
to nearshore water quality.<br />
Using best professional judgment, <strong>management</strong> actions were assessed and prioritized based on<br />
a number of criterion, including load reduction potential, size of <strong>watershed</strong> effected, landowner<br />
buy-in, cost, ease of implementation, and community exposure (to facilitate education and<br />
outreach). This process, described in more detail in Chapter 5, resulted in projects being placed<br />
in high, medium, and low priority levels for implementation. These priority levels translated<br />
into an implementation schedule spanning 15 years. An adaptive <strong>management</strong> approach is<br />
recommended for <strong>plan</strong> implementation, so that as we learn from actions taken, future<br />
<strong>management</strong> strategies can be altered as necessary in response. While MK<strong>SWCD</strong> will lead the<br />
overall implementation of the <strong>management</strong> actions, a specific project lead is identified for each<br />
project described in Chapter 5 and Appendix A.<br />
15<br />
Wai‘ula‘ula Watershed Management Plan MK<strong>SWCD</strong>
Chapter 2: Watershed Description<br />
2.1 Physical and Natural Features<br />
2.1.1 Watershed Boundaries<br />
A <strong>watershed</strong> is the land area that drains water to a stream, river, lake or ocean. These drainage<br />
areas are normally confined by topographic divides, such as ridgelines. Hawai‘i’s <strong>watershed</strong>s<br />
tend to be small, in comparison to Mainland systems, short in length, and steep. On the<br />
geologically-young island of Hawai‘i, <strong>watershed</strong>s also tend to display simple stream networks<br />
with few tributaries and have shallow, often poorly-defined channels.<br />
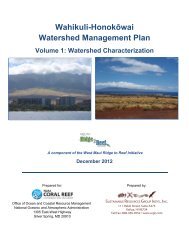
The Wai‘ula‘ula <strong>watershed</strong> is located in South Kohala, on the northwest coast of Hawai‘i Island.<br />
According to the <strong>watershed</strong> layer in the Hawai‘i State Geographic Information System (GIS), this<br />
<strong>watershed</strong> stretches from the tops of Kohala Mountain and <strong>Mauna</strong> <strong>Kea</strong>, flowing down into<br />
inner Kawaihae Bay near the <strong>Mauna</strong> <strong>Kea</strong> Beach Resort, a distance of less than 15 miles. As<br />
delineated using the island’s 10-meter Digital Elevation Model (DEM), this <strong>watershed</strong><br />
encompasses an area of about 32,000 acres or 50 square miles (Figure 1).<br />
Figure 1: Original Watershed Boundary<br />
16<br />
Wai‘ula‘ula Watershed Management Plan MK<strong>SWCD</strong>
As the <strong>Mauna</strong> <strong>Kea</strong> Soil and Water Conservation District (MK<strong>SWCD</strong>) began examining the<br />
<strong>watershed</strong> more closely, there were questions raised about the fate of runoff from the <strong>Mauna</strong><br />
<strong>Kea</strong> “leg” of the <strong>watershed</strong>. It appears that runoff from this section of the <strong>watershed</strong> does not<br />
get into the stream systems of the <strong>watershed</strong> that outlet into Kawaihae Bay, but rather collects<br />
in the broad, flat plain of the <strong>Mauna</strong> <strong>Kea</strong> – Kohala saddle. Because the <strong>watershed</strong> boundary<br />
data would be used in the N-SPECT model to help determine pollutant loading and estimate<br />
load reductions, it was important to ensure that the MK<strong>SWCD</strong> was using appropriate <strong>watershed</strong><br />
boundaries.<br />
Because the MK<strong>SWCD</strong> was concerned that using the existing <strong>watershed</strong> boundary would skew<br />
modeling results, render the N-SPECT outputs meaningless, and lead the MK<strong>SWCD</strong> to focus its<br />
resources to implement <strong>management</strong> measures in an area in which it would be unable to<br />
demonstrate significant pollutant load reductions, the MK<strong>SWCD</strong> revised the <strong>watershed</strong><br />
boundaries for the purposes of this <strong>watershed</strong> <strong>management</strong> project. For the purposes of this<br />
WWMP and project, the upper <strong>Mauna</strong> <strong>Kea</strong> boundary follows Mamalahoa Highway, thereby<br />
eliminating the <strong>Mauna</strong> <strong>Kea</strong> “leg.” The revised <strong>watershed</strong> boundary encompasses an area of<br />
18,370 acres or 28.7 square miles (Figure 2).<br />
Figure 2: Revised Watershed Boundary<br />
17<br />
Wai‘ula‘ula Watershed Management Plan MK<strong>SWCD</strong>
2.1.2 Hydrology<br />
The hydrology of the Wai‘ula‘ula <strong>watershed</strong> is very complex. “Overall, the base-flow<br />
characteristics of streams are controlled by the distribution of ground water, which, in turn, is<br />
controlled by the local geologic setting and climatic conditions. Dike-impounded and perched<br />
ground-water bodies are typical sources of perennial discharge that sustain streamflow at<br />
higher elevations” (Tribble 2008 p. 13). In the Wai‘ula‘ula <strong>watershed</strong>, a low-permeability layer<br />
not far below the ground surface is likely causing a perched waterbody that forms the bog at<br />
the top of Kohala Mountain that provides the water for the streams. The <strong>watershed</strong>'s<br />
hydrology is further complicated by high permeability geologic formations that cause base-flow<br />
to disappear from some places within streams, only to reappear further downstream.<br />
Withdrawals of water from the upper reaches of several primary streams for domestic and<br />
agricultural uses also reduce the natural flow of water downstream. At this time, because of<br />
the upstream withdrawals, the streams are generally perennial in their upper reaches but only<br />
flow in the lower reaches during storm events.<br />
2.1.2.1 Surface Water Resources<br />
The natural surface water resources in the <strong>watershed</strong> are limited to streams and the u<strong>plan</strong>d<br />
montane bogs that feed them. The upper elevations of the Wai‘ula‘ula <strong>watershed</strong> comprise<br />
‘ohi‘a mixed shrub and ‘ohi‘a/‘ōlapa montane wet forest types. These bogs form in areas<br />
where low permeability soil hinders drainage, causing standing water to accumulate. Hawai‘i<br />
Island bogs are characterized primarily by sedges, sphagnum moss, and low-stature ‘ohi‘a of<br />
varying density (Cuddihy and Stone 1990). These wet forests are unique <strong>plan</strong>t communities<br />
(described under Section 2.1.9) that serve as natural sponges that store water for slow release<br />
into Kohala Mountain’s various stream systems.<br />
The primary tributaries of the Wai‘ula‘ula <strong>watershed</strong> are Waikoloa and <strong>Kea</strong>nu’i’omanō streams,<br />
both of which originate at over 4,000-ft. elevation on Kohala Mountain and flow relatively<br />
parallel to one another until they join in a series of braided channels at about the 1,440-ft.<br />
elevation to form Wai‘ula‘ula, which terminates in the ocean in Kawaihae Bay (Figure 3).<br />
<strong>Kea</strong>nu’i’omanō originates from two smaller intermittent tributaries, Wai‘aka (which becomes<br />
Lanikepu Stream) and Hale‘aha, as well as Kohākōhau Stream, which is considered perennial. It<br />
is called <strong>Kea</strong>nu’i’omanō stream below the 2,200-ft. elevation. Two additional intermittent<br />
streams join <strong>Kea</strong>nu’i’omanō just below this elevation -- ‘Ōuli and Mamaewa (which includes<br />
Momoualoa upslope). A small intermittent tributary of Kohākōhau stream is ‘O‘olāmakapehu.<br />
(See Figure 4.)<br />
Waikoloa Stream has no tributaries. While, historically, Waikoloa Stream has been considered<br />
perennial, “it is unclear whether [it] is now intermittent, with perhaps some occasional<br />
permanent pools downstream of Waimea, because of … numerous diversions and reservoirs”<br />
upstream (Englund et al. 2002). The Hawai‘i Stream Assessment (CWRM 1990) classifies<br />
Waikoloa Stream as intermittent with year-round flow in the upper reaches and intermittent<br />
flow in the lower sections.<br />
18<br />
Wai‘ula‘ula Watershed Management Plan MK<strong>SWCD</strong>
Figure 3: Overview of Streams in the Watershed<br />
Figure 4: Upper Tributaries of Watershed<br />
19<br />
Wai‘ula‘ula Watershed Management Plan MK<strong>SWCD</strong>
Wai‘ula‘ula Stream is considered a “losing” or influent stream, because it loses water as it flows<br />
downstream. Losing streams are common in arid landscapes. Much of the loss of its flow<br />
probably occurs in the middle to lower reaches as stream flow disappears into the alluvium.<br />
This is substantiated by the small stream channel and estuary at the ocean.<br />
The average or “mean” annual daily flow at Waikoloa and Kohākōhau, the only streams that are<br />
currently gauged, is 9.12 cubic feet per second (cfs) (5.89 million gallons per day (mgd)) and<br />
9.82 cfs (6.35 mgd), respectively 2 . However, this mean flow likely occurs only 20-30% of the<br />
time (Rick Fontaine, pers. comm.). It is probably more revealing to look at the median flow on<br />
the flow duration curves for these streams. The median daily discharge for Waikoloa stream is<br />
4.3 cfs (2.78 mgd) and for Kohākōhau stream 2.2 cfs (1.42 mgd) (Oki 2007). Even this level of<br />
flow requires it to have rained recently (Rick Fontaine, pers. comm.). On a more typical day,<br />
streamflow in Hawaiian streams is within the 70-75% range (meaning the percentage of time<br />
discharge equaled or exceeded this amount), or between 2.5-2.8 cfs (1.62-1.81 mgd) for<br />
Waikoloa and 0.76-0.95 cfs (0.49-0.61 mgd) for Kohākōhau. The gauges on Waikoloa Stream<br />
near the Marine Dam (USGS gauge number 16758000) and Kohākōhau Stream (USGS gauge<br />
number 16756100) provide real time data accessible via the Internet.<br />
Waikoloa Stream near headwaters<br />
Maximum instantaneous flow recorded at Waikoloa Stream was 3,410 cfs in November 1979.<br />
Data available for Kohākōhau Stream since 1998 indicate a maximum instantaneous flow of<br />
1,860 cfs recorded in March 2004. During storm events, the stream level and flow can increase<br />
2 Average (“mean”) annual discharge for Waikoloa (data from 1948-2009) ranges from 3.87 cfs (1962) to 15.3 cfs<br />
(1998). Average annual discharge for Kohākōhau (data from 1999-2009) ranges from 4.51 cfs (2008) to 14.0 cfs<br />
(1999).<br />
20<br />
Wai‘ula‘ula Watershed Management Plan MK<strong>SWCD</strong>
apidly, demonstrating the flashiness of Hawaiian streams. There is a significant lag time<br />
between peak flow at the upper stream gauges (3,460-ft. and 3,470-ft. elevations) and the<br />
monitoring site at the mouth of Wai‘ula‘ula, a distance, following the stream channels, of less<br />
than 12 miles. The time it takes for water to flow this distance is on the order of 1-3 hours.<br />
There are permanent stream pools in the streams below Waimea that are apparently receiving<br />
some groundwater input. Englund (2010) noted this, as suggested by the difference between<br />
surface and sub-surface water temperatures in the pools. He noted that these permanent<br />
groundwater-fed pools are important “stepping stones” for native aquatic fish species as they<br />
travel upstream to access the upper reaches of the <strong>watershed</strong>. During recent site visits to some<br />
of these pools, it was observed that water-loving <strong>plan</strong>ts, such as ferns, were growing in cracks<br />
on the rocky faces surrounding the pools, despite long-term drought conditions. Englund<br />
(2010) also noted that the presence of a large, native great bulrush ‘aka‘akai (Schoenoplectus<br />
juncoide), the roots of which provide habitat for native dragonfly larvae such as Anax junius and<br />
Pantala flavenscens, appears to be “a good indicator of permanent spring-fed pool areas within<br />
the lower <strong>watershed</strong> area” (p. 7).<br />
Evidence of Groundwater Seepage<br />
Within Stream Channel<br />
In 2005, the Hawai‘i Commission on Water Resource Management (CWRM) adopted surface<br />
water hydrologic units and a coding system for Hawai‘i’s <strong>watershed</strong>s, after a review of the<br />
Hawai‘i Stream Assessment (CWRM 1990), State Delineation of Watersheds (GDSI 1994), and<br />
Refinement of Hawai‘i Watershed Delineations (GDSI 1999). The majority of hydrologic unit<br />
21<br />
Wai‘ula‘ula Watershed Management Plan MK<strong>SWCD</strong>
oundaries closely match drainage basin boundaries (CWRM 2005). The surface water<br />
hydrologic unit code is a unique combination of four digits (CWRM 2005). The first digit<br />
identifies the island and the following three digits the specific hydrologic unit. A Hawaiian<br />
geographic name or local geographic term is also used. The Wai‘ula‘ula <strong>watershed</strong> is identified<br />
as Waikoloa 8161. According to CWRM's Water Resource Protection Plan (2008), the Waikoloa<br />
surface water hydrologic unit encompasses 51.96 square miles (less with our revised<br />
boundaries), 11 diversions, 4 gauges, and 2 active gauges.<br />
The State is in the process of establishing instream flow standards for the perennial streams, in<br />
order to balance maintenance of fish and wildlife habitat, estuarine, wetland and stream<br />
ecosystems, and water quality with use of the water (CWRM 2005). Section 13-169-46 of the<br />
Hawai‘i Administrative Rules (HAR), adopted in 1988, establishes interim instream flow<br />
standards (IFS) for Hawai‘i. These were generally defined as the amount of water flowing in<br />
each stream on the effective date of the standard. Standards for some individual streams have<br />
subsequently been amended as a result of petitions to amend the IFS and describe the amount<br />
of water that can be withdrawn from the stream. Specific instream flow standards have not<br />
been established for any streams within the Wai‘ula‘ula <strong>watershed</strong>.<br />
2.1.2.2 Groundwater Resources<br />
Groundwater on Hawai‘i Island occurs as both a freshwater basal lens floating on denser<br />
underlying seawater near the coast and as high-level aquifers further inland impounded by<br />
lower permeability rocks. Generally, the source of freshwater in the higher elevations is<br />
groundwater recharge from infiltration of rainfall and fog drip, as well as irrigation water. The<br />
island’s subsurface geology controls the movement and occurrence of groundwater (Bauer<br />
2003). Unfortunately, this has not been as well studied as the superficial geology. In the<br />
Wai‘ula‘ula <strong>watershed</strong>, it is likely that lava flows from <strong>Mauna</strong> <strong>Kea</strong> overlay earlier flows from<br />
Kohala Mountain, affecting the local presence and movement of groundwater. (See Section<br />
2.1.8 “Geology.”)<br />
As a rule, groundwater normally moves from higher elevations to lower elevations and from<br />
locations of higher pressure to locations of lower pressure. The flow rate is proportional to the<br />
slope of the water table (top surface of groundwater). This slope is known as the hydraulic<br />
gradient, which is generally expressed in feet per mile. In most cases, the direction of<br />
groundwater flow is controlled by the hydraulic gradient, but is also influenced by the direction<br />
that lava layers are dipping. Bauer (2003) reports that “[n]ormal ground-water gradients range<br />
from less than one foot per mile to greater than 3 ft. per mile in South Kohala in the<br />
Lālāmilo/‘Ōuli area. Generally, steeper ground-water gradients either reflect higher rainfall and<br />
recharge or lower hydraulic conductivity” (p. 21). The hydraulic conductivity is a measure of<br />
how easily water can flow through rocks. Bauer goes on to say:<br />
The steep ground-water gradient between ‘Ōuli 1 and 2 wells… may be attributed to the<br />
lower hydraulic conductivity associated with denser and typically thicker Hawaiite lavas<br />
(and possibly mugearite, if indeed, the bottom of these wells penetrates into Kohala<br />
lavas). Because of the arid conditions of South Kohala, the steep gradient … may be the<br />
22<br />
Wai‘ula‘ula Watershed Management Plan MK<strong>SWCD</strong>
esult of low hydraulic conductivity of the lavas rather than from direct recharge by<br />
rainfall. However, an influx of high-level ground-water from the Waimea-Kamuela<br />
region could be enough to increase the ground-water gradient (p. 21-22).<br />
The Kohala Aquifer Sector Area (ASEA) includes the Hawi (80101), Waimanu (80102) and<br />
Māhukona (80103) aquifer system areas (see Figure 5), with an estimated total sustainable<br />
yield of 154 million gallons per day (mgd) (DWS 2006). A portion of the Wai‘ula‘ula <strong>watershed</strong>,<br />
including the headwaters of all its streams, falls within the Māhukona aquifer system area. The<br />
southern portion of the Wai‘ula‘ula <strong>watershed</strong> falls within the Waimea aquifer system (80301)<br />
in the West <strong>Mauna</strong> <strong>Kea</strong> ASEA. In addition, water from the Waimanu aquifer system area is<br />
transmitted via the Upper Hāmākua Ditch and pipelines to Waimea to provide agricultural<br />
water for the Lālāmilo farmers.<br />
Figure 5: Groundwater Aquifers<br />
In response to competition for water resources in the early 1990s and the lack of basic water<br />
level data, CWRM initiated a groundwater monitoring program in 1991. Since then, CWRM has<br />
taken groundwater elevation measurements from 40 public and private wells and test holes<br />
23<br />
Wai‘ula‘ula Watershed Management Plan MK<strong>SWCD</strong>
throughout the North and South Kona and South Kohala districts, including from two within the<br />
Wai‘ula‘ula <strong>watershed</strong> (‘Ōuli 1 and 2). An analysis of these data found that water levels in the<br />
basal lens vary with rainfall (Bauer 2003). The direction of groundwater flow within the basal<br />
lens was also found to vary over time. This could affect the path taken by pollutants introduced<br />
into groundwater. The data also documented declining water levels in some compartments of<br />
the high-level groundwater occurring south of Hualalai’s NW rift zone. The data analysis did<br />
not examine high-level groundwater occurring in or near the Wai’ula’ula <strong>watershed</strong>, however.<br />
In addition to the wells analyzed in the Bauer report, there is one additional well that has been<br />
monitored. The Kawaihae W-3 well (6147-01; USGS 200132155471101) is at the edge of the<br />
Wai‘ula‘ula <strong>watershed</strong> at the 982-ft. elevation along Kawaihae Road. The USGS has measured<br />
its water levels regularly since 1975.<br />
2.1.3 Climate and Precipitation<br />
Because of the steepness of Hawai‘i’s <strong>watershed</strong>s, their climates vary considerably by elevation.<br />
The upper elevations of the Wai‘ula‘ula <strong>watershed</strong> are typically wet and cool, while the<br />
coastline is hot and arid. The <strong>watershed</strong> is typically affected by a regular pattern of orographic<br />
cloud formation and precipitation. During typical trade wind weather, the wind blows from the<br />
northeast direction and rising moist air cools, forming clouds over the top of Kohala Mountain.<br />
The cooled clouds drop moisture in the form of rain and fog drip, keeping these upper, forested<br />
elevations wet. Fog drip is the direct interception of water from clouds or fog by vegetation.<br />
“Fog drip is likely an important contribution to the hydrologic budget in Hawai‘i’s forested areas<br />
frequently enveloped in clouds. This is especially true when there is little or no precipitation<br />
occurring” (CWRM 2008).<br />
Bog on Kohala Mountain<br />
The clouds formed by the typical trade wind weather rarely make it to the leeward and makai<br />
reaches of the <strong>watershed</strong>. These areas are typically dry and receive most of their moisture<br />
during Kona storms and localized convection events during the winter months (November to<br />
March). Drought conditions in the <strong>watershed</strong> in recent years have exacerbated the dry<br />
24<br />
Wai‘ula‘ula Watershed Management Plan MK<strong>SWCD</strong>
conditions in the lower <strong>watershed</strong>. According to DLNR’s Commission on Water Resources<br />
Management, severe drought conditions affected North Hawai‘i or Kohala in 1996, 1998-1999,<br />
2002-2003, 2007-2008, and 2010. The most severe droughts of the past 15 years are<br />
associated with El Nino events.<br />
The Rainfall Atlas of Hawai‘i (Giambelluca et al. 1986) contains monthly and annual rainfall<br />
maps for each island, which generally serve as the standard isohyet maps for use in estimating<br />
precipitation across a <strong>watershed</strong> (Figure 6). Annual rainfall in the <strong>watershed</strong> varies from about<br />
120 inches in the upper elevations to 7 inches at the coast. In Waimea, the rainfall is highly<br />
variable, ranging between 20 and 60 inches per year.<br />
There are two rain gauges in the <strong>watershed</strong> that are part of the National Weather Service<br />
Hydronet: KUUH1 Kamuela Upper; and KMUH1 Kamuela 1. With recent technological<br />
improvements, there are more and more weather stations being established within the<br />
<strong>watershed</strong> by individuals. Many of these can be found on Weather Underground<br />
(www.wunderground.com). However, as a more recent phenomenon, these stations provide<br />
current and very recent weather data, but not historical.<br />
Figure 6: Annual Precipitation<br />
25<br />
Wai‘ula‘ula Watershed Management Plan MK<strong>SWCD</strong>
As noted above, trade winds dominate the <strong>watershed</strong> area. It is during winter months that the<br />
major storms occur and the heaviest rains fall. The storms may blow in from any direction but<br />
are typically from the south, southwest, or southeast (Kona storms). Mumuku, fierce gusts of<br />
wind from the northeast, also blow in the <strong>watershed</strong>.<br />
Temperatures in the <strong>watershed</strong> are also highly variable and dependent on elevation, weather<br />
and time of year. Temperatures at higher elevations are typically cooler, while the coast enjoys<br />
year-round averages of 70 to 87ºF. In the Waimea area, average temperatures range from 55ºF<br />
to 75ºF. According to DHHL (2002), “the extreme minimum temperature recorded at Waimea<br />
is 34 ºF, while the extreme maximum temperature is 90 ºF” (p. 4-1).<br />
2.1.4 Flood Plains<br />
FEMA has developed Flood Insurance Rate Maps or FIRMs for Hawai‘i Island. Figure 7 shows<br />
the flood hazard rating map for the Wai‘ula‘ula <strong>watershed</strong>. Zone A is the flood insurance rate<br />
zone that corresponds to the 1% annual chance floodplains that are determined in the Flood<br />
Insurance Study (FIS) by approximate methods of analysis. This translates into the 100-year<br />
floodplain. Zone X500 corresponds to the 500-year floodplain. There is one small area within<br />
Waimea town that falls into Zone X500.<br />
Flooding has been identified as a problem in the Wai‘ula‘ula <strong>watershed</strong>. Flooding of downtown<br />
Waimea and of roads crossing streams has been a particular concern. While flooding has been<br />
a reality for decades in Waimea, it has become an even greater problem as more and more<br />
development occurs within or adjacent to flood prone areas. As more impervious surfaces are<br />
created through increased urban and suburban development, these hardened surfaces prevent<br />
infiltration and generate greater volumes of stormwater runoff.<br />
26<br />
Wai‘ula‘ula Watershed Management Plan MK<strong>SWCD</strong>
27<br />
Figure 7: Flood Insurance Rate Maps for Waimea and the Coast<br />
Wai‘ula‘ula Watershed Management Plan MK<strong>SWCD</strong>
2.1.5 Riparian Areas<br />
Most of the streams within the Wai‘ula‘ula <strong>watershed</strong> do not have adequate vegetated buffers<br />
to intercept runoff. While fully vegetated, connected riparian corridors exist in the upper<br />
reaches of many of the streams, extensive riparian vegetation generally disappears outside of<br />
the conservation district, where land conversion to agriculture and urban/suburban<br />
development has taken place. The pockets of vegetation that exist at lower elevations often<br />
comprise invasive species, such as Christmas berry (Schinus terebinthifolius), that tend to grow<br />
in the stream channel itself, impeding stream flow and altering aquatic habitat.<br />
2.1.6 Dams and Diversions<br />
There are five structures considered dams in the Wai‘ula‘ula <strong>watershed</strong>. Three of the<br />
Department of Water Supply (DWS) reservoirs above Waimea are considered dams because of<br />
the heights of the reservoir walls impounding water. There are two dams impounding water in<br />
streams, described below. Based on inventoried storage (
Marine Dam (left) and Kohākōhau Dam (right)<br />
2.1.6.2 Kohākōhau Dam<br />
Planning for the development of Kohākōhau Dam started in the mid-1960s, and, by 1975, it was<br />
supplying water to Waimea and the surrounding area. This diversion dam is located on<br />
Kohākōhau Stream at the 3,470-ft. elevation. The dam is approximately 5-ft. high at the sides<br />
and 10-ft. high in the middle and about 45-ft. long. With development pressures along the<br />
Kohala and Waikoloa coasts, there was a major push to expand Kohākōhau Dam to increase its<br />
capacity. This would have required inundation of additional lands in the Kohala <strong>watershed</strong>.<br />
While strong community opposition slowed progress on the Kohākōhau Dam expansion project,<br />
the 1970s discovery and development of potable groundwater in the Lālāmilo area eased<br />
pressure to expand Kohākōhau Dam to create a larger impoundment area.<br />
2.1.6.3 Diversions<br />
In addition to DWS’s permitted diversions, there are many other legal, as well as illegal,<br />
diversions within the Wai‘ula‘ula <strong>watershed</strong>, withdrawing stream water from Waikoloa,<br />
Kohākōhau, and <strong>Kea</strong>nu‘i‘omanō streams for private use. The total amount being withdrawn on<br />
an annual basis from both legal and illegal diversions is currently unknown. It is significant,<br />
however, and likely contributes to the fact that the once-perennial streams are no longer<br />
perennial in the lower reaches.<br />
Parker Ranch is permitted by the Water Commission to withdraw 420,000 gallons per day total<br />
from three intakes on Waikoloa Stream (above the Marine Dam), Kohākōhau Stream (above<br />
Kohākōhau Stream), and Alakahi Stream (which is not in the Wai‘ula‘ula <strong>watershed</strong>). Most of<br />
these intakes were developed in the early 20 th century and were grandfathered in when Section<br />
13-169-46, HAR, was adopted in 1988. The Commission on Water Resources Management has<br />
also permitted diversions on Kohākōhau Stream to Perry-Fiske (operated by the State) and the<br />
State Department of Agriculture. There are seven permitted diversions on <strong>Kea</strong>nu‘i‘omanō<br />
29<br />
Wai‘ula‘ula Watershed Management Plan MK<strong>SWCD</strong>
Stream 3 , including one which diverts water from <strong>Kea</strong>nu‘i‘omanō Stream via ‘Ōuli ‘auwai for use<br />
by members of the Kanehoa ‘Auwai Compact for irrigation of landscape and windbreak on<br />
eleven properties totaling 59.4 acres.<br />
Regular site visits along <strong>Kea</strong>nu‘i‘omanō Stream reveal numerous unpermitted withdrawals from<br />
the stream by residents of the Kanehoa and Anekona neighborhoods. These diversions<br />
normally consist of pipes or pumps inserted into the stream to withdraw water for storage in<br />
water tanks for use for landscape irrigation. There are at least a dozen unpermitted diversions<br />
within the <strong>watershed</strong>.<br />
Diversion intake in <strong>Kea</strong>nu‘i‘omanō Stream<br />
2.1.7 Topography and Elevation<br />
The Wai‘ula‘ula <strong>watershed</strong> extends from the 5,260-ft. elevation on Kohala Mountain to sea<br />
level over a distance of 8.5 miles, if measured as a straight line from headwater to estuary. The<br />
upper elevations are generally steeply sloped and bisected by deep gulches. From about 2,500-<br />
ft. in elevation, the terrain is rugged but more gently sloped. (See Figure 8.)<br />
3 Baldwin, Jardine, Perry-Fiske, Schulze, Wallach, Giacometti, and Wasowski.<br />
30<br />
Wai‘ula‘ula Watershed Management Plan MK<strong>SWCD</strong>
Figure 8: Topography of the Watershed<br />
2.1.8 Geology and Soils<br />
The Wai‘ula‘ula <strong>watershed</strong> is located in the saddle between Kohala Mountain and <strong>Mauna</strong> <strong>Kea</strong>,<br />
where the <strong>Mauna</strong> <strong>Kea</strong> lavas ponded against the older Kohala dome (Clark 1986). As a result,<br />
the lands of the <strong>watershed</strong> comprise the geological substrates of both mountains.<br />
Kohala is the oldest of the five volcanoes on Hawai‘i Island, emerging above sea level more than<br />
500,000 years ago. It last erupted about 120,000 years ago in the late Pleistocene era (USGS<br />
HVO website: http://hvo.wr.usgs.gov/volcanoes/kohala/). “The last eruptions were moderately<br />
explosive and formed a series of large cinder cones that stud the Kohala Mountain surface<br />
above Waimea” (Macdonald et al. 1983: p. 353). Kohala Mountain is now considered extinct<br />
and in a transition between post-shield and erosional stages of its life cycle. In contrast to the<br />
highly eroded valleys of the windward side of Kohala Mountain, erosion has made little<br />
headway on the leeward side (Macdonald et al. 1983).<br />
31<br />
Wai‘ula‘ula Watershed Management Plan MK<strong>SWCD</strong>
<strong>Mauna</strong> <strong>Kea</strong>, the tallest mountain on Hawai‘i Island, is in the post-shield phase and considered<br />
dormant. It last erupted about 4,500 years ago. The oldest exposed lava flows on the<br />
mountain are about 250,000 years old. <strong>Mauna</strong> <strong>Kea</strong>’s last eruptions were more explosive than<br />
those of the shield-building phase, with viscous magma containing more gas, and produced<br />
widespread ash deposits downwind of the mountain. The fertile soils in Waimea are a result of<br />
these ash deposits.<br />
Figure 9: Soil Types in the Watershed<br />
The <strong>watershed</strong>’s geology has implications for both soil types and hydrology, as noted above.<br />
The geological substrate consists of lava flows of several volcanic series. The predominate soil<br />
types in the <strong>watershed</strong> are listed below and shown in Figure 9.<br />
• Amalu (rAM) – poorly drained; 3-35% slopes; meets hydric criteria;<br />
• Kahua (KCD) – silty clay loam, somewhat poorly drained; 6-20% slopes;<br />
• Maile (MLD) – well drained silt loams that formed in volcanic ash; 6-20% slopes;<br />
moderately rapid permeability, slow runoff, slight erosion hazard;<br />
32<br />
Wai‘ula‘ula Watershed Management Plan MK<strong>SWCD</strong>
• Palapalai (PLC) – well drained silt loams that formed in volcanic ash; 6-12% slopes;<br />
moderately rapid permeability, slow runoff, slight erosion hazard;<br />
• Waimea (WMC) – well drained very fine sandy loam that formed in volcanic ash; 6-12%<br />
slopes; moderately rapid permeability, slow runoff, slight erosion hazard;<br />
• Waimea (WSD) – well drained extremely stony very fine sandy loam that formed in<br />
volcanic ash; 12-20% slopes; moderately rapid permeability, medium runoff, moderate<br />
erosion hazard;<br />
• Puu Pa (PVD) – well drained extremely stony very fine sandy loam that formed in<br />
volcanic ash; 6-20% slopes; moderately rapid permeability, medium runoff, moderate<br />
erosion hazard; and<br />
• Kawaihae (KNC) – somewhat excessively drained extremely stony very fine sandy loam;<br />
6-12% slopes; moderate permeability, medium runoff, moderate erosion hazard.<br />
Figure 10 shows the soil erodibility. Soil erodibility is an estimate of the soil’s ability to resist<br />
erosion, based on the physical characteristics of the soil. The <strong>watershed</strong>’s soil erodibility is the<br />
highest in the dry, sparsely-vegetated and fire-prone lower <strong>watershed</strong>, greatly increasing the<br />
risk of erosion from this area.<br />
Figure 10: Soil Erodibility<br />
33<br />
Wai‘ula‘ula Watershed Management Plan MK<strong>SWCD</strong>
2.1.9 Vegetation<br />
The Wai‘ula‘ula <strong>watershed</strong> comprises several broad types of vegetation: forest, grassland,<br />
scrub/shrub and cultivated land. With the exception of the forested headwaters, much of the<br />
<strong>watershed</strong>’s vegetation has been altered over time. In fact, McEldowney (1983) found that<br />
nearly 75% of the vegetation in the area surveyed was composed of introduced grass species.<br />
The forested section of the <strong>watershed</strong> primarily encompasses wet, predominantly-native ‘ohi‘a<br />
rainforest, more specifically an ‘ohi‘a/‘ōlapa Montane Wet Forest. ‘Ohi‘a (Metrosideros<br />
polymorpha) and ‘ōlapa (Cheirodendron spp.) comprise the upper canopy, reaching 15 to 30 ft.<br />
in height. According to McEldowney (1983), this upper canopy is usually “accompanied by<br />
native subcanopy trees (3 to 6 m tall), native shrubs (1 to 3 m tall), a herbaceous layer<br />
composed of saplings, native and introduced herbs, grasses, sedges, rushes, and ferns (
McEldowney (1983) describes the eight major <strong>plan</strong>t communities that currently dominate the<br />
unforested sections of the region (Figure 11), most of them open grass or grass and shrub<br />
communities used for cattle grazing.<br />
Zones I through III occur below the 1,500-ft. elevation. This landscape is dominated by grasses<br />
(primarily introduced buffel grass (Cenchrus ciliaris), fountain grass (Pennisetum setaceum), and<br />
native pili grass (Heteropogon contortus)) and thickets of kiawe trees (Prosopis pallida). There<br />
is also a significant proportion of bare land. This area is generally used as open range, its use<br />
dependent entirely on forage growth following seasonal or episodic rainfall. It is extremely<br />
susceptible to wildfires, which burn through this area with increasing frequency. The primary<br />
grass species are all well-adapted to fire.<br />
The kiawe tree (Prosopis pallida) is an introduced species. It can desiccate an area, using all<br />
available water by tapping groundwater with its deep root system. This species is generally<br />
killed by intense fires, although a small proportion of the trees will survive if the bases are<br />
partially protected.<br />
Zones IV through VI fall between 1,500 and 3,600-ft. in elevation. According to McEldowney<br />
(1983), these intermediate vegetation types are “basically unimproved pastures receiving little<br />
or no <strong>management</strong>” (p. 410). These zones comprise mixed grass and shrub communities<br />
containing naturalized introduced species – buffel grass (Cenchrus ciliaris), fountain grass<br />
(Pennisetum setaceum), guinea grass (Panicum maximum), Bermuda grass (Cynodon dactylon),<br />
and Natal redtop grass (Melinis repens) – and some scattered native shrubs (e.g., ‘ilima (Sida<br />
sp.), ‘ākia (Wikstroemia pulcherrima)). “The higher percentage of bare ground is ephemerally<br />
covered by numerous annual herbs following both seasonal and intermittent concentrations of<br />
rainfall” (McEldowney 1983, p. 410).<br />
Fountain grass is beginning to dominate the intermediate corridor. “Usually avoided by cattle<br />
[and even feral goats], this stiff-bladed bunch grass increases in dominance following periodic<br />
fires” (McEldowney 1983, p. 409). It has the ability to form monotypic stands which increase<br />
the fire fuel load of dry lowland regions and, when dry, are highly flammable. The <strong>plan</strong>t is<br />
extremely fire-resilient, benefiting from fire at the expense of more palatable, non-fire-hardy<br />
grasses. DLNR has designated fountain grass as one of Hawai‘i's most invasive horticultural<br />
<strong>plan</strong>ts, and Hawai‘i Department of Agriculture has designated it a noxious weed.<br />
Zones VII and VIII are wetter zones above the 3,600-ft. elevation, dominated by kikuyu grass<br />
(Pennisetum clandestinum). Kikuyu grows as a dense mat; therefore, it provides better<br />
protection against soil erosion. There are scattered pockets of native tree species, primarily in<br />
inaccessible gulch areas. Because this part of the <strong>watershed</strong> normally receives greater amounts<br />
of annual rainfall, it is less susceptible to fire. These zones are best suited for grazing and have<br />
been subjected to agricultural <strong>management</strong> practices.<br />
35<br />
Wai‘ula‘ula Watershed Management Plan MK<strong>SWCD</strong>
Zones VII – VIII: grassland<br />
(kikuyu), with shrubs, herbs,<br />
and <strong>plan</strong>ted trees<br />
Zones IV – VI: mixed shrub<br />
and grassland; fountain grass<br />
Zones I – III: grassland<br />
(buffel) interspersed with<br />
kiawe<br />
Figure 11: Zones of Major Communities of Present Vegetation (McEldowney 1983)<br />
36<br />
Wai‘ula‘ula Watershed Management Plan MK<strong>SWCD</strong>
Fireweed (or Madagascar ragwort, Senecio madagascariensis) was discovered in the early<br />
1980s in pastures on Kohala Mountain. It invades pastures, disturbed areas, and roadsides, and<br />
is toxic to livestock when eaten. It is commonly found in the pastures in the upper portion of<br />
the Wai‘ula‘ula <strong>watershed</strong>. It is spread by wind, shoes, vehicles and animals. It is considered<br />
very invasive and is on the Hawai‘i State Noxious Weed List.<br />
Along the fringe of many of the <strong>watershed</strong>’s streams, there is greater occurrence of vegetation,<br />
supported by the relatively steady source of water. In the upper elevations of pasture land<br />
(above 3,600-ft. elevation), this riparian vegetation comprises a greater proportion of native<br />
species, mostly due to its inaccessibility to grazing because of its location in gulches. In some<br />
locations in the central elevations, the vegetation often grows within the stream channel itself<br />
(comprising mostly of Christmas berry (Schinus terebinthifolius) and other non-natives), making<br />
access to the stream difficult and causing debris to get caught on the vegetation during storm<br />
events, increasing the potential for flooding. Kiawe trees fringe some reaches of the stream in<br />
the lower elevations.<br />
Char (2002) noted <strong>plan</strong>ts that prefer a wetter habitat in shallow water and small mudflats in the<br />
riparian zone of the DHHL’s proposed Lālāmilo Residential Homestead Lots (about 2,500-ft.<br />
elevation). “These include several members of the sedge family (Cyperaceae) such as ‘aka‘akai<br />
or great bulrush (Schoenoplectus lacustris), kyllinga (Kyllinga brevifolia) Caarex longii,<br />
Fimbristylis dichotoma, and Cyperus haspan; also found here are scattered clumps of bog rush<br />
(Juncus ensifolius). Other <strong>plan</strong>ts found along the water’s edge include honohono (Commelina<br />
diffusa), marsh purslane (Ludwigia palustris), knotweed (Persicaria glabra), elephant grass<br />
(Pennisetum purpureum), and jungle rice (Echinochloa colona). All nine fern species found<br />
during this study are associated with moist shaded stream banks” (p. 6). Similar <strong>plan</strong>ts are<br />
likely found in areas of standing water and mud in other parts of the <strong>watershed</strong>, though a<br />
comprehensive assessment of riparian vegetation has not been undertaken for the <strong>watershed</strong>.<br />
Obviously, it is difficult to know exactly how human pressures altered the distribution and<br />
composition of the native <strong>plan</strong>t communities. But, generally, historical accounts document a<br />
series of human impacts on the environment of the <strong>watershed</strong>. The early Hawaiians altered the<br />
lands by developing large, irrigated agricultural systems. The sandalwood (Santalum<br />
paniculatum or ‘iliahi) trade of the early 19 th century drastically altered the landscape as the<br />
slopes were denuded of sandalwood trees. With the arrival of European settlers and whaling<br />
ships, the cattle industry was born, and cattle grazed down shrub and tree species, and the land<br />
was fenced for livestock. Trees were also harvested for firewood.<br />
Fire has been a major threat to maintaining a healthy ecosystem in the <strong>watershed</strong>, and the<br />
changing composition of vegetation in the <strong>watershed</strong> has contributed to an increased fire<br />
hazard. Fire contributes to the erosion problem by stripping the land of vegetation. Without<br />
vegetation to hold the soil in place, it is subject to both wind and water erosion. Fire also can<br />
render to soil hydrophobic, which increases water repellency, surface runoff, and erosion.<br />
37<br />
Wai‘ula‘ula Watershed Management Plan MK<strong>SWCD</strong>
2.1.10 Native Wildlife<br />
The Wai‘ula‘ula <strong>watershed</strong> is home to a number of native wildlife, occupying aerial, terrestrial,<br />
and aquatic environments. These species play a vital role in the ecological processes within the<br />
<strong>watershed</strong>, as well as hold cultural significance to the Hawaiian people.<br />
Of the avian species, the <strong>watershed</strong> houses a handful of native birds. A wildlife survey done as<br />
part of the Environmental Impact Statement (EIS) for DHHL's Lālāmilo Residential Project (DHHL<br />
2002) revealed nine species of birds. Of the nine, only one species, the Pacific Golden Plover or<br />
kōlea (Pluvialis fulva), was native. P. fulva is migratory and makes its home in Hawai‘i during<br />
the months of August to April, where they feed on insects. Although not observed in this<br />
survey, it is expected that the native Short-Eared Owl or Pueo (Anas wyvilliana) resides in the<br />
region. The pueo is widespread on Hawai‘i Island and often hunts during the day in pastures on<br />
the leeward side of the island.<br />
Beyond the mid-regions of the <strong>watershed</strong>, which the Lālāmilo survey covered, lay the upper<br />
reaches of the <strong>watershed</strong> atop Kohala Mountain. While no formal surveys have been made<br />
specifically within the Wai‘ula‘ula <strong>watershed</strong>, mountain-wide surveys have encountered many<br />
other native avian species that could potentially reside within the upper <strong>watershed</strong>. The<br />
endangered and endemic Hawaiian Goose Nēnē (Branta sandvicensis) has been spotted on<br />
Kohala mountain. Other native avian species that have been known to reside on Kohala<br />
Mountain are the forest birds ‘elepaio (Chasiempis sandwichensis), ‘amakihi (Hemignathus<br />
virens), ‘apapane (Himatione sanguinea), and ‘i‘iwi (Vestiaria coccinea). These birds inhabit the<br />
closed canopy ‘ohi‘a and ‘ōlapa forests on top of Kohala Mountain above an elevation of 4,000<br />
feet, where they are free of diseases transmitted by mosquitoes (KWP 2007). Also established<br />
on Kohala mountain is the endangered Hawaiian duck (Anas wyvilliana) (USFWS 1999). The<br />
endangered Hawaiian Hawk or ‘io (Buteo solitarious) can also be found nesting in ‘ohi‘a forests.<br />
All these birds perform a number of important roles within the ecosystem, such as seed<br />
dispersal and pollination of native <strong>plan</strong>ts by the nectarivorous ‘amakihi, ‘apapane, and ‘i‘iwi,<br />
pest control of insects by the insectivorous kōlea and ‘elepaio, and rodent control by the pueo<br />
and ‘io.<br />
The Hawaiian hoary bat or ‘ōpe‘ape‘a (Lasiurus cinereus semotus) is the only native land<br />
mammal of the Hawaiian Islands. This endemic species is federally-protected under the<br />
endangered species list. The insectivorous bats have been spotted near Kawaihae and<br />
Honoka‘a, with some reported sightings in Waimea.<br />
Aquatic species play extremely important ecological roles within the <strong>watershed</strong>. Their presence<br />
or absence is often used as an indicator of stream and <strong>watershed</strong> health. In the Wai‘ula‘ula<br />
<strong>watershed</strong>, surveys of Waikoloa and <strong>Kea</strong>nu‘i‘omanō streams conducted in 1992 by DLNR's<br />
Division of Aquatic Resources (DAR), in 2002 by Bishop Museum's Hawai‘i Biological Survey<br />
(HBS), and in 2010 by R.A. Englund revealed a wide array of native endemic and indigenous<br />
aquatic fish and macro-invertebrates.<br />
38<br />
Wai‘ula‘ula Watershed Management Plan MK<strong>SWCD</strong>
Englund (2010) observed 4 of the 5 native stream fish species in various locations throughout<br />
the <strong>watershed</strong>. Lentipes concolor (‘o‘opu alamo‘o) was detected in <strong>Kea</strong>nu‘i‘omanō Stream at<br />
the 2,700-ft. elevation. Englund notes that “[t]his indicates that native fish traverse long<br />
stretches of intermittent stream channels during periods of flowing water, using the ephemeral<br />
stream habitat as an access corridor to the headwater regions of upper <strong>Kea</strong>nu‘i‘omanō Stream”<br />
(p. 11). Awaous guamensis (‘o‘opu nākea) was also common in the lower Wai‘ula‘ula Stream.<br />
Eleotris sandwicensis (‘o‘opu ‘akupa) and Stenogobius Hawaiiensis (‘o‘opu naniha) were found<br />
in the Wai‘ula‘ula estuary. While Sicyopterus stimpsoni (‘o‘opu nōpili) was not found during<br />
Englund’s recent survey, it was observed in previous studies (1992 DAR survey). None of the<br />
native fish species have been Federally-listed, though the ‘o‘opu alamo‘o is considered a<br />
potential candidate (Loope 1998).<br />
The ‘o‘opu have amphidromous life cycles in which adults reside in freshwater pools, migrate<br />
utilizing the intermittent stream flows, and mate in the headwaters. Eggs are deposited on<br />
rocks, hatch into larvae, and the larvae travel down the stream to the sea. Post-larval ‘o‘opu<br />
migrate back up a stream in response to freshets, restarting the lifecycle. In addition to the<br />
cultural significance of the once-plentiful ‘o‘opu as a traditional food source, the ‘o‘opu are<br />
important members of the trophic community. The indigenous ‘o‘opu nākea is omnivorous and<br />
feeds on filamentous algae as well as invertebrate species. And, the endemic ‘o‘opu alamo‘o<br />
and nōpili feed primarily on algae on the surface of rocks. These fish help control the<br />
overabundance of algae and invertebrate species.<br />
“Englund et al. (2007) found that endemic Hawaiian aquatic insects are better bio-indicators for<br />
Hawaiian stream health as compared to the native stream macrofauna (fish, crustaceans,<br />
mollusks) because aquatic insects have more specific stream habitat requirements” (Englund<br />
2010, p. 11). DLNR’s Division of Aquatic Resources (DAR) conducts periodic surveys of the biota<br />
in Hawai‘i’s streams. Its Freshwater Database contains survey data from the State’s perennial<br />
and intermittent streams, compiled from a variety of sources. The database identifies native<br />
and exotic species of fish, crustaceans, mollusks, insects, and algae, and notes the elevation at<br />
which the data were collected. The data date back to the 1960s. Data for the streams in the<br />
Wai‘ula‘ula <strong>watershed</strong> were collected in 1968, 1990, 1992, 1994, 1999-2001. This database<br />
identifies 15 total aquatic insect species that have found in the Wai‘ula‘ula <strong>watershed</strong> during all<br />
previous studies. Englund (2010) collected a total of 23 species of aquatic insects, of which 65%<br />
were native and 35% were introduced species. According to Englund (2010), “[t]he relatively<br />
high 65% overall native aquatic insect biodiversity found within the entire Wai‘ula‘ula<br />
<strong>watershed</strong> is comparable to other high quality streams” (p. 12). In the upper reaches of<br />
<strong>Kea</strong>nu‘i‘omanō, Waikoloa, and Kohākōhau streams, native species are even more dominant,<br />
maintaining an exceptionally high diversity “equaling any high quality stream found in the<br />
Hawaiian archipelago” (Englund 2010, p. 12).<br />
The aquatic insects surveyed have important trophic roles as collectors, grazers, and predators.<br />
Collector-gatherer invertebrate species are filter feeders that consume passing particulate<br />
organic matter, effectively absorbing nutrients in the water. Native collector species found in<br />
the HBS and DAR surveys include the endemic prawn ‘ōpae‘oeha‘a (Macrobrachium<br />
39<br />
Wai‘ula‘ula Watershed Management Plan MK<strong>SWCD</strong>
grandimanus) and the endemic true flies under the order Diptera, Forcipomyia hardyi,<br />
Chironomus sp, and Orthocladius grimshawi. Invertebrate grazers feed on benthic algae and<br />
are responsible for maintaining healthy levels of algae. Grazers identified in this survey include<br />
the endemic true flies of the Ephydridae family, Scatella bryani and Scatella clavipes. The<br />
survey also found many native predacious invertebrates that prevent the overabundance of<br />
other invertebrates in the ecosystem. These predatory organisms were primarily the<br />
dragonflies such as the endemic Pinao (Anax strenuous) and the indigenous Common Green<br />
Darner (Anax junius) and Wandering Glider (Pantala flavescens). More information about the<br />
stream surveys is contained in Section 3.10.<br />
2.1.11 Exotic and Invasive Species<br />
Alien and invasive species of <strong>plan</strong>ts and animals are tremendous problems in Hawai‘i, both from<br />
environmental and economic standpoints. Every year, new non-native species are introduced<br />
into the islands. The majority of the <strong>plan</strong>ts in the Wai‘ula‘ula <strong>watershed</strong> are considered exotic<br />
and/or invasive species. These are described above in Section 2.1.9.<br />
Much of the animal life in the <strong>watershed</strong> is also introduced. The problems caused by<br />
introduced species are well-documented: KWP (2007), SPREP (2000), Atkinson (1977), Giffen<br />
(1977), Smith (1985), DLNR (1989), Cuddihy and Stone (1990), Staples and Cowie (2001), and<br />
Stone (1985). Introduced cattle, goats, and pigs can be very destructive to their habitats. Feral<br />
pigs (Sus scrofa), found primarily in the upper reaches of the <strong>watershed</strong>, destroy areas of native<br />
forest, introduce weed species, and serve as vectors for disease. Feral goats (Capra hircus)<br />
browse on woody <strong>plan</strong>ts, herbs, and grasses, in both dry and wet ecosystems. They have<br />
proliferated in the lower <strong>watershed</strong>, damaging the environment through over-grazing.<br />
Improper <strong>management</strong> of domesticated cattle (Bos taurus) can also lead to over-grazing, while<br />
cattle accessing streams for water can have a negative effect on riparian vegetation and<br />
streambanks. Small mammals, such as rats (Rattus rattus and Rattus exulans), mice (Mus<br />
musculus) and mongoose (Herpestes javanicus), prey on native birds and feed on fruit, seeds,<br />
flowers, stems and roots of native <strong>plan</strong>ts. Introduced bird and insect species, of which there<br />
are many, compete with native ones for food sources and introduce new diseases.<br />
Numerous species of alien aquatic species are established in Hawai‘i’s streams. Some were<br />
introduced intentionally as food fish, ornamentals, or for mosquito and weed control. Others<br />
were dumped into streams with no thought about the consequences. Exotic fishes, mollusks,<br />
crustaceans, invertebrates, and amphibians can compete with the native stream fauna for food<br />
and habitat, introduce parasites, and feed on native species. Invasive aquatic species can also<br />
cause economic impacts to agricultural users of water, resulting in crop damage, infrastructure<br />
damage, or contamination. While DLNR aquatic surveys of Wai‘ula‘ula’s streams reveal the<br />
presence of a majority of Hawai‘i’s native aquatic species, they also indicate the existence of<br />
exotic species, particularly guppies, crayfish, Tahitian prawns, green swordtails, toads and frogs,<br />
and midges.<br />
40<br />
Wai‘ula‘ula Watershed Management Plan MK<strong>SWCD</strong>
Leptospirosis and Cryptosporidiosis are potentially fatal illnesses caused by water-borne microorganisms<br />
spread by pigs, dogs, mongooses, rats, and even frogs. A few people become ill each<br />
year from wading in ponds or drinking water from affected springs and streams. Leptospirosis<br />
is from a bacterium, transmitted from animals to humans where people contact the bacteria<br />
through water or mud that has been contaminated by animal urine or droppings.<br />
2.2 Socio-Cultural Resources<br />
2.2.1 Land Use Zones (State and County)<br />
2.2.1.1 State Land Use Districts<br />
The Hawai‘i Land Use Law, Chapter 205, Hawai‘i Revised Statutes (HRS), places all lands in the<br />
State into four districts: Urban, Agricultural, Rural and Conservation. Lands in the Conservation<br />
District are managed by the State, and the jurisdiction over Rural and Agricultural Districts is<br />
shared by the State Land Use Commission (LUC) and counties. The responsibility for zoning<br />
within the Urban District is delegated to the counties. Changes to the boundaries can be made<br />
by ordinance of the County Council for areas of 15 acres or less. Otherwise, the LUC must<br />
approve changes by a 6-3 vote. Only the LUC can take land out of the Conservation District.<br />
In the past, large-scale, urban-style developments have occurred in the Agricultural District,<br />
usually designed as a residential development and often surrounding a golf course. However,<br />
this use of agricultural lands has virtually halted as a result of the legal decision regarding the<br />
Hokulia development in South Kona. 4 As a result, landowners contemplating this type of<br />
development in the future will likely request LUC approval for a district boundary amendment<br />
to reclassify lands from Agricultural to Rural.<br />
In the Wai‘ula‘ula <strong>watershed</strong>, 69.4% of the lands are designated Agriculture, 21.2%<br />
Conservation, 0.5% Rural (small farms and low-density residential lots), and 8.9% Urban (Figure<br />
12).<br />
2.2.1.2 Conservation District<br />
Lands in the Conservation District are managed by the Department of Land and Natural<br />
Resources (DLNR) pursuant to Chapter 183C, HRS, and Chapter 13-5, Hawai‘i Administrative<br />
Rules (HAR). Generally, land use is regulated in the conservation district for the purpose of<br />
conserving, protecting, and preserving the important natural resources of the State through<br />
appropriate <strong>management</strong> and use to promote their long-term sustainability and public health,<br />
safety, and welfare. Lands within the Conservation District are further subdivided into<br />
4 Circuit Court Judge Ibarra ruled in 2003 that Hokulia was an urban project being built illegally on agriculturallydesignated<br />
lands. He based this conclusion on his findings that the State Land Use Law (Chapter 205, HRS)<br />
requires that housing on agricultural lands be related to agricultural use and such agriculture must be<br />
economically viable.<br />
41<br />
Wai‘ula‘ula Watershed Management Plan MK<strong>SWCD</strong>
Figure 12: State Land Use Districts<br />
subzones for which Chapter 13-5, HAR, defines specific objectives and types of activities<br />
allowed. The conservation lands within the Wai‘ula‘ula <strong>watershed</strong> fall within the Protective<br />
Subzone, which has the following objective: protect valuable resources in designated areas such<br />
as restricted <strong>watershed</strong>s, marine, <strong>plan</strong>t, and wildlife sanctuaries, significant historic,<br />
archaeological, geological, and volcanological features and sites, and other designated unique<br />
areas (§13-5-11). Prior to any use of land in the Conservation District, a Conservation District<br />
Use Application (CDUA) must be submitted to and approved by the Board of Land and Natural<br />
Resources.<br />
The southeastern portion of the conservation lands within the Wai‘ula‘ula <strong>watershed</strong> is<br />
designated as part of the Kohala Watershed Forest Reserve. DLNR’s Division of Forestry and<br />
Wildlife (DOFAW) regulates activities in the forest reserves under Chapter 13-104, Hawai‘i<br />
Administrative Rules (HAR). These rules prohibit taking of any <strong>plan</strong>t or animal life, except by<br />
permit; disturbing of any natural or historic feature; introduction of <strong>plan</strong>ts and animals;<br />
dumping and littering; and fires. The rules also disallow driving motorized vehicles in any area<br />
or trail not designated for that purpose, and prohibit unlicensed vehicles. Camping is allowed in<br />
designated areas (of which there are none in the Wai‘ula‘ula <strong>watershed</strong>) or sites with a permit<br />
42<br />
Wai‘ula‘ula Watershed Management Plan MK<strong>SWCD</strong>
from DLNR. Hunting is allowed only as provided for in Chapters 122 (Game bird hunting) and<br />
123 (Game mammal hunting), HAR.<br />
DLNR-DOFAW also regulates activities within restricted <strong>watershed</strong>s, including the Kohala<br />
Restricted Watershed, under Chapter 13-105, HAR. The rules provide for scientific research;<br />
hunting, as permitted by hunting rules; hiking and other recreational pursuits; and collecting of<br />
fruits, greenery and other <strong>plan</strong>t parts for personal use with a permit for DLNR. These activities<br />
are regulated by Chapter 13-104, HAR, rules regulating activities within forest reserves.<br />
The remaining conservation lands within the Wai‘ula‘ula <strong>watershed</strong> are part of the Pu‘u o ‘Umi<br />
Natural Area Reserve (NAR). Under Chapter 13-209, HAR, DLNR is responsible for the<br />
<strong>management</strong> of the State’s NARs to ensure preservation of specific land and water areas which<br />
support communities of natural flora and fauna, including wetland areas. The rules and<br />
prohibitions are similar to those within forest reserves, with a few exceptions. Camping is<br />
prohibited in the NARs, and any hiking groups larger than ten individuals are required to have a<br />
special use permit from DLNR.<br />
2.2.1.3 Agricultural and Rural Lands<br />
Chapter 205, HRS, delegates the responsibility for zoning within the agricultural and rural<br />
districts to the counties. For agricultural lands, however, Chapter 205, HRS, outlines permitted<br />
uses of the lands classified as “A” or “B” by the Land Study Bureau's land productivity rating<br />
system.<br />
5 In Hawai‘i County, Chapter 25, Hawai‘i County Code (HCC), regulates zoning and<br />
identifies permitted uses and other regulations. Under this ordinance, the State Agricultural<br />
District is further subdivided into subzones (agriculture, family agriculture, intensive agriculture,<br />
etc.), which the County also refers to as “districts.”<br />
Chapter 205, HRS, states that only the following uses shall be permitted within Rural Districts:<br />
low density residential uses (minimum lot size is one-half acre); agricultural uses; golf courses,<br />
golf driving ranges and golf-related facilities; and public, quasi-public, and public utility facilities.<br />
Chapter 205, HRS, also requires that State and county agricultural policies, tax policies, land use<br />
<strong>plan</strong>s, ordinances and rules promote the long-term viability of agricultural use of important<br />
agricultural lands. One criterion for designating land as important agricultural lands is lands<br />
identified under agricultural productivity rating systems, such as ALISH.<br />
5 The University of Hawai‘i’s Land Study Bureau (LSB) prepared an inventory and evaluation of the State’s land<br />
resources during the 1960s and 1970s. The LSB rated lands, except those in the urban district, in terms of<br />
agricultural productivity based on soil properties and productive capabilities (texture, structure, depth, drainage,<br />
parent material, stoniness, topography, climate, and rain). A five-class productivity rating system was developed<br />
using the letters A, B, C, D, and E, with “A” representing the class of highest productivity and “E” the lowest. There<br />
are no class A lands on the island of Hawai‘i.<br />
43<br />
Wai‘ula‘ula Watershed Management Plan MK<strong>SWCD</strong>
Agricultural Lands of Importance to the State of Hawai‘i (ALISH): As part of a national<br />
effort to inventory important farmlands, the Hawai‘i Department of Agriculture assessed lands<br />
through a rating system for agricultural suitability to produce the Agricultural Lands of<br />
Importance to the State of Hawai‘i (ALISH). This was adopted by the Board of Agriculture in<br />
1977. Three classes of important agricultural lands were identified: (1) Prime – soils with best<br />
physical, chemical and climatic properties for mechanized field crops; (2) Unique – lands other<br />
than prime for unique high-value crops (coffee, taro, watercress, etc.); and (3) Other – lands<br />
needing irrigation or possessing characteristics like seasonal wetness, or erodibility that require<br />
further <strong>management</strong> for commercial production. Areas of Prime agricultural lands in the<br />
Wai‘ula‘ula <strong>watershed</strong> include the Lālāmilo farm lots and a band of grazing land mauka of<br />
Kohala Mountain road (Figure 13).<br />
Figure 13: ALISH Agricultural Suitability<br />
General Plan Important Agricultural Lands: Chapter 205, HRS, also mandates counties to<br />
identify and map potential important agricultural lands within their jurisdictions. One of the<br />
goals of Hawai‘i County's General Plan (2005) is to identify, protect and maintain important<br />
44<br />
Wai‘ula‘ula Watershed Management Plan MK<strong>SWCD</strong>
agricultural lands on the island of Hawai‘i. The general <strong>plan</strong> defines “important agricultural<br />
lands” as “those with better potential for sustained high agricultural yields because of soil type,<br />
climate, topography, or other factors” (Hawai‘i County 2005; p. 14-8). In making these<br />
determinations, the county included, among other things, data from the 1989 General Plan<br />
Land Use Pattern Allocation Guide (LUPAG) maps, the ALISH classification system, and the Land<br />
Study Bureau’s (LSB) Soil Survey Report. General Plan Important Agricultural Lands included in<br />
the Wai‘ula‘ula <strong>watershed</strong> are the Lālāmilo farm lots and some grazing lands mauka and makai<br />
of Kohala Mountain Rd (see Figure 16).<br />
2.2.1.4 Urban District<br />
The urban district is entirely under county jurisdiction, and uses are controlled only by county<br />
zoning. All areas on the island, except for federal lands like the national parks and some areas<br />
in the conservation district, are zoned (Figures 14 and 15). The Zoning Code, Chapter 25, HCC,<br />
lists the permitted uses within each zone, and also the required setbacks, height limits, parking<br />
areas for commercial developments, and other controls. Within the Wai‘ula‘ula <strong>watershed</strong>, 4%<br />
of the land is zoned residential, 0.7% commercial, 1.2% roads, and 1.2% open, while the<br />
remaining lands parallel State designations with 71.5% zoned agricultural and 21.2% forest<br />
reserve (conservation).<br />
Figure 14: County Zoning - Lower Watershed<br />
45<br />
Wai‘ula‘ula Watershed Management Plan MK<strong>SWCD</strong>
Figure 15: County Zoning - Upper Watershed<br />
While, currently, there is little urban or suburban development within the <strong>watershed</strong>, the<br />
County’s LUPAG map (see Figure 16) shows substantial areas designated for urban and<br />
suburban expansion. These areas will likely require a change in land use district classification,<br />
shifting <strong>management</strong> jurisdiction for these lands completely to the County.<br />
2.2.1.5 Hawai‘i County General Plan<br />
Generally, all development within the County must conform to the policies outlined in its<br />
General Plan (Hawai‘i County 2005) and specific community development <strong>plan</strong>s. The county<br />
general <strong>plan</strong> provides a coordinated set of guidelines for decision-making regarding future<br />
growth and development and protection of natural and cultural resources. The general <strong>plan</strong><br />
also guides revisions and updates to the county code. The <strong>plan</strong> is given the effect of law<br />
through adoption by the County Council. Generally, the general <strong>plan</strong> has policies related to<br />
protecting the county’s natural resources and minimizing adverse effects resulting from the<br />
inappropriate location, use, or design of sites and structures; protecting wetlands and riparian<br />
areas; and designing drainage systems to minimize polluted runoff, retain streambank<br />
vegetation, and maintain habitat and aesthetic values.<br />
46<br />
Wai‘ula‘ula Watershed Management Plan MK<strong>SWCD</strong>
The General Plan provides the direction for the future growth of the County. As a policy<br />
document, it provides the legal basis for all subdivision, zoning, and related ordinances and will<br />
guide revisions to the county code. The General Plan also includes Land Use Pattern Allocation<br />
Guide (LUPAG) maps by district that show conservation, agricultural, rural, resort and urban<br />
areas, urban expansion areas, and open areas (Figure 16). These serve to guide the location,<br />
type, and intensity of different land uses. The LUPAG identifies significant areas of urban<br />
expansion within the Wai‘ula‘ula <strong>watershed</strong>, particularly in the lower <strong>watershed</strong> and within<br />
Waimea.<br />
The County general <strong>plan</strong> is implemented through the specific community development <strong>plan</strong>s;<br />
budgeting and capital improvement programs guided by the goals, objectives and policies of<br />
the general <strong>plan</strong> and community development <strong>plan</strong>s; county laws amended to be consistent<br />
with the intent of the general <strong>plan</strong> components; and approval or disapproval of developments<br />
seeking zoning and other development approvals based on how they support the visions<br />
expressed in the general <strong>plan</strong>. The county <strong>plan</strong>ning department prepares an annual report to<br />
monitor progress towards achieving general <strong>plan</strong> goals, objectives and policies. The annual<br />
report is submitted to the Mayor and County Council for review. The General <strong>plan</strong> is subject to<br />
periodic review and amendment, as specified by county procedures, with significant<br />
opportunities for input by the public.<br />
The 2005 General Plan calls for the development of community development <strong>plan</strong>s, which are<br />
to be adopted by the County Council. The South Kohala Community Development Plan (CDP)<br />
was developed with significant community input and adopted by the Council on November 20,<br />
2008. It provides a long-term <strong>plan</strong> with a <strong>plan</strong>ning horizon to year 2020, consistent with the<br />
General Plan. The South Kohala CDP identifies District-wide policies that address the following<br />
priority land use issues: preserve culture/sense of place; traffic and transportation; affordable<br />
housing; emergency preparedness; and environmental stewardship and sustainability. It<br />
specifically identifies a sub-policy for the District that directs the County to develop or<br />
collaborate with other agencies and organizations to develop <strong>watershed</strong> <strong>management</strong><br />
programs for the district, as well as water quality monitoring (Hawai‘i County 2008; p. 52).<br />
The South Kohala CDP includes a Waimea Town Plan, providing general guidelines for the longrange<br />
future of Waimea Town. Among the recommendations that are relevant to the<br />
Wai‘ula‘ula <strong>watershed</strong> <strong>management</strong> <strong>plan</strong> are the following:<br />
47<br />
Strategy 1.1 Protect the pu‘u of Waimea.<br />
Strategy 1.5 Expand the Lālāmilo Farm lots.<br />
Strategy 2.1 The County should carefully evaluate and condition, as appropriate, any<br />
rezoning that would negatively impact important agricultural lands or<br />
culturally, visually and environmentally important open space or resources<br />
in Waimea.<br />
Strategy 2.2 Work with Parker Ranch to phase the “Parker 2020” Development.<br />
Strategy 2.3 Revise the County subdivision regulations and Planning Department<br />
policies and enforcement procedures to ensure that agricultural<br />
Wai‘ula‘ula Watershed Management Plan MK<strong>SWCD</strong>
subdivisions are created for agricultural purposes and are not used for<br />
rural residential purposes without rezoning.<br />
Strategy 2.4 Amend the County of Hawai‘i's General Plan “LUPAG” map by reducing<br />
the acreage of “Low Density Urban” land in Waimea Town.<br />
Strategy 3.1 Protect Important Agricultural Lands.<br />
Strategy 5.7 Design and construct the Lālāmilo connector road.<br />
Strategy 5.8 Work with the State Department of Transportation to resolve the best<br />
alignment for the proposed Waimea/Kawaihae Road bypass highway.<br />
Figure 16: County LUPAG Map<br />
bw (breakwater) mdu Medium Density Urban<br />
con Conservation ope Open Area<br />
ea Extensive Agriculture pon (ponds)<br />
hdu High Density Urban ren Resort Node<br />
ial Important Ag. Lands rur Rural<br />
ind Industrial ue Urban Expansion<br />
ldu<br />
Low Density Urban<br />
48<br />
Wai‘ula‘ula Watershed Management Plan MK<strong>SWCD</strong>
2.2.2 Land Cover<br />
Land cover is based on NOAA's Coastal Change Analysis Program (C-CAP) land cover classes<br />
(Figure 17). The majority of the <strong>watershed</strong> (58%) is in grassland, dominated by grammanoid or<br />
herbaceous vegetation and not subject to intensive <strong>management</strong> such as tilling. Evergreen<br />
forest, with trees generally greater than 5 meters tall and greater than 20% of total vegetation,<br />
accounts for 26% of the land cover. This land cover type is primarily found within the protected<br />
Conservation District. Of the remaining land cover, scrub/shrub and low-intensity developed<br />
each account for 5%, bare land 4%, and cultivated land and high intensity developed each 1%.<br />
Figure 17: C-CAP Land Cover<br />
2.2.3 Population and Local Communities (Demographics)<br />
Waimea is the main population center within the Wai‘ula‘ula <strong>watershed</strong>. Waimea is a rural<br />
community that developed around the historic Parker Ranch. Residential subdivisions extend<br />
down Kawaihae Road, located primarily between Kawaihae Road and <strong>Kea</strong>nu‘i‘omanō stream to<br />
the south. <strong>Mauna</strong> <strong>Kea</strong> Beach Resort is a destination resort located near the mouth of the<br />
<strong>watershed</strong>, with a large-scale, high end hotel, restaurants, golf courses, and residential<br />
49<br />
Wai‘ula‘ula Watershed Management Plan MK<strong>SWCD</strong>
developments. Most of the commercial development in the <strong>watershed</strong> is concentrated in and<br />
around Waimea town center.<br />
The South Kohala District, in which the Wai‘ula‘ula <strong>watershed</strong> is located, was the fastest<br />
growing district on Hawai‘i Island from 1980 to 1990 and the second fastest growing district<br />
from 1990 to 2000 (Hawai‘i County 2008). While census data does not provide population<br />
information on a <strong>watershed</strong> basis, it is estimated that Waimea's population in 2000 was over<br />
7,000 people. The South Kohala Community Development Plan estimates (based on building<br />
permits issued) that, since 2000, the population of Waimea alone could have increased by<br />
about 1,500 people (Hawai‘i County 2008). There are currently around 2,900 housing units in<br />
Waimea. This does not include additional units along Kawaihae Road and at the <strong>Mauna</strong> <strong>Kea</strong><br />
Beach Resort.<br />
Many people are employed by the tourism sector. Agricultural operations, both truck crop<br />
farms and cattle ranching also employ people within the <strong>watershed</strong>. Waimea is the home to<br />
the headquarters of Canada-France-Hawai‘i Telescope and W.M. Keck Observatory, numerous<br />
public and private schools (Waimea Elementary School, Waimea Middle Public Conversion<br />
Charter School, Kanu o Ka ‘Āina Public Charter School, Hawai‘i Preparatory Academy, and<br />
Parker School), and the North Hawai‘i Community Hospital. Waimea's per capita income is<br />
$20,773, based on 2000 census data. Median income is $51,150 for households, $55,822 for<br />
families, and $29,750 for non-family households.<br />
2.2.4 Land Uses – Historic and Current<br />
In the Cultural Impact Assessment for the DHHL Lālāmilo Residential Development Project,<br />
authors McGuire and Haun (2002) describe historic land uses in the area: “From ancient times,<br />
Waimea has been associated with royalty and chiefly lineages. Waimea was one of the lands<br />
which was highly valued by the ali‘i (chiefs) and traditional stories indicate they maintained a<br />
dominant presence there” (p. 6). Waimea was also a training ground for young chiefly warriors.<br />
McGuire and Haun (2002, p. 8) describe the story of Kekuhaopio, a trainer during the time of<br />
Kamehameha, which lists many famous battles either fought in Waimea or fought by Waimea<br />
warriors, including a battle between Kamalalawalu of Maui and Lonoikamahakihi from Hawai‘i<br />
in the late 16 th to early 17 th century that took place in the Waimea area: the battle of<br />
Pu‘oa‘oaka (Pu‘u‘owā‘owaka Hil). McGuire and Haun also report that a battle occurred at<br />
Hōkū‘ula.<br />
With so many chiefs and warriors coming from Waimea and being trained in Waimea, an<br />
extensive agricultural field system was developed that is still evident today. Clark (1981) notes<br />
that this Waimea agricultural system can be subdivided into four field complexes, three of<br />
which are contained within the current day Wai‘ula‘ula <strong>watershed</strong>:<br />
Field Complex 1 is located on the Kohala slopes, principally between Lanikepu and Hale‘aha<br />
Gulches on the west and east, respectively. It lies south of Pu‘ula‘ela‘e, and north of<br />
<strong>Kea</strong>nu‘i‘omanō and Kohākōhau Streams, once they run off the slope and turn to an east-west<br />
50<br />
Wai‘ula‘ula Watershed Management Plan MK<strong>SWCD</strong>
51<br />
flow direction. This area is one of comparatively steep slope, and is characterized by a series of<br />
terraces and/or terraced field ridges. These features range from 0.5 to 1.5 m. in height and<br />
appear to be primarily soil with little or no stone in the retaining faces. The upper portion of the<br />
complex is dominated by mildly terraced field ridges, usually comparatively low. These seem<br />
most likely to be more of a linchet-type development than intentionally constructed ridges. The<br />
lower portion of the complex is characterized by the presence of larger terraces with broader<br />
and noticeably flatter surfaces behind the soil embankments. The method of construction of<br />
these latter features is probably cut-and-fill.<br />
In association with the agricultural fields are a series of water flow channels and at least one set<br />
of ‘auwai. The water flow channels are found over the entire complex, running down the slope.<br />
With one possible exception, they do not appear to divert from a stream flow but, rather, simply<br />
begin as small depressions at the upper margins of the fields. The angle of slope would<br />
necessitate a very rapid flow, and some of the channels are in comparatively low-lying areas;<br />
both conditions would make diversions into fields somewhat difficult. Consequently, it seems<br />
most likely that these channels served more a drainage function, diverting water off of rather<br />
than onto the fields. Also present, however, is a clearly identifiable ‘auwai set, the main channel<br />
of which is diverted from the Kohākōhau Stream at approximately 3,000 ft elevation, that feeds<br />
a series of fields in the Waiaula land division before emptying into the Hale‘aha Gulch. A historic<br />
period irrigation ditch (with a diversion wall of concrete and boulders) is taken off of the east<br />
side of the Kohākōhau Stream, but its route was not determined.<br />
A few fields may be present immediately east of Kohākōhau Stream Gulch, but there are no<br />
signs of agricultural activity much beyond it. On the other side, an occasional low terrace,<br />
residential structure, or wall can be found beyond the first few hundred meters west of<br />
Lanikepu Gulch, but for the most part the field complex proper ends at that point….<br />
Field Complex 2 is situated between <strong>Kea</strong>nu‘i‘omanō and Kohākōhau Streams on the north, and<br />
Waikoloa Stream on the south. It is characterized by a set of agricultural fields demarcated by<br />
terrace retaining faces, or low ridges of soil and/or stone. The fields average ca. 25 m in width<br />
with the long axis oriented northwest by southeast, or perpendicular to the prevailing winds.<br />
Associated with the fields is a set of ‘auwai, which diverge from the Kohākōhau Stream and<br />
angle to the southeast across the complex, draining into the Waikoloa Stream….<br />
Field Complex 3 lies south of Waikoloa Stream and north of Pu‘u Pā. The existing Lālāmilo Farm<br />
Lots have destroyed much of the eastern end of this complex. The precise western extent has<br />
not yet been determined but it appears to incorporate most, if not all, of the Lālāmilo Kuleana<br />
and Ranch District…. (Clark 1981: 17-19)<br />
The upper Lālāmilo fields of the Waimea agricultural complex differ from the Kohala field<br />
system “due to the fact that they received supplemental water by means of an extensive and<br />
complex irrigation system. Indeed, it is this difference that makes the Waimea agricultural<br />
system unique” (Clark 1981: 50).<br />
In 1793, Captain George Vancouver brought Longhorn cattle along with some sheep, and gave<br />
them to King Kamehameha as a gift. Kamehameha put a ten-year kapu on the cattle,<br />
prohibiting anyone from touching or hunting them. From these cattle, large herds eventually<br />
Wai‘ula‘ula Watershed Management Plan MK<strong>SWCD</strong>
multiplied, causing significant damage to the forest on Kohala Mountain. McGuire and Haun<br />
(2002) suggest that along with cattle, “other early western visitors introduced goats, horses, a<br />
new pig breed, and new vegetable, fruit and <strong>plan</strong>t varieties. Kawaihae and its port became the<br />
impetus for the development of trade and commerce. Waimea provided much of the produce,<br />
and later on salted beef, to refurbish supplies for foreign ships” (p.18). To harvest the cattle,<br />
which all belonged to the Crown, the King hired bullock hunters, like John Palmer Parker. The<br />
meat would be salted and brought to Kawaihae. Hides were tanned and tallow was produced<br />
from the cattle. All these products were sold to the ships that resupplied in Kawaihae. In 1832,<br />
Spanish-Mexican vaquero were brought from California to teach Hawaiians how to manage the<br />
wild cattle (Bergin 2004).<br />
Waimea had a reputation for producing fine and durable leather. However, the enterprise of<br />
tanning the hides had a noticeable effect on the forest of the area. Haun and McGuire (2002)<br />
write:<br />
52<br />
ecologically, the tanning business had a negative impact to the landscape. The bark from native<br />
trees was used to tan hides. Lyons reports that the “Konohikis demanded high prices for bark<br />
gathering permits; and koa and ‘ohi‘a were used more than scarcer trees that made handsomer<br />
leather...” Kukui was richest in tannin” (Doyle 1945: 50). Lyons’ comment implies there had<br />
already been loss of the native forest besides sandalwood. The tanneries no doubt contributed<br />
to more loss of the native forest. There were several tanneries in operation during the 1840s<br />
and 1850s. One tan works was “under the direction of Chinamen”; one owned by James Fay;<br />
and two others were at Waiemi and Pukalani, owned and run by William Burke (Olmsted 1841:<br />
233; Barrera & Kelly 1974: 45; Native Testimony, Waimea Water Rights Case 1914 – 1915).<br />
(p. 22)<br />
McGuire and Haun (2002) describe that the sandalwood trade started in the early 1800s. By<br />
1811, King Kamehameha had signed an exclusive agreement with three American<br />
entrepreneurs for access to Hawai‘i’s sandalwood resource. In return, Kamehameha received<br />
one-fourth of the net profits. As a monopoly of the ali‘i, the sandalwood trade grew unabated.<br />
Sandalwood was harvested from the slopes of Kohala Mountain and brought down to Kawaihae<br />
for shipment, until the supply of trees declined by the early 1840s. The sandalwood harvest<br />
had significant environmental impacts on the <strong>watershed</strong> resources, denuding the forest of<br />
sandalwood and causing a major change in the forest ecosystem species composition.<br />
Other agricultural products grown in the Waimea area in the first half of the 19 th century<br />
included sugar and potatoes. McGuire and Haun (2002) describe that sugar was an industry in<br />
Waimea from the mid-1830s until at least 1843. Before this time, sugar cane was grown by<br />
Hawaiians for their own consumption at locations around Waimea. The first sugar mill is<br />
described as having been established by a Chinese man named Lauki, who had come to Hawai‘i<br />
with Captain Joseph Carter, grandfather of A.W. Carter. The mill was powered by a water<br />
wheel using water from Waikoloa Stream. Because of the demand for Irish potatoes and sweet<br />
potatoes by those in California involved with the Gold Rush, Waimea farmers began to increase<br />
their production and shipping of potatoes to California, along with other agricultural products<br />
like vegetables, sugar, molasses and coffee (Kuykendall 1965: 313-314, 321-322). Haun and<br />
Wai‘ula‘ula Watershed Management Plan MK<strong>SWCD</strong>
McGuire (2002) note that this export market lasted only three short years, when the Irish<br />
potato market collapsed.<br />
By 1840, there was concern that the great herds of cattle would be diminished because of<br />
consistent hunting pressure. So, another kapu was placed on the cattle. In 1844, a man named<br />
William Beckley was named as konohiki of Waimea, “in addition to his role as manager of the<br />
king’s and government’s cattle (Lyons 1846 in McEldowney 1983: 432). Under his<br />
<strong>management</strong>, more lands were converted to pasturage and holding pens. McEldowney (1983)<br />
states that Lyons wrote that Waimea had turned into a “cattle pen.” He wrote that “[b]y<br />
another unfavorable arrangement 2/3 of Waimea have been converted to a pasture for<br />
government herds of cattle, sheep, horses, etc.” (Lyons 1846 in McEldowney 1983: 432).<br />
Through the 1840s and 1850s, the government of Hawai‘i passed new laws that initiated a<br />
process called the Mahele in which the land tenure system changed from a feudal system with<br />
all land controlled by the king and his chiefs, to a system of private land ownership. With the<br />
changes brought about by the Mahele, and in land ownership in Waimea, cattle ranching went<br />
through a major transition. Former cattlemen and others began to establish ranching<br />
operations. John Palmer Parker purchased the first acres of land that would become Parker<br />
Ranch in 1847. Bergin (2004) describes the history of Parker Ranch and its role in the<br />
development of Waimea town.<br />
During both World War I and World War II, Parker Ranch supplied the Armed Forces in Hawai‘i<br />
with beef. During World War II, over 20,000 men in the Army and Marines were living at a<br />
major encampment located at Puopelu in Waimea. They also used a large area of land between<br />
Waimea and Waikoloa as a firing range. Unexploded ordnance from this era remains a problem<br />
to this day.<br />
During the war, the farmers in the Waimea area prospered, growing fresh produce for the<br />
servicemen living in Waimea. McGuire and Haun (2002) describe that,<br />
Each farmer leased twenty acres of lands combined between Ranch and Waimea homesteaders.<br />
The farmers learned to grow new kinds of vegetables they had never grown before – lettuce,<br />
asparagus, celery, and broccoli were especially requested by the servicemen (Nakano 1992:<br />
101). The war helped the Waimea farmers make the shift from tenant farmers to commercial<br />
farmers. (p. 44)<br />
Laurance S. Rockefeller constructed the <strong>Mauna</strong> <strong>Kea</strong> Beach Hotel in the early 1960s, paving the<br />
way for future resorts and hotels to be developed in the region (Hawai‘i County 2008). In 1975,<br />
the Queen Ka‘ahumanu Highway was completed, connecting the coastal towns in West Hawai‘i<br />
and enabling further development of the coastline.<br />
During the 1980s, Parker Ranch, under the direction of the last remaining heir, Richard Smart,<br />
developed the Parker Ranch 2020 Plan to guide the future development of Waimea. Smart<br />
hoped the <strong>plan</strong> would allow Waimea to expand without losing its village character. In 1992,<br />
53<br />
Wai‘ula‘ula Watershed Management Plan MK<strong>SWCD</strong>
approval of the <strong>plan</strong> was granted by the County through the adoption of Ordinance 92-65,<br />
which rezoned over 580 acres of land in the Waimea area for commercial, industrial, and<br />
residential activities, as well as for community facilities. When Richard Smart died in 1992, he<br />
left most of the Ranch assets to the Parker Ranch Trust Foundation. This foundation supports<br />
five beneficiaries: North Hawai‘i Community Hospital, Lucy Henriques Medical Center, Parker<br />
School Trust Corporation, Hawai‘i Preparatory Academy, and the Richard Smart Fund of the<br />
Hawai‘i Community Foundation.<br />
In 1994, Parker Ranch began to revise its <strong>plan</strong> in response to community concerns and in light<br />
of the fiduciary responsibilities of the Parker Ranch Foundation trustees to the beneficiaries. As<br />
the cattle industry has become less profitable, the trustees have needed to explore<br />
diversification alternatives to generate more stable income for distribution to the beneficiaries.<br />
This diversification has included selling Parker Ranch Center and Parker Square, selling land to a<br />
developer for the development of condominium homes at HoloHoloKu, and a joint venture with<br />
Schuler Homes to develop single-family homes at Luala‘i. Figure 18 shows the Waimea Town<br />
Center Land Use Map from the Parker Ranch 2020 Plan.<br />
Today, Waimea town is the commercial center of the Wai‘ula‘ula <strong>watershed</strong>. There is<br />
residential development within Waimea town and along Kawaihae Road. <strong>Mauna</strong> <strong>Kea</strong> Beach<br />
Resort at the coast comprises hotel and residential developments, and golf courses. There are<br />
over 500 acres in cultivated agriculture within the Lālāmilo Farm Lots. Much of the remaining<br />
<strong>watershed</strong> is grazed or in a wildland state.<br />
2.2.5 Water Uses – Historic and Current<br />
For years, the presence of an extensive ‘auwai (irrigation channel system) has given rise to the<br />
possibility that large portions of the Waimea plains were irrigated and cultivated in ancient<br />
times. In fact, an important legal case on the water rights of Parker Ranch in the early 1900s<br />
led to the production of a detailed map of the ‘auwai system on the kula lands of Waikoloa Nui,<br />
Waikoloa Iki, Lālāmilo and Pu‘ukapu (Kanakanui et al., 1914; Reg. Map No. 2576), which depicts<br />
flow of water to and through many of the fee simple land interests awarded to native tenants in<br />
the region (Maly and Maly 2004).<br />
Hawai‘i County Department of Water Supply (DWS) relies on the streams of Kohala Mountain<br />
for its primary source of water in the Waimea area. The DWS system draws its water from<br />
diversions on Waikoloa and Kohākōhau streams. According to DWS (2006), the stream<br />
diversions currently provide 1.427 mgd of water. “The 2006 DWS 20-Year Water Master Plan<br />
indicates the estimated capacity of the surface water sources used by the water system to be<br />
1.45 mgd” (DWS 2006, p. 801-15). The diversion on Waikoloa Stream was first developed in<br />
1925, and the one on Kohākōhau Stream was completed in 1971. Raw water from the streams<br />
is stored in 4 reservoirs (2 of which were damaged in the 2006 earthquake and are currently<br />
undergoing repairs) with a total capacity of over 150 million gallons (MG). The water is treated<br />
in the DWS filtration <strong>plan</strong>t.<br />
54<br />
Wai‘ula‘ula Watershed Management Plan MK<strong>SWCD</strong>
55<br />
Figure 18: Waimea Town Center Land Use Map - Parker Ranch 2020 Plan<br />
Wai‘ula‘ula Watershed Management Plan MK<strong>SWCD</strong>
Use of surface water to supply potable water requires strict adherence to DOH regulations<br />
related to treatment and monitoring. The surface water is treated by conventional filtration for<br />
odor and color control, and for corrosion control and disinfection, and blended with<br />
groundwater before distribution (DWS 2006).<br />
During periods of prolonged dry weather or high water usage, the treatment <strong>plan</strong>t cannot<br />
process enough surface water sources to meet demand; as a result, DWS has developed a deep<br />
well in Waimea, which taps a high-level groundwater source, to supplement surface water<br />
sources. The Waimea water system provides about 2.0 mgd to users in Waimea and as far east<br />
as Pa‘auilo and west to the Waiemi subdivision on Kawaihae Road.<br />
DWS is currently updating its water use and development <strong>plan</strong>. A draft of the Hawai‘i County<br />
Water Use and Development Plan Update was completed in December 2006. With the existing<br />
DWS filtration <strong>plan</strong>t at capacity, stricter Environmental Protection Agency (EPA) standards for<br />
surface water used for domestic consumption, and rapid growth within the North and South<br />
Kohala regions taxing water supplies, the county will likely develop more groundwater<br />
resources in the very near future to meet the growing demand. Groundwater is also more<br />
reliable during periods of drought.<br />
Surface water from outside the Wai‘ula‘ula <strong>watershed</strong> is transported into the <strong>watershed</strong> for use<br />
by farmers in the Lālāmilo Farm Lots. The Hawai‘i Department of Agriculture's (DOA) Waimea<br />
Irrigation Water System provides irrigation water to farmers in both Pu‘ukapu and Lālāmilo<br />
(Figure 19). Pu‘ukapu farm lots are located on DHHL land east of Waimea town and south of<br />
Māmalohoa Highway. The Lālāmilo farm lots are situated west of Māmalohoa Highway south<br />
of Waimea town, within the Wai‘ula‘ula <strong>watershed</strong> at the terminus of the Waimea Irrigation<br />
System. Surface water from windward Kohala streams is diverted into the Upper Hāmākua<br />
Ditch to the system's 60 MG Waimea and 100 MG Pu‘u Pulehu reservoirs (DOA 2004). Pu‘u<br />
Pulehu Reservoir water can be transferred to the Waimea Reservoir via a booster pump and<br />
connecting pipeline (DOA 2004). The system then distributes water from the Waimea Reservoir<br />
to 566 acres of farm land in Pu‘ukapu and Lālāmilo. According to the DOA website<br />
(www.Hawai‘i.gov/hdoa/arm/arm_irrigation), the system currently transports 307.2 MG per<br />
year (0.842 mgd). During the 2006 earthquake, this 15-mile long system suffered considerable<br />
damage to the water intake structures, and conveyance ditches and tunnels.<br />
Other diversions in the <strong>watershed</strong> are described in Section 2.1.6.<br />
56<br />
Wai‘ula‘ula Watershed Management Plan MK<strong>SWCD</strong>
Figure 19: Waimea Irrigation System (taken from DOA 2003)<br />
2.2.6 Flooding and Flood Control<br />
Flooding has been a chronic problem in the Waimea area. Flooding of downtown Waimea and<br />
of roads crossing streams has been a particular concern. As Waimea has grown over the years,<br />
there are greater numbers of structures potentially in harm's way. In 2004, a 25-year storm<br />
event led to flooding of downtown Waimea when Waikoloa Stream jumped its banks, and to<br />
the closure of Wai‘aka bridge, Kawaihae Road, and Queen Kaahumanu Highway because of high<br />
water. In addition, the pipelines transmitting water from the water treatment <strong>plan</strong>t to Waimea<br />
were badly damaged, leaving Waimea without potable water for several days.<br />
While flooding has been a reality for decades in Waimea, it has become an even greater<br />
problem as more and more development occurs within or adjacent to flood prone areas. As<br />
more impervious surfaces are created through increased urban and suburban development,<br />
these hardened surfaces prevent infiltration and generate greater volumes of stormwater<br />
runoff.<br />
57<br />
Wai‘ula‘ula Watershed Management Plan MK<strong>SWCD</strong>
Photo by Carolyn Wong<br />
2004 Waimea Flood<br />
photo by Rosemary Alles<br />
In 1973, the State proposed channelizing a 1,600-ft. length of Waikoloa Stream as a way to<br />
reduce the frequency of flooding in Waimea (DLNR 1973). At the time of the EIS preparation,<br />
flooding had occurred at least eight times during the previous 12 years (DLNR 1973). The EIS<br />
identified one area prone to flooding as the stream section above Lindsey Road, where flood<br />
waters flowed through Waimea Park and sections of the old Hawai‘i Preparatory Academy (now<br />
St. James' Episcopal Church Circle). The State proposed building a concrete-lined channel<br />
beginning below the Lindsey Road bridge and ending downstream at a State of Hawai‘i owned<br />
property (Waimea Nature Park), bypassing the meanders of the natural stream and following a<br />
straight alignment (Figure 20). The draft EIS stated that “the flood control channel will alleviate<br />
the flooding in the area for the 50 year flood event, and may be capable of a 100 year flood<br />
capacity” (DLNR 1973; p. 16). It is hoped that through the Wai‘ula‘ula <strong>watershed</strong> <strong>management</strong><br />
project and innovative stormwater <strong>management</strong> techniques, Waikoloa Stream will never have<br />
to be channelized.<br />
In 1997, construction was completed on a grassed drainage channel on Parker Ranch land to<br />
divert Kamuela and Lanimaumau streams away from Waimea Town Center and toward open<br />
pasture land. While this flood control channel protects parts of Waimea from flooding, it falls<br />
outside the Wai‘ula‘ula <strong>watershed</strong>.<br />
Tom Nance Water Resource Engineering prepared a drainage analysis for the DHHL Lālāmilo<br />
Residential Project EIS “to establish the probable limits of flood inundation and provide greater<br />
accuracy for <strong>Kea</strong>nu‘i‘omanō and Lanikepu Streams (than shown on the FEMA FIRM maps), and<br />
to provide an initial flood delineation for Waikoloa Stream” (Nance 2002). To prepare the<br />
drainage analysis, an aerial topographic survey with 2-ft. contour intervals was undertaken; the<br />
100-year peak discharge rates for Waikoloa, <strong>Kea</strong>nu‘i‘omanō, and Lanikepu streams were<br />
determined; and the areas subject to flooding by the 100-year storm peaks were computed and<br />
mapped.<br />
The 100-year peak discharge rates used for the flood delineations on the FIRM panels for<br />
Hawai‘i Island are based on regression equations developed in 1977. These have not been<br />
updated, despite the availability of more streamflow data. To check the validity of the<br />
58<br />
Wai‘ula‘ula Watershed Management Plan MK<strong>SWCD</strong>
Figure 20: Proposed Pu‘ukapu Flood Control Project (Figure 3 from DLNR 1973)<br />
59<br />
Wai‘ula‘ula Watershed Management Plan MK<strong>SWCD</strong>
egression equation for leeward streams in light of the data now available, Nance (2002)<br />
compared data for four USGS gaging stations in the general vicinity of the project site. Table 1<br />
is taken from DHHL (2002) and compares the 100-year flood peak based on a Log Pearson Type<br />
III analysis of the annual flood peaks with the 100-year flood peak computed with the 1977<br />
regression equation.<br />
Table 1: Comparison of Computed 100-Year Peak Discharge Rates (Table 11 in DHHL 2002)<br />
<strong>Kea</strong>nu‘i‘omanō<br />
Stream<br />
Luahine<br />
Gulch<br />
Waikoloa<br />
Stream<br />
Kohākōhau<br />
Stream<br />
USGS Gage No. 7565 7558 7580 7560<br />
Elevation of Gaging Station 2410 3160 3460 3273<br />
(Feet MSL)<br />
Years of Record 31 33 53 37<br />
Log Pearson Type III<br />
Analysis of Annual Flood<br />
Peaks:<br />
M (Log Units) 3.0092 1.9475 2.6779 3.0102<br />
S (Log Units) 0.2936 0.2835 0.3457 0.3057<br />
k 100 (at skew = -0.05) 2.2895 2.2895 2.2895 2.2895<br />
Q 100 (CFS) 4801 395 2947 5130<br />
Application of the 1977<br />
Regression Equation:<br />
DA (Square Miles) 4.30 0.32 1.18 2.51<br />
P 24-2 (Inches) 6.00 4.40 6.20 6.20<br />
Q 100 (CFS) 6050 406 2407 4304<br />
The analysis concluded the following:<br />
The regression equation provides a conservative (i.e., safe) estimate for the <strong>Kea</strong>nu‘i‘omanō<br />
Stream gage. Since this gage is located immediately above the mauka end of DHHL’s project<br />
site, the regression equation result can be used for this stream.<br />
The regression equation also provides a conservative estimate for Luahine Gulch. This gulch has<br />
the same orientation relative to rainfall patterns as Lanikepu Stream and both waterways are<br />
normally dry. For this reason, it appears reasonable to use the regression equation for Lanikepu<br />
Stream.<br />
The regression equation significantly underestimates peak runoff for the gaging station site on<br />
Waikoloa and Kohākōhau Streams. However, both these gaging stations are at high elevations<br />
in the <strong>watershed</strong> where the stream channels are relatively deeply dissected. The channel of<br />
Waikoloa Stream makai of Waimea Town has less topographic definition. This means that there<br />
would be a significant amount of overbank flow during the 100-year flood event, resulting in<br />
significant attenuation of the peak discharge rate. In other words, the regression equation is<br />
60<br />
Wai‘ula‘ula Watershed Management Plan MK<strong>SWCD</strong>
considered to be a reasonable predictor of peak flowrates in the reach of Waikoloa Stream that<br />
passes along the south boundary of the project site.<br />
Areas subject to inundation by a 100-year flood were determined for Waikoloa, <strong>Kea</strong>nu‘i‘omanō,<br />
and Lanikepu Streams. For Lanikepu and <strong>Kea</strong>nu‘i‘omanō Streams, the areas subject to<br />
inundation by the 100-year flood are considerably narrower than shown on FEMA Panel 155166<br />
0164D. Waikoloa Stream’s inundated area, with the single exception where the flow splits into<br />
two channels, is also relatively narrow. The drainage analysis determined that the capacities of<br />
the stream channels are generally sufficient to contain most of the flood waters.” (DHHL 2002,<br />
pp. 4-10 to 4-13)<br />
In 2004, NRCS developed an Engineering Report for the Waimea Nature Park (Ulu La‘au) that<br />
describes alternatives for enhancing stream channel and bank stability, reducing flood-related<br />
damage to the Park and improving wildlife and aquatic habitat. It provides detailed hydrologic<br />
and hydraulic analyses of the stream reach. The hydraulic analysis determines the peak flood<br />
discharge rates at identified stream locations for various storm intensities, associated with<br />
recurrence intervals. The peak flood discharges for Waikoloa Stream through the Park were<br />
estimated using the existing FEMA analysis. Based on this information, NRCS (2004) estimated<br />
that the peak discharge for a 100-year storm at the Park would be 2,600 cfs. NRCS also<br />
conducted a hydraulic analysis to determine the characteristics of stream flow in the natural<br />
channel and with proposed modifications.<br />
2.2.7 Stormwater Management<br />
In Hawai‘i County, all new urban developments (with very few exceptions) have been mandated<br />
to maintain pre-development runoff conditions (Chapter 27, HCC, “Floodplain Management”).<br />
Pre- and post- development runoffs are calculated using the County “Storm Drainage<br />
Standard.” The minimum criteria used for runoff calculations are a 1-hour, 10-year storm<br />
event. This requirement inhibits conveyance of development runoff into natural drainage<br />
systems. It specifies that stormwater shall be disposed into drywells, infiltration basins or other<br />
approved infiltration methods. Chapter 23, HCC, “Subdivision” and Chapter 25, HCC, “Zoning”<br />
contain these same requirements.<br />
Hawai‘i County has historically relied on deep (+20 feet) 5-ft diameter drainage injection wells<br />
(or “dry wells”) as the primary means of capturing and disposing of urban stormwater runoff<br />
from roads and parking lots because Hawai‘i Island's geology allows for good lateral and<br />
downward percolation. The county allows a maximum disposal rate of 6 cfs of water per dry<br />
well (Kuba 2005). While Izuka et al. (2010) examined the potential effects of dry wells on<br />
county roads on the water quality of receiving waters at the coast and in drinking water wells,<br />
they did not consider effects to surface waters. Figure 21 identifies the location of many of<br />
Waimea's dry wells.<br />
There is one large pipe discharging urban stormwater runoff directly into Waikoloa Stream.<br />
This concrete pipe is located behind the Waimea Community Education building on Māmalohoa<br />
Highway and discharges untreated runoff from storm drains along Māmalohoa Highway. PVC<br />
61<br />
Wai‘ula‘ula Watershed Management Plan MK<strong>SWCD</strong>
pipes discharge roof runoff from the KTA shopping center directly into Waikoloa stream.<br />
Within DHHL’s Lālāmilo development, it appears that runoff from the subdivision’s yards is<br />
being channeled down steep, rock lined slopes into Lanikepu and <strong>Kea</strong>nu‘i‘omanō streams.<br />
Figure 21: Dry Wells In and Around Waimea<br />
2.2.8 Cultural Resources<br />
The Wai‘ula‘ula <strong>watershed</strong> is located in an area that has a very rich cultural history. Table 2.9 of<br />
the South Kohala Community Development Plan (Hawai‘i County 2008) summarizes information<br />
on historical and cultural sites within the Waimea area, many of which are in the Wai‘ula‘ula<br />
<strong>watershed</strong>.<br />
62<br />
Wai‘ula‘ula Watershed Management Plan MK<strong>SWCD</strong>
Historical and Cultural Sites in Waimea: Native Hawaiian Sites (Hawai‘i County 2008)<br />
No. Site Structure Description Wai‘ula‘ula<br />
<strong>watershed</strong><br />
1 Haleino<br />
“Women's<br />
Heiau”<br />
2 Heiau built by<br />
Makuakua<br />
3 Lālāmilo Field<br />
System<br />
4 Various<br />
agricultural,<br />
habitation,<br />
religious, and<br />
burial sites<br />
Heiau<br />
Heiau<br />
Historical accounts attribute the founding of the heiau to high<br />
chiefess Hoapiliahae. It is said that young virgins performed<br />
ceremonies at the heiau and learned about the science and<br />
practices of healing.<br />
The akua Makuakua observed a rainbow and found the goddess<br />
Wao. The two lived at Hōkū‘ula. Wao returned to the Waimea<br />
hillsides to bear children. Thus the hillsides were sacred. A kapu was<br />
proclaimed in her honor on the hillsides. The boundary of the kapu<br />
area was delineated by rolling stones down the hill. The place<br />
where the stones stopped delineated the boundary of the area.<br />
Identified in 1976 as a veritable treasure of 400+ acres of pastoral<br />
lands, house sites, hearths and stone enclosures. The field system<br />
was developed by Native Hawaiians prior to contact with western<br />
civilization.<br />
Several of these sites are known to exist in the vicinity of various<br />
streams, pasture lands, and hillsides of Waimea. Although most<br />
have not been surveyed, they have been identified especially in<br />
areas that have not been altered by farming or urban development.<br />
Historical and Cultural Sites in Waimea: Paniolo Sites (Hawai‘i County 2008)<br />
No. Site Structure Description Wai‘ula‘ula<br />
<strong>watershed</strong><br />
5 Parker Ranch<br />
Race Track<br />
6 Additional<br />
Parker Ranch<br />
Structures<br />
7 Parker Ranch<br />
Slaughter<br />
House<br />
8 Pukalani<br />
Complex<br />
Track built in 1901;<br />
Horse Barn (1915);<br />
Attendant House and<br />
Stallion Barn (1930)<br />
Mana Complex (1847);<br />
Spencer Home (1875);<br />
Manager's House (1885);<br />
Kahilu Hall (1918)<br />
This complex of buildings<br />
consists of: Pu‘u Hihale<br />
Complex, Breaking Pen<br />
Stables, Carriage Barn<br />
(Surgery Barn), Black<br />
Smith Stable, Pukalani<br />
Stables<br />
Stone wall enclosure that formed Minuke Ole pen.<br />
Built in the early 1940s.<br />
These buildings were essential to Parker Ranch's<br />
ranching operations. Possibility of incorporating this<br />
complex into a heritage community with a heritage<br />
center/museum. Built in the late 1800s.<br />
9 Breaking Pen Coffee shack and stone wall enclosure. Built in 1905.<br />
√<br />
√<br />
√<br />
√<br />
√<br />
√<br />
63<br />
Wai‘ula‘ula Watershed Management Plan MK<strong>SWCD</strong>
No. Site Structure Description Wai‘ula‘ula<br />
<strong>watershed</strong><br />
10 Pu‘u Hihale<br />
Complex<br />
11 Waimea<br />
Stables<br />
Viewing lanai (1900);<br />
Cowboy Gang Stables<br />
(1930, remodeled 1985);<br />
Bucking and Grooming<br />
Chute (1944)<br />
Stone wall that preexisted<br />
the stables by 50-<br />
100 years.<br />
Stone wall corral with walls 8' high by 6' wide. Cattle<br />
branding viewing lanai. Chute built for the Marine<br />
Rodeo. Referred to as the “Paniolo Heiau” and is<br />
considered the most significant Paniolo historic site in<br />
Waimea. Built in the late 1800s.<br />
Converted to a working corral in 1985. Originally<br />
constructed in 1960.<br />
12 Kemole Corral Rebuilt often. Originally built in 1930.<br />
13 Pu‘u Kikoni<br />
Corral<br />
14 Pu‘u Kikoni<br />
Dairy Site<br />
Rebuilt often. Originally built in 1930.<br />
Called New Dairy. Built in 1920.<br />
15 Anna Ranch Anna Lindsey Perry-Fiske, the last of five generations<br />
of Lindseys to run the ranch, died at age 95 in 1995<br />
and left the ranch as her legacy to the people of<br />
Waimea.<br />
16 Pali<br />
Ho‘oukapapa<br />
Dairy Site<br />
17 Mana House<br />
Complex<br />
18 Makahalau<br />
Complex<br />
19 Hanaipoe Line<br />
Cabin<br />
20 Waikii<br />
Complex<br />
Creamery (late 1800s);<br />
Corn Silo (1914); Corral<br />
(1920+)<br />
Corn Crib and Silo<br />
(1914); Cowboy Camp<br />
House (1920);<br />
Makahalau Stables and<br />
Corral (1920); Purebred<br />
Bull Barns (1935)<br />
Corn Silos (1914);<br />
Cooking ovens (1915);<br />
Large Barn, Corn Crib<br />
and Cowboy Stable Barn<br />
(1920); Attendant Corral,<br />
Homes and Quonset<br />
Huts (various dates)<br />
Later became a working corral. Originally built in the<br />
late 1800s.<br />
Was once a village like Mana.<br />
Became the home for section chief Seichi Morifuji and<br />
was kept as a recreational cabin for ranch employees.<br />
Built in the 1930s.<br />
Ovens of both Russian and Portuguese origin.<br />
√<br />
64<br />
Wai‘ula‘ula Watershed Management Plan MK<strong>SWCD</strong>
Historical and Cultural Sites in Waimea: Homes (Hawai‘i County 2008)<br />
No. Site Structure Description Wai‘ula‘ula<br />
<strong>watershed</strong><br />
23 Frank Spencer<br />
House<br />
24 Antony Smart<br />
House<br />
Combined styles and the use of Koa wood. Home of Judge<br />
Bickerton and served as an early court house and hotel.<br />
Associated with several of Waimea's prominent families. Built in<br />
1850.<br />
Original location in Waiemi. Built during the 1830s.<br />
25 Purdy House Built by Harry W.W. Purdy who was one of Waimea's earliest<br />
foreign adventurers and a contemporary of John Palmer Parker.<br />
Built in 1840.<br />
26 Old Lindsey<br />
House<br />
27 Hale <strong>Kea</strong><br />
(Jacaranda Inn)<br />
Home of A.W. Carter. The oldest part of Hale <strong>Kea</strong> was built<br />
around 1885 and was first used as an Episcopal Church.<br />
Historical and Cultural Sites in Waimea: Stores (Hawai‘i County 2008)<br />
No. Site Structure Description Wai‘ula‘ula<br />
<strong>watershed</strong><br />
28 Kamuela Liquor Formerly this location was the Wakayama Theater, a gathering<br />
place for early Japanese settlers in Waimea.<br />
29 Chock In One of the last surviving stores that was built near the turn of the<br />
century. Built in 1908.<br />
√<br />
√<br />
√<br />
v<br />
√<br />
2.2.9 Relevant Authorities/Policies<br />
There are numerous authorities at the county, state and federal levels that affect the<br />
<strong>management</strong> of natural resources and regulate potential sources of polluted runoff (Stewart<br />
2009). Those relevant to land and water use activities within the Wai‘ula‘ula <strong>watershed</strong> are<br />
summarized below.<br />
2.2.9.1 Agricultural Lands<br />
The local <strong>Mauna</strong> <strong>Kea</strong> Soil and Water Conservation District (MK<strong>SWCD</strong>) is a major player in the<br />
<strong>management</strong> of agricultural lands because it develops and approves conservation <strong>plan</strong>s which<br />
allow agricultural operations to receive an exemption from the county grading ordinances<br />
(Chapter 180, HRS). Without an approved conservation <strong>plan</strong>, agricultural operators are<br />
required under Chapter 10, HCC, to get a permit from the Hawai‘i County Department of Public<br />
Works (DPW) for any earthwork.<br />
65<br />
Wai‘ula‘ula Watershed Management Plan MK<strong>SWCD</strong>
Significant amounts of land in agriculture are State lands leased to agricultural operators. The<br />
Department of Land and Natural Resources (DLNR) Land Division is responsible for leasing these<br />
lands under Chapter 171, HRS. One of the lease conditions is that the operator works with the<br />
local soil and water conservation district to develop and implement a conservation <strong>plan</strong>.<br />
Pursuant to Act 90, SLH 2003, beginning on January 1, 2010, the authority to manage,<br />
administer, and exercise control over any public lands that are designated important<br />
agricultural lands pursuant to Section 205-44.5, HRS, will be transferred from DLNR to the State<br />
Department of Agriculture (DOA) (Section 171-3(b), HRS).<br />
U.S. Department of Agriculture’s Natural Resources Conservation Service (NRCS) usually helps<br />
in developing conservation <strong>plan</strong>s to treat existing and potential resource problems and has<br />
funding available to assist with the installation of best <strong>management</strong> practices. NRCS primarily<br />
develops <strong>plan</strong>s for operators seeking funding under Federal Farm Bill programs. NRCS’s Hawai‘i<br />
Field Office Technical Guide (eFOTG) outlines conservation practice standards and<br />
specifications.<br />
Chapter 11-21, HAR, “Cross-Connection and Back-Flow Control,” administered by DOH, requires<br />
that a reduced pressure principal back-flow preventer or air gap separation be installed as part<br />
of any piping network in which fertilizers, pesticides and other chemicals or toxic contaminants<br />
are injected or siphoned into the irrigation system (§11-21-7(a)(4), HAR).<br />
2.2.9.2 Pesticides<br />
Under the authority of Chapter 149A, HRS, DOA, Pesticides Branch, is the lead agency for<br />
implementing those measures that relate to regulating pesticides. Chapter 4-66, HAR,<br />
administered by DOA, relates to the registration, licensing, certification, record-keeping, usage,<br />
and other activities related to the safe and effective use of pesticides. It requires that those<br />
who apply or directly supervise others who apply restricted use pesticides be certified.<br />
Certification requires some understanding of the environmental concerns of using pesticides.<br />
This requirement is implemented under the CES/DOA Pesticide Applicator Program.<br />
Certification is not required for those using pesticides that are not classified as “restricted use.”<br />
2.2.9.3 Wastewater Disposal<br />
Chapter 11-62, HAR, administered by DOH, outlines the requirements for locating, building and<br />
operating wastewater treatment systems and individual wastewater systems. Section 11-62-<br />
03, HAR, defines an “individual wastewater system” as “a facility which is used and designed to<br />
receive and dispose of no more than 1,000 gallons per day of domestic wastewater” and<br />
“treatment works” as “any treatment unit and its associated collection system and disposal<br />
system, excluding individual wastewater systems.” The chapter provides specific requirements<br />
for both types of wastewater systems. An engineer must evaluate the site for suitability for an<br />
on-site disposal system (OSDS), including depth of permeable soil over seasonal high<br />
groundwater, bedrock, or other limiting layer, soil factors, land slope, flooding hazard, and<br />
amount of suitable area available. No OSDS can be located within 50 feet of a stream, the<br />
66<br />
Wai‘ula‘ula Watershed Management Plan MK<strong>SWCD</strong>
ocean at the vegetation line, pond, lake, or other surface water body; or within 1,000 feet of a<br />
potable water source serving public water systems. Chapter 11-62, HAR, also requires that no<br />
wastewater system (including OSDSs) be operated in such a way that it creates or contributes<br />
to: wastewater spill, overflow, or discharge onto the ground or surface waters; or<br />
contamination, pollution or endangerment of drinking water.<br />
Chapter 11-62, HAR, also provides for the establishment of Critical Wastewater Disposal Areas<br />
(CWDAs), where the disposal of wastewater has or may cause adverse effects on human health<br />
or the environment due to existing hydrogeological conditions. CWDAs are established based<br />
on one or more of the following concerns: high water table; impermeable soil or rock<br />
formation; steep terrain; flood zone; protection of coastal waters and inland surface waters;<br />
high rate of cesspool failures; and protection of groundwater resources. CWDAs were<br />
designated for each county in 1990 and updated in 1997 (see Figure 22). Within CWDAs, DOH<br />
may impose more stringent requirements for wastewater systems, and cesspools are severely<br />
restricted or prohibited.<br />
Chapter 11-23, HAR, also administered by DOH, establishes a state underground injection<br />
control (UIC) program in order to protect the quality of the State’s underground sources of<br />
drinking water from pollution by subsurface disposal of fluids. It classifies exempted aquifers<br />
and underground sources of drinking water. Unless expressly exempted, all aquifers are<br />
considered underground sources of drinking water. UIC maps indicate the boundary line of<br />
exempted aquifers. While individual wastewater systems serving single family residential<br />
households are excluded from the chapter, no large municipal or community serving systems<br />
can use injection wells above the UIC line. Certain activities are also prohibited interior of the<br />
line.<br />
The U.S. Environmental Protection Agency (EPA) promulgated Underground Injection Control<br />
(UIC) regulations on December 7, 1999, which prohibit the construction of new large capacity<br />
cesspools nationwide, effective April 5, 2000. A large capacity cesspool (LCC) is a cesspool<br />
serving multiple (two or more) dwellings, a community or regional development, or any nonsingle<br />
family residential building/business that generates sanitary wastes, containing human<br />
excreta from 20 or more persons per day. Existing LCCs were required to be replaced by an<br />
alternative wastewater system and closed by April 5, 2005.<br />
Efforts to ban the use of new cesspools statewide have been made through revision to Chapter<br />
11-62, HAR. The rule either bans or severely restricts the use of cesspools throughout the<br />
state. New cesspools are completely banned on the islands of Oahu and Kauai. On the islands<br />
of Maui, Molokai, and Hawai‘i, new cesspools for individual homes only are allowed in certain<br />
areas. These areas are designated in Critical Wastewater Disposal Area (CWDA) maps. The<br />
CWDA maps also delineate areas where cesspools are completely banned. In the Wai‘ula‘ula<br />
<strong>watershed</strong>, the coastal area and specific areas of Waimea are designated CWDA with no<br />
exceptions, meaning that cesspools are not allowed. While there is one small band in the lower<br />
<strong>watershed</strong> delineated as non-CWDA, the majority of the <strong>watershed</strong> is designated CWDA with 5-<br />
acre exception, in which cesspools are allowed for individual houses on parcels greater than 5<br />
67<br />
Wai‘ula‘ula Watershed Management Plan MK<strong>SWCD</strong>
acres. The maps are based upon development density, groundwater development, potential<br />
contamination of coastal waters, and the use of OSDS.<br />
Figure 22: Critical Wastewater Disposal Areas for Hawai‘i Island<br />
Although the current rule still allows some new cesspools in limited areas, there are a number<br />
of items that either prohibit new cesspools or require that existing cesspools be upgraded.<br />
They include:<br />
68<br />
Wai‘ula‘ula Watershed Management Plan MK<strong>SWCD</strong>
• Not allowing a new dwelling to be connected to an existing cesspool serving an existing<br />
dwelling;<br />
• Requiring an existing cesspool system to meet current wastewater rules if there is a<br />
change in building usage or characteristics of the wastewater. For example, an existing<br />
cesspool must be upgraded if a non-dwelling using a cesspool is converted to a dwelling<br />
or a commercial building (e.g., office space) is converted to a food establishment;<br />
• Current rules do not allow two new dwellings (including ‘ohana units) to be served by a<br />
cesspool; such a cesspool would be considered a large capacity cesspool (LCC), which is<br />
banned; and<br />
• Current rules do not allow non-dwellings generating non-domestic-like wastewater to<br />
discharge wastewater into a new cesspool.<br />
The South Kohala Community Development Plan (Hawai‘i County 2008) includes as a Districtwide<br />
sub-policy “ensure the quality of South Kohala's groundwater resources and marine<br />
resources.” It goes on to recommend: “County should consider adding the following<br />
requirement to HCC 23-85(b) for residential projects: No cesspools or seepage pits shall be<br />
installed in South Kohala after the effective date of this <strong>plan</strong>. The effluent from any septic tank<br />
installed in South Kohala after the effective date of this <strong>plan</strong> shall be discharged into an<br />
absorption system that meets the design standards of the State Department of Health” (p. 51).<br />
Chapter 17-47, HCC, administered by the County of Hawai‘i DPW, modifies the Uniform<br />
Plumbing Code to require the use of low flow plumbing fixtures. Chapter 27, HCC, states that<br />
on-site cesspools and septic systems shall be located to avoid impairment to them or<br />
contamination from them during flooding.<br />
2.2.9.4 Use of Recycled Wastewater<br />
Chapter 11-62, HAR, administered by DOH, allows for the use of recycled water for irrigation<br />
with written approval by the director, provided the owner of the recycled water system submits<br />
an engineering report for approval which clearly identifies all BMPs to be implemented, an<br />
irrigation use <strong>plan</strong>, overflow control <strong>plan</strong>, <strong>management</strong> <strong>plan</strong>, public information and access<br />
<strong>plan</strong>, labeling <strong>plan</strong>, employee training <strong>plan</strong>, vector control <strong>plan</strong>, and groundwater monitoring<br />
<strong>plan</strong>. For golf courses, the director is guided by DOH’s Guidelines for the Treatment and Use of<br />
Recycled Water (May 2002). R-2 and R-1 waters may be used for golf course irrigation.<br />
69<br />
2.2.9.5 Rubbish and Pet Waste<br />
Chapter 342H, HRS, “Solid Waste Management,” administered by DOH, prohibits disposal of<br />
solid waste anywhere other than a permitted solid waste <strong>management</strong> system. It encourages<br />
the recycling of solid wastes, including animal wastes and selected non-hazardous industrial<br />
wastes, and the composting of animal manures and by-products for agricultural and<br />
horticultural purposes. It also encourages the use of treated sludge effluent for fertilizer and<br />
other agricultural purposes.<br />
Wai‘ula‘ula Watershed Management Plan MK<strong>SWCD</strong>
Chapter 20, HCC, administered by the Hawai‘i County DPW, prohibits littering on any highway,<br />
street, road, alley, sidewalk, beach, public park, or other public place in the county. Litter is<br />
broadly defined to include, among other things, dirt, paper, wrappings, cigarettes, yard<br />
clippings, leaves, wood, scrap metal, and any other waste materials.<br />
The county also administers the ordinance addressing pet waste. Chapter 4, HCC, prohibits pet<br />
owners from allowing their pets to defecate on public streets, including sidewalks,<br />
passageways, or bypasses, or on any play areas, parks, or places where people congregate or<br />
walk, or on any public property, or on any private property without the permission of the<br />
owner of the property, unless the pet owner immediately picks up and properly disposes of the<br />
feces.<br />
2.2.9.6 Hazardous Materials Disposal and Storage<br />
Chapter 342I, HRS, “Special Waste Recycling,” administered by DOH, prohibits disposal of used<br />
lead acid battery, except by delivery to a lead acid battery retailer or wholesaler, a collection or<br />
recycling facility, or a secondary lead smelter, and specifically prohibits disposal of electrolyte<br />
from any used lead acid battery onto the ground or into sewers, drainage systems, surface or<br />
ground waters, or ocean waters.<br />
Chapter 342J, HRS, “Hazardous Waste,” also administered by DOH, prohibits discharge of new,<br />
used or recycled oil into sewers, drainage systems, surface or ground waters, watercourse,<br />
marine waters, or onto the ground. The prohibition does not apply to inadvertent, normal<br />
discharges from vehicles and equipment, or maintenance and repair activities, provided that<br />
appropriate measures are taken to minimize releases.<br />
Chapter 11-281, HAR, administered by DOH, regulates underground storage tanks (UST). Each<br />
UST must be properly designed, constructed, and installed, and any portion underground that<br />
routinely contains product must be protected from corrosion. UST are used to store petroleum<br />
products at gas stations in the <strong>watershed</strong>, two of which are located adjacent to Waikoloa<br />
Stream.<br />
2.2.9.7 Urban Development<br />
In urban areas, the county has the lead in the control of erosion during site development and<br />
ensuring proper site <strong>plan</strong>ning and stormwater <strong>management</strong> to protect sensitive natural<br />
features, through its ordinances and rules related to zoning, subdivisions, drainage, and erosion<br />
and sediment control.<br />
Chapter 10, HCC, “Soil Erosion and Sediment Control,” administered by the Hawai‘i County<br />
Department of Public Works (DPW), requires a permit for grading and grubbing of land, and<br />
stockpiling of material in excess of 500 cubic yards. All grading, grubbing, and stockpiling<br />
70<br />
Wai‘ula‘ula Watershed Management Plan MK<strong>SWCD</strong>
permits and operations must conform to erosion and sedimentation control standards and<br />
guidelines. Hawai‘i County is currently in the process of revising this ordinance.<br />
In Hawai‘i County, all urban developments (with very few exceptions) have been mandated to<br />
maintain pre-development runoff conditions (Chapter 27, HCC, “Floodplain Management”).<br />
Pre- and post- development runoffs are calculated using the County “Storm Drainage<br />
Standard.” The minimum criteria used for runoff calculations are a 1-hour, 10-year storm<br />
event. This requirement inhibits conveyance of development runoff into natural drainage<br />
systems. It specifies that stormwater shall be disposed into drywells, infiltration basins or other<br />
approved infiltration methods. Chapter 23, HCC, “Subdivision,” and Chapter 25, HCC, “Zoning,”<br />
contain these same requirements.<br />
In Hawai‘i County, Chapter 25, HCC, “Zoning,” provides for Cluster Plan Development, in which<br />
exceptions are made to the density requirements of the single-family residential (RS) district on<br />
lands greater than two acres so that permitted density of dwelling units contemplated by the<br />
minimum building site requirements is maintained on an overall basis, and desirable open<br />
space, tree cover, recreational areas, and scenic vistas are preserved. It also provides for<br />
Project Districts, which are intended to provide for a flexible and creative <strong>plan</strong>ning approach<br />
rather than specific land use designations for quality developments on lands greater than 50<br />
acres, establishing a continuity in land uses and designs while providing for a comprehensive<br />
network of infrastructural facilities and systems.<br />
If development activity will disturb one acre or more of total land area, then a National<br />
Pollutant Discharge Elimination System (NPDES) permit is required from the Hawai‘i<br />
Department of Health (DOH). This permit process is described in Chapter 11-55, HAR, “Water<br />
Pollution Control” (http://gen.doh.Hawai‘i.gov/sites/har/AdmRules1/11-55.pdf). A County<br />
grading permit is required for any grading and grubbing work before a NPDES permit can be<br />
issued. The grading permit allows the grading, while the NPDES permit regulates stormwater<br />
runoff from the construction site.<br />
Typically, large development proposals must undergo numerous permit processes, with their<br />
associated environmental assessments and extensive public review. Development in the<br />
Conservation District triggers a Conservation District Use Permit (CDUP) from DLNR;<br />
development within the county’s Special Management Area (SMA) requires an SMA permit<br />
from the County <strong>plan</strong>ning department. Chapter 343, HRS, and Chapter 11-200, HAR, both<br />
about Environmental Impact Statements, require the preparation of an environmental<br />
assessment (EA) and/or environmental impact statement (EIS) for proposed activities that<br />
trigger the environmental review process. Some of the trigger conditions include: (1) use of<br />
State or county lands or funds; (2) use within the conservation district; (3) use within a<br />
shoreline setback area; (4) use within an historic site; (5) reclassification of conservation lands;<br />
and (6) certain amendments to a county general <strong>plan</strong>.<br />
The county administers the Special Management Area (SMA) permit process. SMAs are a<br />
subset of the State’s coastal zone and include all lands and waters beginning at the shoreline<br />
71<br />
Wai‘ula‘ula Watershed Management Plan MK<strong>SWCD</strong>
and extending inland or mauka at least 100 yards. The SMA permit process, administered by<br />
the Hawai‘i County Planning Department, ensures that developments in these more-sensitive<br />
coastal areas are consistent with Hawai‘i’s coastal zone <strong>management</strong> (CZM) program objectives<br />
and policies. Although each county has its own procedures for administering SMA permits, the<br />
requirements and review processes for SMA applications are based on Chapter 205A-26, HRS<br />
(“Special <strong>management</strong> area guidelines”). The county requires a permit applicant to describe<br />
the proposed development in terms of the CZM objectives and policies.<br />
2.2.9.8 Roads, Highways and Bridges<br />
In Hawai‘i, roads, highways and bridges are usually developed by the State or county<br />
government, with State, county and/or Federal funds, or by private entities as part of a<br />
subdivision or other large development. Privately-constructed roads and highways usually<br />
must meet standards set by the State and/or county because they are transferred over to the<br />
State or county as public roadways upon completion of construction. Privately-constructed<br />
roads that remain private must still comply with county requirements for erosion and sediment<br />
control, stormwater <strong>management</strong>, drainage, zoning and subdivisions. A 1999 State Attorney<br />
General's opinion clarified that all public highways are County highways unless declared by<br />
Chapter 264, HRS, to be under State jurisdiction.<br />
Construction of public roads, highways and bridges will normally trigger the Chapter 343, HRS,<br />
process because of the use of State or county funds and/or lands. In determining whether an<br />
action may have a significant effect on the environment, the approving State or county agency<br />
must consider every phase of a proposed action, the expected consequences, both primary and<br />
secondary, and the cumulative as well as the short-term and long-term effects of the action. In<br />
most instances, an action will be determined to have a significant effect on the environment if<br />
it detrimentally affects water quality or affects an environmentally sensitive area such as a<br />
flood plain, beach, erosion-prone area, estuary, fresh water, or coastal waters. Mitigation<br />
measures must be identified to address these detrimental effects.<br />
Hawai‘i Department of Transportation (DOT) has jurisdiction over State roadways. According to<br />
Section 264-8, HRS, specifications, standards and procedures prescribed by DOT are to be<br />
followed in the installation and construction of connections for streets, roads and driveways,<br />
concrete curbs and sidewalks, structures, drainage systems, landscaping or grading within the<br />
highway rights-of-way, excavation and backfilling of trenches or other openings in state<br />
highways, and in the restoration, replacement, or repair of the base course, pavement surfaces,<br />
highway structures, and other highway improvements.<br />
DOT Standard Specifications are used for highway design and construction for Hawai‘i’s<br />
transportation infrastructure. The current specifications in use are dated 1994, though many<br />
sections (technical provisions) have been revised since then. The updated 2005 Standard<br />
Specifications for Road and Bridge Construction requires written, site-specific BMPs describing<br />
activities to minimize water pollution and soil erosion into State waters, drainage or sewer<br />
systems, and a <strong>plan</strong> indicating location of the BMPs, areas of soil disturbance, areas where<br />
72<br />
Wai‘ula‘ula Watershed Management Plan MK<strong>SWCD</strong>
vegetative practices are to be implemented, and drainage patterns. DOT’s Storm Water<br />
Permanent Best Management Practices (BMP) Manual (February 2007) applies to projects<br />
statewide within the DOT right-of-way.<br />
Chapter 23, HCC, provides requirements for street design in subdivisions in Hawai‘i County. It<br />
requires the location, width, and grade of a street to conform to the County general <strong>plan</strong> and to<br />
be considered in its relation to existing and <strong>plan</strong>ned streets, to topographical conditions, to<br />
public convenience and safety, and to the proposed use of land to be served by the street.<br />
When an existing street adjacent to or within a tract is not of the width required by this<br />
chapter, additional rights-of-way shall be provided at the time of subdivision. Preliminary and<br />
final plats must show the location of lots, streets, water mains, and storm drainage systems,<br />
and are subject to technical review by the county director of public works, State DOH, and<br />
district engineer for DOT when the subdivision involves State highways. The ordinance also<br />
provides requirements for dedicable streets and standards for non-dedicable streets.<br />
Subdivisions, including roads, must maintain pre-development runoff conditions. Pre- and<br />
post- development runoffs are calculated using the County “Storm Drainage Standard.” The<br />
minimum criteria used for runoff calculations are a 1-hour, 10-year storm event. This<br />
requirement inhibits conveyance of development runoff into natural drainage systems.<br />
Chapter 22, HCC, “County Streets,” defines and regulates construction within a county street. It<br />
states that no driveway approach shall interfere with the proper runoff of waters into or<br />
passage of waters through existing drainage culverts, swales, ditches, watercourses, defiles, or<br />
depressions.<br />
Chapter 19-127.1, HAR, administered by DOT, addresses the design, construction and<br />
maintenance of public streets and highways. It applies to all persons and agencies who design,<br />
construct, and maintain facilities which are, or are intended to become, public streets and<br />
highways in the State. The chapter establishes design, construction and maintenance<br />
guidelines that should be followed in the construction, reconstruction, and maintenance of all<br />
highways, streets, or roads undertaken either by State or county authorities or by individuals<br />
intending to dedicate the facilities to governmental authorities.<br />
2.2.9.9 Hydromodifications<br />
The State Water Code (Chapter 174C, HRS), adopted by the Hawai‘i Legislature in 1987 and<br />
amended in 2004, provides the regulatory framework to protect streams, wetlands and other<br />
areas critical to water quality. The State, in its stewardship capacity, has <strong>management</strong><br />
responsibility for all water resources of the State through the Commission on Water Resource<br />
Management (CWRM) – also known as the Water Commission. The Water Commission sets<br />
policies and approves water allocations for all water users.<br />
CWRM issues permits to regulate the use of surface and ground water in the State. Existing<br />
uses established prior to 1987 are grandfathered in, provided the existing use is reasonable and<br />
beneficial. A stream channel alteration permit (SCAP) is required prior to undertaking a stream<br />
channel alteration in order to protect fishery, wildlife, recreational, aesthetic, scenic, and other<br />
73<br />
Wai‘ula‘ula Watershed Management Plan MK<strong>SWCD</strong>
eneficial instream uses. Routine streambed and drainageway maintenance activities are<br />
exempted from obtaining a permit.<br />
The Water Code also requires CWRM to establish and administer a statewide in-stream use<br />
protection program, including flow standards on a stream-by-stream basis whenever necessary<br />
to protect the public interest. Instream flow standards describe the flow necessary to<br />
adequately protect fishery, wildlife, aesthetic, scenic, or other beneficial instream uses.<br />
Instream uses include: maintenance of fish and wildlife habitats, outdoor recreational activities,<br />
maintenance of ecosystems such as estuaries, wetlands, and stream vegetation, aesthetic<br />
values such as waterfalls and scenic waterways, navigation, instream hydropower generation,<br />
maintenance of water quality, conveyance of irrigation and domestic water supplies to<br />
downstream points of diversion, and the protection of traditional and customary Hawaiian<br />
rights.<br />
The State is in the process of establishing instream flow standards for perennial streams, in<br />
order to balance maintenance of fish and wildlife habitat, estuarine, wetland and stream<br />
ecosystems, and water quality with use of the water (CWRM 2005). Section 13-169-46,HAR,<br />
adopted in 1988, establishes interim instream flow standards (IFS) for Hawai‘i. These were<br />
generally defined as the amount of water flowing in each stream on the effective date of the<br />
standard. The standards for some individual streams have subsequently been amended as a<br />
result of petitions to amend the IFS and describe the amount of water that can be withdrawn<br />
from the stream. Specific instream flow standards have not been established for any streams<br />
within the Wai‘ula‘ula <strong>watershed</strong>.<br />
Under Chapter 46-11.5, HRS, the counties are responsible for the maintenance of channels,<br />
streambeds, streambanks, and drainageways, whether natural or artificial, including their exits<br />
into the ocean, in suitable condition to carry off stormwaters. For lands comprising the<br />
channels, streams, streambanks, and drainageways that are privately owned or owned by the<br />
State, the respective owner is responsible for maintenance.<br />
The U.S. Army Corps of Engineers (USACOE) has the authority to protect the waters of the<br />
United States, including wetlands and some streams, by regulating certain activities within<br />
those waters. Section 404 of the Clean Water Act requires that anyone interested in placing<br />
dredged or fill material into waters of the United States must first obtain a permit from the<br />
Corps. Section 10 of the Rivers and Harbors Act of 1899 requires approval prior to the<br />
accomplishment of any work in or over navigable waters of the United States, or which affects<br />
the course, location, condition, or capacity of such waters. The law applies to any dredging or<br />
disposal of dredged materials, excavation, filling, rechannelization, or any other modification of<br />
a navigable water of the United States, and applies to all structures large or small. The<br />
initiation of a Section 404 permit process triggers a Section 401 water quality certification from<br />
DOH.<br />
Chapter 13-190, HAR, “Dams and Reservoirs”, is administered by DLNR. These rules govern the<br />
design, construction, operation, maintenance, enlargement, alteration, repair and removal of<br />
74<br />
Wai‘ula‘ula Watershed Management Plan MK<strong>SWCD</strong>
dams in the State. Written approval from DLNR of the construction <strong>plan</strong>s is required for any<br />
construction, enlargement, repair or alteration project. Owners are required to provide for<br />
adequate and timely maintenance, operation, and inspection of their dams and reservoirs to<br />
insure public safety. DLNR is required to inspect all dams and reservoirs at least every five<br />
years.<br />
2.2.9.10 Water Quality Protection<br />
Chapter 342D, HRS, “Water Pollution,” prohibits discharge of any pollutant into State waters. It<br />
allows DOH to institute a civil action for injunctive relief to prevent violation of State water<br />
quality standards. Under the statute, DOH may also request the court to order nonpoint source<br />
polluters to implement required <strong>management</strong> measures.<br />
DOH establishes and enforces the State water quality standards contained in Chapter 11-54,<br />
HAR. All inland fresh waters are classified based on their ecological characteristics and other<br />
natural criteria as flowing waters (e.g., streams), standing waters (e.g., lakes and reservoirs),<br />
and wetlands. These waters are further classified for the purposes of applying water quality<br />
standards and selecting appropriate quality parameters and uses to be protected in these<br />
waters.<br />
Three stream classifications can be found in the Wai‘ula‘ula <strong>watershed</strong>. Streams within the<br />
Pu‘u o ‘Umi Natural Area Reserve are Class 1(a). Streams within the Conservation District but<br />
outside of Pu‘u o ‘Umi NAR are Class 1(b). All other areas of the <strong>watershed</strong> are Class 2. Note<br />
that a single stream can have different classifications in different reaches.<br />
Class 1 inland waters are to remain in their natural state as nearly as possible with an absolute<br />
minimum of pollution from any human-caused source. Waste discharge into these waters is<br />
prohibited. The uses to be protected in class 1(a) waters are scientific and educational<br />
purposes, protection of native breeding stock, baseline references from which human-caused<br />
changes can be measured, compatible recreation, aesthetic enjoyment, and other nondegrading<br />
uses. The additional uses to be protected in class 1(b) waters are domestic water<br />
supplies and food processing. Class 2 inland waters are to be protected for recreational<br />
purposes, the support and propagation of aquatic life, agricultural and industrial water supplies,<br />
shipping and navigation. Class 2 waters shall not act as receiving waters for any discharge that<br />
has not received the best degree of treatment or control.<br />
Hawai‘i also has water quality standards for marine waters. The receiving marine waters<br />
immediately offshore of the Wai‘ula‘ula <strong>watershed</strong> are classified as AA (south of Wai‘ula‘ula<br />
Point) and A (north of Wai‘ula‘ula Point). The outlet of Wai‘ula‘ula Stream is immediately south<br />
of Wai‘ula‘ula Point, so the receiving waters at the stream outlet are classified class AA. The<br />
objective of “class AA, marine waters” is that these waters remain in their natural pristine state<br />
as nearly as possible with an absolute minimum of pollution or alteration of water quality from<br />
any human-caused source or actions. To the extent practical, the wilderness character of class<br />
AA waters shall be protected. The objective of “class A, marine waters” is that their use for<br />
75<br />
Wai‘ula‘ula Watershed Management Plan MK<strong>SWCD</strong>
ecreational purposes and aesthetic enjoyment be protected. Any other use shall be permitted<br />
as long as it is compatible with the protection and propagation of fish, shellfish, and wildlife,<br />
and with recreation in and on these waters. These waters shall not act as receiving waters for<br />
any discharge which has not received the best degree of treatment or control compatible with<br />
the criteria established for this class.<br />
2.2.9.11 Hunting in the Conservation District<br />
Bird and mammal hunting is permitted by persons with valid Hawai‘i hunting licenses under<br />
Chapter 183D, HRS, in designated public hunting areas following guidelines set forth in Chapter<br />
122, HAR, Exhibits 1 and 2, and Chapter 123, HAR, Exhibits 11 and 12. Public hunting areas<br />
within the Wai‘ula‘ula <strong>watershed</strong> include Units K (Pu‘u o ‘Umi Natural Area Reserve) and D<br />
(Kohala Watershed Forest Reserve). Hunting for wild pigs, wild sheep and wild goats in Unit K is<br />
permitted year-round on a daily basis, while hunting in Unit D is limited to weekends and State<br />
holidays. Bird hunting is permitted on public lands during designated hunting seasons.<br />
2.2.9.12 Conservation Lands and Nearshore Waters<br />
DLNR manages and regulates all lands set apart as forest reserves under Chapter 13-104, HAR.<br />
Under Chapter 13-209, HAR, it is also responsible for the <strong>management</strong> of the State’s Natural<br />
Area Reserve System (NARS) to ensure preservation of specific land and water areas which<br />
support communities of natural flora and fauna. Chapter 195, HRS, establishes a Natural Area<br />
Partnership program to provide state funds to help match private funds for the <strong>management</strong> of<br />
private lands that are dedicated to conservation. Chapter 173A, HRS, enables the State to<br />
acquire lands of exceptional value due to the presence of habitats for threatened or<br />
endangered species of flora, fauna, or aquatic resources. Chapter 195D, HRS, authorizes DLNR<br />
to acquire habitat for endangered species restoration. Chapter 198, HRS, authorizes DLNR to<br />
acquire conservation easements to preserve natural lands and waters.<br />
Chapter 205A, HRS, defines the shoreline as “the upper reaches of the wash of the waves, other<br />
than storm and seismic waves, at high tide during the season of the year in which the highest<br />
wash of the waves occurs, usually evidenced by the edge of the vegetation growth, or the<br />
upper limit of debris left by the wash of the waves.” The area seaward or makai of the<br />
shoreline is part of the Conservation District and is under State jurisdiction. The coastal area<br />
landward or mauka of the shoreline is managed by the counties as part of the Shoreline<br />
Management Area (SMA) established under Chapter 205A, HRS and described above.<br />
DLNR manages the area seaward of the shoreline. Pursuant to Chapter 183, HRS, DLNR is<br />
responsible for establishing the procedures and certifying where the shoreline is located, and<br />
for promulgating and administering the Conservation District use regulations. All activities<br />
proposed within the Conservation District, whether mauka or makai, require a CDUP, for which<br />
there is an application and review process. The Board of Land and Natural Resources can<br />
approve, deny, or approve with conditions proposed uses of the Conservation District.<br />
76<br />
Wai‘ula‘ula Watershed Management Plan MK<strong>SWCD</strong>
2.2.9.13 Boat Operation<br />
Rules regulating the operation of vessels in ocean waters and navigable streams, administered<br />
by DLNR’s Division of Boating and Ocean Recreation (DOBOR) restrict vessel speeds in Ocean<br />
Recreation Management Areas, along shorelines, and near other vessels, docks, and<br />
swimmers/divers. Chapter 13-244, HAR, specifically states that “no person shall operate a<br />
vessel at a rate of speed greater than is reasonable having regard to conditions and<br />
circumstances.”<br />
Chapter 13-232, HAR, “Sanitation and Fire Safety,” administered by DOBOR, prohibits dumping,<br />
discharging, or pumping of oil, spirits, gasoline, distillate, any petroleum product, or any other<br />
flammable material into the waters of a small boat harbor or designated offshore mooring area.<br />
Chapter 13-235, HAR, “Offshore Mooring Rules and Areas,” states that no person shall anchor,<br />
moor or stay aboard a vessel except those equipped with an approved marine sanitation device<br />
(MSD) in proper working condition, or those vessels exempt from MSD requirements in<br />
accordance with USCG regulations.<br />
2.2.10 Future Land Use Considerations<br />
The Hawai‘i County's General Plan Land Use Pattern Allocation Guide (LUPAG) maps include<br />
significant urban expansion areas on both the coast and in Waimea town (see Figure 16).<br />
Proposed urban expansion areas allow for a mix of high density, medium density, low density,<br />
industrial, industrial-commercial and/or open designation in areas where new settlements may<br />
be desirable, but where the specific settlement pattern and mix of uses have not yet been<br />
determined. In the South Kohala District, this includes 12,264 acres or 42% of the designated<br />
urban expansion area for the entire island. Of this, there are several hundred acres of urban<br />
expansion land on the south side of Kawaihae Road just west of Waimea Town along Waikoloa<br />
Stream. There are also several hundred acres of rural land shown along the south side of<br />
Kawaihae Road, which would encourage low density residential development there.<br />
Parker Ranch also has considerable development slated as part of its Parker Ranch 2020 Plan<br />
(see Figure 18). The <strong>plan</strong> calls for 750 new homes. It proposes to rezone 37.66 acres to<br />
multiple-family residential. In addition, commercial lands within Waimea Town were increased<br />
by about 104 acres in 1992 as part of the implementation of the Parker 2020 Master Plan.<br />
Luala‘i at Parker Ranch, for which Phase 1 was completed in 2002, will eventually have 322<br />
residential units, parks and open space on 75 acres.<br />
DHHL’s Lālāmilo Residential project proposes 442 houses on 160 acres adjacent to both<br />
Waikoloa and <strong>Kea</strong>nu‘i‘omanō streams (Figure 23). The development will also include a<br />
community center, parks, general agriculture, preservation area (19.1 acres), and open space<br />
areas (44.5 acres). Phase 1, currently under development, includes 34 in-fill house lots. The<br />
remaining <strong>plan</strong>ned house lots will be built in subsequent phases.<br />
77<br />
Wai‘ula‘ula Watershed Management Plan MK<strong>SWCD</strong>
<strong>Mauna</strong> <strong>Kea</strong> Resort is tentatively <strong>plan</strong>ning to develop a golf course and 135 large acreage<br />
residential lots with associated infrastructure and commercial use on its ‘Ōuli 2 property near<br />
the bottom of the <strong>watershed</strong>. Waimea Parkside is a 40-lot subdivision on 9.18 acres in Waimea<br />
town across Lindsey Road from the park. This development is currently under construction.<br />
Finally, the South Kohala Community Development Plan recommends expanding the Lālāmilo<br />
Farm lots by over 100 acres and constructing several connector roads around Waimea.<br />
All these projects could have implications for polluted runoff in the <strong>watershed</strong>. The<br />
proliferation of impervious surfaces and the greater number of people living in close proximity<br />
to the <strong>watershed</strong>’s streams will likely increase the generation of urban pollutants. With much<br />
of this additional growth occurring adjacent to the streams, there is a greater likelihood of the<br />
urban pollutants reaching the surface waters.<br />
78<br />
Wai‘ula‘ula Watershed Management Plan MK<strong>SWCD</strong>
79<br />
Figure 23: DHHL Lālāmilo Residential Project<br />
Wai‘ula‘ula Watershed Management Plan MK<strong>SWCD</strong>
Chapter 3: Water Quality Conditions<br />
3.1 Ex<strong>plan</strong>ation and Meaning of Water Quality Parameters<br />
Measurements of stream water quality has focused on concentrations of nitrate (NO 3 ) ammonia<br />
(NH 4 ), total dissolved nitrogen (TDN), total nitrogen (TN, includes all forms of nitrogen, including<br />
dissolved and solid components), phosphate (PO 4 ), total phosphorus (TP, includes all forms of<br />
phosphorus, including both dissolved and solid components), and suspended sediment (Total<br />
Suspended Solids or TSS). Nitrate measurements are actually measurements of the sum of<br />
nitrate plus nitrite (NO 3 +NO 2 ); however, the amount of nitrite is negligible. In reporting the<br />
concentrations (weight of pollutant per liter of water), the notation NH 4 as N or NH 4 -N means<br />
that only the weight of nitrogen (N) is included; the weight of other atoms such as hydrogen or<br />
oxygen is not included.<br />
Water quality monitoring in the Wai‘ula‘ula <strong>watershed</strong> has focused on nitrogen (which comes in<br />
many forms) and phosphorus (which comes in several forms) because they encourage growth<br />
of algae. Too much algae makes the water cloudy and will eventually cause oxygen levels to<br />
decline. High levels of oxygen are needed for a health ecosystem.<br />
In addition to the above, marine water quality measurements include dissolved silica and<br />
chlorophyll-a. The silica is not a pollutant. It is found in groundwater, so higher levels indicate<br />
greater groundwater influence. High levels of chlorophyll-a indicate that excessive levels of<br />
algae are growing in the water.<br />
3.2 Availability of Data<br />
The following data are available:<br />
1) Older water quality data (1971-1989) collected by the U.S. Geological Survey (USGS) in<br />
the headwaters of Waikoloa Stream (Marine Dam gaging station 16758000).<br />
2) Recent stream water quality data (2007-2009) collected by the MK<strong>SWCD</strong> at four<br />
locations with autosamplers. Grab sample data are available for several additional<br />
locations.<br />
3) Water quality data for runoff from parking lots and roads.<br />
4) Discharge data at most locations where stream water quality data were collected.<br />
Discharge data were used to calculate discharge-weighted average concentrations and<br />
to calculate nutrient loads.<br />
5) Marine water quality data (2006-2008) collected by the Hawai‘i Department of Health<br />
(DOH).<br />
80<br />
Wai‘ula‘ula Watershed Management Plan MK<strong>SWCD</strong>
6) Biological surveys.<br />
7) Trace metals in stream and roadside sediment.<br />
Older water quality data: Water quality data were collected at the Marine Dam gage station<br />
(16758000) between 1971 and 1989. These data were collected by the USGS Water Resources<br />
Branch. Along with physical parameters like temperature and discharge, nutrients and trace<br />
element concentrations were measured on fourteen occasions. Nutrient concentrations were<br />
all very low (near detection limits) except for orthophosphate which showed two elevated<br />
readings.<br />
New water quality data: Autosamplers were used to collect stormwater runoff that was<br />
analyzed for nutrient and suspended sediment concentrations. The autosamplers were located<br />
on Waikoloa stream at the Marine Dam (“upper” site), Waikoloa stream downstream of<br />
Waimea town (“middle” or “Sandalwood” site), and Wai‘ula‘ula stream just upstream of the<br />
ocean entry (“lowest” or “ocean entry” site) (Figure 24). Data represent eleven storm events<br />
that occurred between November 2007 and February 2009. For one of these storms,<br />
autosampler data was also collected from Makeāhua stream just upstream at of its entry into<br />
Pelekane Bay (“Pelekane” site). The Makeāhua/Pelekane <strong>watershed</strong> is similar to the middle<br />
and lower sections of the Wai‘ula‘ula <strong>watershed</strong>, but it is denuded by overgrazing and fire. It<br />
represents the worst case scenario that we are trying to prevent in the Wai‘ula‘ula <strong>watershed</strong>.<br />
Grab samples of urban storm water runoff were collected on four occasions from sites in<br />
Waimea town.<br />
The USGS makes routine measurements of streamflow (discharge) at the Marine Dam site. At<br />
the other autosampler sites, approximate estimates of stream discharge have been made on<br />
the basis of water level measurements. Measuring flow data at the same time that nutrient<br />
concentrations are measured permits us to calculate nutrient fluxes. Flux can be viewed as the<br />
amount of substance passing a point on the stream in a given period of time. Multiplying our<br />
concentrations (mass / volume) by flow rate (in volume / time) gives flux (mass / time).<br />
Drainage basins contributing flow to the four sampling sites are very different. The forested<br />
Marine Dam basin (865 ac.) is comprised almost exclusively of protected headwater bog. The<br />
Sandalwood basin (2,037 ac.) drains much of Waimea Town and includes the Marine Dam<br />
basin. As discussed elsewhere in this report, the Waikoloa stream is affected by diversions.<br />
Wai‘ula‘ula and Pelekane basins (associated with the two autosamplers near sea-level) cover<br />
the entire <strong>watershed</strong>s and contain a variety of land covers and land uses. Both basins include a<br />
large amount of ranch lands. Table 2 shows percent land cover of each of the four drainage<br />
basins. Land cover was derived from 2001 NOAA Coastal Change Analysis Program (C-CAP)<br />
data.<br />
81<br />
Wai‘ula‘ula Watershed Management Plan MK<strong>SWCD</strong>
Figure 24: Sample Locations<br />
Table 2: Land Cover in Four Drainage Basins<br />
Waiulaula<br />
above Marine<br />
Dam<br />
Waiulaula<br />
above<br />
Sandalwood<br />
Waiulaula<br />
at Ocean<br />
Pelekane<br />
High intensity development 5% 1% 0%<br />
Low intensity development 10% 5% 1%<br />
Cultivated 1% 1% 0%<br />
Grass 2% 42% 58% 72%<br />
Evergreen Forest 98% 36% 26% 5%<br />
Scrub/Shrub trace 5% 5% 6%<br />
Bare 0% 4% 16%<br />
Water 1% trace 0%<br />
SUM 100% 100% 100% 100%<br />
82<br />
Wai‘ula‘ula Watershed Management Plan MK<strong>SWCD</strong>
3.3 Water Quality Standards<br />
In the state of Hawai‘i, minimum water quality standards (Chapter 11-54, HAR) are established<br />
by the Department of Health under the provisions of the Clean Water Act. These standards are<br />
intended to protect designated uses of streams and marine waters. (See Section 2.2.9.10 in the<br />
previous chapter for a discussion of classification and designated uses of waters within the<br />
Wai‘ula‘ula <strong>watershed</strong> and immediately offshore.)<br />
Nutrient and sediment standards applicable to all Wai‘ula‘ula <strong>watershed</strong> streams are listed in<br />
Table 3. There are several additional standards:<br />
• pH should not exceed 8.0, be lower than 5.5, or deviate more than 0.5 units from<br />
ambient conditions.<br />
• Dissolved oxygen concentrations should not be less than 80% of saturation.<br />
• Specific conductance should not be more than 300 umho/cm. [Note: umho/cm is a unit<br />
of electrical resistance. Very pure water does not conduct electricity as well as salty<br />
water.]<br />
• Temperature should not vary more than 1 degree C from ambient conditions.<br />
Most of the standards are based on the geometric mean of all samples taken within a relatively<br />
recent period (say five years). If there are n measurements on a given stream, the geometric<br />
mean is equal to the n th root of all the measurements multiplied together. For example, if there<br />
are three measurements with values of 2, 3, and 20, then the geometric mean is equal to<br />
(2*3*20) 1/3 . Compared to an arithmetic average, the geometric mean is less influenced by<br />
occasional very large values. There are certain protocols that are used to officially determine if<br />
a water body meets standards. These procedures include having a sufficiently large number of<br />
recent samples, more than one sampling site on a stream, and using strict quality assurance<br />
protocols including a certified laboratory. The water quality measurements undertaken as part<br />
of this <strong>watershed</strong> assessment were not intended to be used for official determination of<br />
whether water bodies of interest meet regulatory standards. Thus, although measurements<br />
are compared to standards, this does not constitute official evaluation of whether the water<br />
bodies are impaired.<br />
83<br />
Wai‘ula‘ula Watershed Management Plan MK<strong>SWCD</strong>
Parameter<br />
Total Nitrogen<br />
(mg /L)<br />
Nitrate + Nitrite<br />
(mg/L-N)<br />
Total Phosphorous<br />
(mg/L-P)<br />
Total Suspended Solids<br />
(mg/L)<br />
Table 3: Water Quality Criteria for Streams<br />
Geometric mean not to<br />
exceed the given value<br />
0.250*<br />
0.180**<br />
0.070*<br />
0.030**<br />
0.050*<br />
0.030**<br />
20.0*<br />
10.0**<br />
Turbidity (N.T.U.) 5.0*<br />
2.0**<br />
Not to exceed the given<br />
value more than ten<br />
percent of the time<br />
0.520*<br />
0.380**<br />
0.180*<br />
0.090**<br />
0.100*<br />
0.060**<br />
50.0*<br />
30.0**<br />
15.0*<br />
5.5**<br />
*standard applicable during rainy (wet) season of November 1 through April 30<br />
**standard applicable during dry season of May 1 through October 31<br />
Not to exceed the given<br />
value more than two<br />
percent of the time<br />
0.800*<br />
0.600**<br />
0.300*<br />
0.170**<br />
0.150*<br />
0.080**<br />
80.0*<br />
55.0**<br />
25.0*<br />
10.0**<br />
Table 4 lists nutrient and sediment standards applicable to the marine waters immediately<br />
offshore of the <strong>watershed</strong> (both A and AA waters). There are several additional standards:<br />
• pH should not deviate more than 0.5 units from 8.1, unless affected by freshwater<br />
discharges, in which case pH must not be lower than 7.0.<br />
• Dissolved oxygen concentrations should not be less than 75% of saturation.<br />
• Salinity should not vary more than 10% from what is expected for oceanographic<br />
conditions, seasonal variations, or hydrologic inputs.<br />
• Temperature should not vary more than 1 degree C from ambient conditions.<br />
84<br />
Wai‘ula‘ula Watershed Management Plan MK<strong>SWCD</strong>
Table 4: Open Coastal Waters Water Quality Criteria<br />
Parameter<br />
Geometric mean not to exceed this value<br />
Total Dissolved Nitrogen*<br />
Ammonia Nitrogen (NH 4 )<br />
Nitrate + Nitrite Nitrogen*<br />
Total Dissolved Phosphorous*<br />
Phosphate*<br />
Chlorophyll a<br />
Turbidity<br />
0.10 mg/L<br />
0.0025 mg/L-N<br />
0.0045 mg/L-N<br />
0.0125 mg/L<br />
0.005 mg/L<br />
0.30 ug/L<br />
0.10 N.T.U.<br />
If salinity is less than or equal to 32 parts per thousand, this<br />
parameter shall be related to salinity using a regression<br />
equation specified in HAR 11-54-6, pages 47-48.<br />
Chapter 11-54, HAR also provides freshwater and marine standards relating to toxic substances<br />
(pesticides, heavy metals, organic solvents) and bottom sediments. These are not believed to<br />
be a problem for the Wai‘ula‘ula <strong>watershed</strong>. It is unlikely that bottom sediments in Pelekane<br />
Bay meet standards, but that is outside the scope of this report.<br />
3.4 Stream Data (nutrient and sediment concentrations)<br />
3.4.1 Observed Concentrations<br />
Autosamplers were set to collect water samples whenever the water level in the stream rose<br />
rapidly and then every 30-60 minutes thereafter. For each storm events, 24 one-liter samples<br />
were collected over a 12 to 20 hour period. To reduce costs, only 8-10 of these bottles were<br />
sent to the laboratory for analysis. Typically, bottles were selected based on turbidity and with<br />
a view towards being able to characterize changes over time. For example, early in the storm,<br />
when turbidity changed rapidly, every bottle would be selected. Late in the storm, when<br />
turbidity changed slowly, every third bottle might be selected. Discharge-weighted average<br />
concentrations were then calculated for each runoff event and autosampler location.<br />
6<br />
Discharge-weighted averages are also known as the “event mean concentration” or EMC. For<br />
6 The following procedure was used to obtain the EMC average. For each sample, the concentration<br />
(weight of pollutant per unit volume) was multiplied by the streamflow rate (volume of water per<br />
unit time) times the length of time represented by that sample (typically the time between<br />
successive samples). The resulting number was summed across samples, and then divided by the<br />
total volume of flow for that event.<br />
85<br />
Wai‘ula‘ula Watershed Management Plan MK<strong>SWCD</strong>
each runoff event, the EMC is the total load of pollutant (amount measured as a weight)<br />
divided by the flow volume. Streamflow data are needed to make EMC calculations.<br />
Streamflow data for the Marine Dam were obtained from the USGS. Flow data at the other<br />
autosampler sites were obtained from measurements of water depth (which is recorded<br />
continuously by the autosampler) and the Manning equation. Streamflow data from the<br />
Sandalwood, Wai‘ula‘ula, and Pelekane sites should be considered approximate.<br />
TSS and TP increase when stream discharge increases (correlation coefficient of 0.81 for TSS<br />
and 0.78 for TP).<br />
There are several factors that should be taken into consideration when comparing nutrient<br />
concentrations and fluxes at the upper site (above town) and the Sandalwood site (below<br />
town). First, water is diverted from Waikoloa stream immediately downstream of the upper<br />
site. Normally, the stream is completely impounded by the dam and all water is diverted into<br />
the Department of Water Supply intake. During a storm event, the water will rise and<br />
eventually overtop the dam. Only after the dam is overtopped will water flow down the<br />
channel towards Waimea. Second, it is likely that Waikoloa is a losing stream between the<br />
upper autosampler and Waimea Town. This means that the streambed leaks and some of the<br />
streamwater (along with whatever is dissolved in it) filters into the ground and does not make it<br />
to the Sandalwood autosampler site. The exact amount that is lost is unknown. It is<br />
noteworthy, however, that for the three events with data (12/6/07, 12/16/07 and 1/26/08), the<br />
stormflow volume at the Sandalwood site is only 3% more than the streamflow volume at the<br />
upper gage. Even taking into account the fact that the streamflow data at the Sandalwood site<br />
are not very accurate, it is clear that much of the runoff from the upper forested part of<br />
Waikoloa stream is not making it down to Waimea Town. This issue is revisited in the<br />
Monitoring chapter (Chapter 6).<br />
3.4.2 Are Streams Polluted?<br />
Measured sediment and nutrient concentrations were compared to water quality standards in<br />
order to evaluate whether or not streams are polluted (Tables 5 and 6).<br />
At Marine Dam (where Waikoloa stream exits the high-elevation forest), the stream has<br />
relatively low concentrations of nitrate, ammonia, and orthophosphate (PO 4 ). The geometric<br />
mean of measured nitrate concentration was only 23% of the water quality standard, and mean<br />
PO 4 was only 9% of the standard. There is no standard for ammonia. The geometric mean of<br />
total nitrogen concentration (sum of particulate and dissolved forms) was 17% higher than the<br />
standard. The geometric mean of total phosphorus (TP) concentration was 30% lower than the<br />
standard. Mean suspended solids (sediment concentration) were only 50% of the standard.<br />
Further down on the same stream, concentrations were measured at the Sandalwood site,<br />
which is at the downstream edge of Waimea Town. In comparison to the Marine Dam site,<br />
ammonia concentrations doubled, total phosphorus concentrations (TP) more than doubled,<br />
and nitrate concentrations quadrupled. The average nitrate concentration just barely exceeded<br />
86<br />
Wai‘ula‘ula Watershed Management Plan MK<strong>SWCD</strong>
the water quality standard. The TP concentration was nearly twice the allowable amount.<br />
Sediment concentrations at Sandalwood were higher than at the Marine Dam. The Sandalwood<br />
sediment concentrations were below the standard, although just barely.<br />
Much further downstream, an autosampler was installed on the Wai‘ula‘ula Stream a short<br />
distance above where it enters the ocean. At this location, sediment, ammonia, nitrate, and<br />
total phosphorus concentrations were low and within acceptable limits. Nitrate was less than<br />
half of what is allowed; sediment and total phosphorus were about 30% lower than what is<br />
allowed. Total nitrogen was high, however, with measured concentrations nearly twice what is<br />
allowed.<br />
Only one runoff event was captured by the Pelekane autosampler, which is located several<br />
hundred yards above where the stream enters the ocean. Sediment and nutrient<br />
concentrations were incredibly high. The sediment concentration was 150 times greater than<br />
what is allowed, and the total nitrogen concentration was 240 times greater than what is<br />
allowed. The corresponding figures for nitrate and total phosphorus are 11 times and 40 times<br />
greater, respectively.<br />
At all sites, the majority of phosphorus (>86%) was present as particulate matter, with only a<br />
small amount (
Table 5: Nutrient and Sediment Concentrations in Samples Collected by Autosamplers. Values are discharge-weighted (EMC).<br />
88<br />
SITE Date TSS TDN TN NO 3 +NO 2 NH 4 PO 4 TP Runoff<br />
mg/l mg/l - N mg/l - N mg/l – N mg/l-N mg/l-P mg/l-P m 3<br />
Marine Dam (forest) 1-Nov-07 9 0.233 0.343 0.020 0.019 0.005 0.047 25,000<br />
Marine Dam (forest) 6-Nov-07 17 0.223 0.399 0.010 < 0.014 0.007 0.056 25,000<br />
Marine Dam (forest) 14-Nov-07 5 0.077 0.140 0.015 0.0113 0.005 0.019 18,000<br />
Marine Dam (forest) 3-Dec-07 8 0.191 0.300 0.015 0.0169 0.004 0.025 42,000<br />
Marine Dam (forest) 5-Dec-07 24 0.230 0.373 0.012 0.011 0.0026 0.063 140,000<br />
Marine Dam (forest) 16-Dec-07 32 0.148 0.372 0.016 0.023 0.004 0.120 210,000<br />
Marine Dam (forest) 26-Jan-08 2 0.187 0.229 0.025 0.021 0.004 0.007 23,000<br />
geometric mean 10 0.174 0.292 0.016 0.014 0.0043 0.035<br />
Sandalwood 22-Nov-07 49 0.251 0.652 0.121 0.017 0.015 0.164 100,000<br />
Sandalwood * 4-Dec-07 8 0.348 0.505 0.110 0.152 0.026 0.067 n/a<br />
Sandalwood 6-Dec-07 37 0.303 0.576 0.080 0.017 0.012 0.141 167,000<br />
Sandalwood 16-Dec-07 42 0.188 0.487 0.033 0.014 0.007 0.194 203,000<br />
Sandalwood 26-Jan-08 3 0.215 0.275 0.064 0.033 0.010 0.019 15,000<br />
geometric mean 18 0.255 0.480 0.074 0.029 0.013 0.089<br />
Coastal Outlet 17-Jan-09 21 0.442 0.826 0.191 0.025 < 0.003 0.046 48,000<br />
Coastal Outlet** 24-Jan-09 8 0.225 0.339 0.005 < 0.014 < 0.003 0.035 40,000<br />
Coastal Outlet 3-Feb-09 12 0.244 0.415 0.024 0.029 0.004 0.027 132,000<br />
geometric mean 13 0.290 0.488 0.028 0.017 0.002 0.035<br />
Pelekane 6-Dec-07 3045 1.93 59.6 0.77 0.22 0.046 1.98 69,000<br />
Water quality<br />
standard*** 20 n/a .250 .070 n/a n/a .050 n/a<br />
* arithmetic average of 2 grab samples ** arithmetic average of 6 autosamples *** Wet season geometric mean should not exceed.<br />
TN values in italics are estimated based on TSS and TDN concentrations.<br />
Wai‘ula‘ula Watershed Management Plan MK<strong>SWCD</strong>
Table 6 summarizes whether or not sediment and nutrient concentrations are high enough to<br />
impair water quality. This interpretation is based on comparing the measured value (geometric<br />
mean of measurements from several runoff events) to the water quality standards. There were<br />
7 runoff events measured at Marine Dam, 5 events at Sandalwood, 3 events at the <strong>watershed</strong><br />
outlet, and 1 event at Pelekane. In this table “impairment” is meant in a general sense, and not<br />
in the sense of a formal assessment by the Hawai‘i Department of Health.<br />
Table 6: Summary of Stream Impairments for Nutrient and Sediment Based on Monitoring Data<br />
Site TSS (sediment) Total Nitrogen Nitrate Total<br />
Phosphorus<br />
Marine Dam<br />
(above Waimea)<br />
Not impaired<br />
(measured value<br />
below the<br />
standard)<br />
Could be<br />
impaired<br />
(measured value<br />
near the standard)<br />
Not impaired<br />
(measured value<br />
well below<br />
standard)<br />
Probably not<br />
impaired<br />
(measured value<br />
below standard,<br />
but not by much)<br />
Sandalwood<br />
(below Waimea)<br />
Could be<br />
impaired<br />
(measured value<br />
near the standard)<br />
Impaired<br />
(measured value<br />
almost double the<br />
standard)<br />
Could be<br />
impaired<br />
(measured values<br />
near the standard)<br />
Impaired<br />
(measured value<br />
almost double the<br />
standard)<br />
Watershed<br />
outlet<br />
Not impaired<br />
(measured value<br />
below the<br />
standard)<br />
Impaired<br />
(measured value<br />
almost double the<br />
standard)<br />
Not impaired<br />
(measured values<br />
below standard)<br />
Probably not<br />
impaired<br />
(measured value<br />
below standard,<br />
but not by much)<br />
Pelekane<br />
Very polluted<br />
Very polluted<br />
Very polluted<br />
Very polluted<br />
(Exceeds standard<br />
by 2 orders of<br />
magnitude)<br />
Exceeds standard<br />
by 2 orders of<br />
magnitude<br />
Exceeds standard<br />
by 1 order of<br />
magnitude<br />
Exceeds standard<br />
by 2 orders of<br />
magnitude<br />
89<br />
Wai‘ula‘ula Watershed Management Plan MK<strong>SWCD</strong>
3.5 Urban Runoff (nutrient and sediment concentrations)<br />
3.5.1 Observed Concentrations<br />
Nine samples of urban storm runoff were collected by taking grab samples of flowing water in<br />
parking lots, storm water running off of roads, or from pipes that collect parking lot/road runoff<br />
(Table 7). All sites were located in Waimea, and samples were collected between November<br />
2008 and April 2009.<br />
3.5.2 How Polluted is Waimea’s Urban Runoff?<br />
Based on a limited amount of data, it appears likely that runoff from high-use paved areas<br />
exceeds water quality criteria for sediment (by a factor of five), total phosphorus (by a factor of<br />
four), total nitrogen (by a factor of three) and nitrate (measured values are only slightly greater<br />
than the standard). These results are not surprising as urban storm runoff is usually high in<br />
sediment and nutrients. The urban runoff concentrations can also be compared to<br />
concentrations measured in Waikoloa Stream immediately downstream of Waimea (at the<br />
middle or Sandalwood autosampler). Compared to the stream, the urban runoff was more<br />
enriched in sediment (by a factor of six), orthophosphate (by a factor of 5), total phosphorus<br />
(by a factor of 2.3), ammonium (by a factor of 1.7), and total nitrogen (by a factor of 1.7). The<br />
urban and stream samples were taken on different days, so results could very well be different<br />
if stream and urban samples were taken on the same day, or if more urban samples were<br />
collected at more times in more locations. These limitations notwithstanding, the data that are<br />
available show that runoff from paved urban areas has high concentrations of sediment and<br />
nutrients, particularly particulate nutrients. Further, it appears that the runoff from high-use<br />
paved areas is more polluted than the water in the stream.<br />
Studies on Oahu and on the mainland have shown that urban runoff often contains heavy<br />
metals and occasionally pesticides, but similar measurements of Waimea’s stormwater have<br />
not been made. Measurements have been made in Waimea’s roadside sediment, however.<br />
These data are discussed in section 3.8.<br />
3.5.3 First Flush<br />
“First flush” occurs when the initial runoff washes pollutants off roads and fields, delivering a<br />
majority of pollutants in the early part of a runoff event (when water levels are still rising). To<br />
see if this was occurring in the Waikoloa Stream, autosampler data from the Marine Dam<br />
<strong>watershed</strong> (forested higher-elevation area) and Sandalwood <strong>watershed</strong> (includes Waimea<br />
urban core) were analyzed using the dimensionless mass-volume (MV) method. The first flush<br />
90<br />
Wai‘ula‘ula Watershed Management Plan MK<strong>SWCD</strong>
Table 7: Grab Samples of Urban Storm Runoff Collected from Waimea Parking Lots and Roads<br />
Location<br />
Date<br />
TSS<br />
mg/L<br />
TDN<br />
mg/L-<br />
N<br />
TN*<br />
mg/L-N<br />
NO 3 +<br />
NO 2<br />
mg/L-N<br />
NH 4<br />
mg/L-N<br />
PO 4<br />
mg/L-P<br />
TP .<br />
mg/L-P<br />
KTA parking lot white pipe 11/18/08 32 0.14 0.30 0.008
phenomenon was not seen in the majority of storms. However, a first flush of total suspended<br />
solids (TSS) and ammonia occurred during the 11/22/07 storm and a first flush of NH 4 occurred<br />
during the 11/14/07 storm. In these cases, 25% to 50% of the pollutants were seen in the first<br />
20% of stream flow.<br />
Some storm events have data for both the Marine Dam and Sandalwood sites. For these<br />
storms, nitrogen pollutants were delivered earlier (relative to the onset of flooding) at the<br />
Sandalwood site compared to the upper site in the forest. This could indicate that in Waimea<br />
there is nitrogen on the surface of the ground (for example, fertilizer or animal feces) that is<br />
quickly washed off at the beginning of the storm. This interpretation is uncertain, however,<br />
because results were mixed for TP and TSS.<br />
3.5.4 Variations in the form of nitrogen<br />
Nitrogen can occur in several different forms. The three basic categories are dissolved organic<br />
nitrogen, dissolved inorganic nitrogen, and particulate nitrogen. Dissolved inorganic nitrogen<br />
can be present as nitrate (most stable form), nitrite (rarely present), ammonia (unstable form<br />
found in sewage and fertilizer). Dissolved organic nitrogen consists of carbon-rich compounds<br />
of biological origin. Pound for pound, the common forms of inorganic nitrogen (nitrate and<br />
ammonia) have a greater influence on ecosystems than an equivalent amount of organic<br />
nitrogen. There is more organic nitrogen than inorganic nitrogen, however. Nitrogen readily<br />
changes from one form to another and can be transformed to a gas through a process called<br />
denitrification. Denitrification typically occurs when there is little oxygen present and results in<br />
loss of nitrogen to the atmosphere. High concentrations of ammonia are stressful to aquatic<br />
life. Notably, ammonia concentrations in Kawaihae Bay at Wai‘ula‘ula exceed marine water<br />
quality standards. (There are no ammonia limits for streams.) In the Bay, there is more<br />
ammonia than nitrate, whereas in the stream there is more nitrate than ammonia. When<br />
oxygen is present, ammonia tends to be converted to nitrate. The higher proportion of<br />
ammonia in Kawaihae Bay at Wai‘ula‘ula suggests that an ammonia source could be nearby.<br />
In the stream, different sites have different concentrations of the various types of nitrogen<br />
(Table 8). Compared to the other sites, the forest site has the lowest concentration of nitrate<br />
and ammonia. The <strong>watershed</strong> outlet has the highest concentration of dissolved organic<br />
nitrogen. There are also differences in the proportions of the three kinds of dissolved nitrogen.<br />
In comparison to the other sites, the urban site has the greatest proportion of nitrate and<br />
ammonia (as a percentage of total dissolved nitrogen).<br />
92<br />
Wai‘ula‘ula Watershed Management Plan DRAFT MK<strong>SWCD</strong>
Table 8: Concentrations of Various Forms of Dissolved Nitrogen<br />
Values are concentrations (geometric mean of all days with measurements) in units of mg/l<br />
as N. The value in parentheses is the percentage of that station’s total dissolved nitrogen.<br />
Ocean<br />
(Wai‘ula‘ula<br />
Bay)<br />
Stream at<br />
<strong>watershed</strong><br />
outlet<br />
Urban<br />
runoff<br />
Sandalwood<br />
(below<br />
Waimea)<br />
Marine Dam<br />
(edge of<br />
forest)<br />
Nitrate 0.005 (5%) 0.028 (10%) 0.10 (19%) 0.074 (29%) 0.016 (9%)<br />
Ammonia 0.007 (7%) 0.017 (6%) 0.05 (9%) 0.029 (11%) 0.014 (8%)<br />
Organic 0.088 (88%) 0.245 (84%) 0.39 (72%) 0.152 (60%) 0.144 (83%)<br />
3.6 Marine Data (nutrient, sediment, and algae concentrations)<br />
3.6.1 Observed Concentrations<br />
During the period July 2006 – April 2008, DOH made frequent measurements of water quality<br />
at a number of coastal sites. Measurements in the nearshore waters of Kawaihae Bay at<br />
Wai‘ula‘ula were taken on thirty-three separate days. Average values (geometric mean) are<br />
shown in Table 9; a similar table showing variability over time is found in the appendix.<br />
The water quality measurements included suspended sediment, several types of nutrients,<br />
dissolved silica, and chlorophyll-a. The silica is not a pollutant. It is found in groundwater, so<br />
higher levels indicate greater groundwater influence. Nutrients are substances that encourage<br />
the growth of algae. Measurements were made of two types of dissolved nutrients (ammonia<br />
and the combination of nitrate+nitrite). Total nitrogen (or total phosphorus) is a measurement<br />
of all possible forms of dissolved and solid nitrogen (or phosphorus). High levels of<br />
chlorophyll-a indicate that excessive levels of algae are growing in the water. Too much algae<br />
makes the water cloudy, blocking sunlight needed by coral. Very high levels of algae result in<br />
too little oxygen in the water.<br />
Marine algal growth could either be phosphorus-limited or nitrogen-limited. Studies that<br />
would shed light on this issue have not been conducted at Wai‘ula‘ula, but a study conducted<br />
on Oahu (Larned 1998) found that marine macroalgae in Kaneohe Bay were N limited. The<br />
ratio of dissolved inorganic nitrogen to dissolved inorganic phosphorus can shed light on<br />
nitrogen and phosphorus dynamics. No measurements of dissolved inorganic phosphorus have<br />
been made at Wai‘ula‘ula, however, presumably because there are no regulatory standards for<br />
it. The observed TN:TP ratio is 15:8, which is a typical value for coastal waters. It would be<br />
93<br />
Wai‘ula‘ula Watershed Management Plan DRAFT MK<strong>SWCD</strong>
more informative to examine the ratio of dissolved N to dissolved P, but the necessary data are<br />
not available.<br />
Table 9: Geometric Mean of Ocean Water Quality Measurements Made Near the Mouth of the<br />
Wai‘ula‘ula River and at Several Comparison Sites<br />
The water quality standards listed in the table are the ones that should not be exceeded if the salinity is<br />
> 32 parts per thousand. The TP and TN standards are for filtered samples, and it is presumed that TP<br />
and TN data are for filtered samples.<br />
TSS<br />
(mg/L)<br />
Ammonia<br />
(mg/L-N)<br />
Nitrate<br />
+ Nitrite<br />
(mg/L-N)<br />
TN<br />
(mg/L<br />
-N)<br />
TP<br />
(mg/L<br />
-P)<br />
Filtered<br />
Silica<br />
(mg/L)<br />
Chlorophyll<br />
'a' (ug/L)<br />
Kawaihae Bay at<br />
Wai‘ula‘ula<br />
(Leeward Hawai‘i) 9.26 0.007 0.005 0.10 0.014 0.26 0.62<br />
Wai‘ula‘ula water<br />
quality standard none 0.0025 0.0045 0.1 0.0125 none 0.3<br />
Pelekane Bay<br />
(Leeward Hawai‘i) 44.28 0.038 0.050 0.26 0.050 1.60 3.28<br />
Hapuna Beach<br />
(Leeward Hawai‘i) 9.59 0.004 0.060 0.15 0.019 1.45 0.36<br />
Hilo Bay<br />
(Lighthouse)<br />
(Windward Hawai‘i) 13.01 0.010 0.025 0.16 0.021 1.99 1.77<br />
Kihei (South)<br />
(Leeward Maui) 16.93 0.013 0.036 0.36 0.029 0.97 1.05<br />
Moana Beach,<br />
Waikiki<br />
(Leeward Oahu) 13.42 0.004 0.016 0.14 0.017 0.12 0.41<br />
3.6.2 Is the Ocean Polluted near the Mouth of the Wai‘ula‘ula Stream?<br />
There are two important questions about water quality in Kawaihae Bay at Wai‘ula‘ula:<br />
(1) Is the water polluted with nutrients, sediment, and algae?<br />
(2) How does water quality in Kawaihae Bay at Wai‘ula‘ula compare to water quality in<br />
other Hawaiian shorelines?<br />
Comparison of measurement against the water quality standards (Table 9) shows that the Bay<br />
has too much ammonia (concentrations are 2.8 more than what is allowed) and too much<br />
94<br />
Wai‘ula‘ula Watershed Management Plan DRAFT MK<strong>SWCD</strong>
chlorophyll (concentrations are double what is allowed). The high chlorophyll levels indicate<br />
that there is too much algae. It is likely the high ammonia levels are contributing to high excess<br />
algae. Because ammonia is rapidly converted to nitrate in the presence of oxygen, it is likely<br />
that the source of the ammonia is nearby. The measured nitrate and total nitrogen<br />
concentrations are near the standard. Total phosphorus concentrations are slightly above the<br />
standard.<br />
Water quality in Kawaihae Bay at Wai‘ula‘ula is considerably better than in nearby Pelekane Bay<br />
(Table 9). The water quality in Pelekane Bay is poor: there are high levels of sediment,<br />
ammonia, nitrate, and chlorophyll. If Pelekane is excluded, then the water quality in Kawaihae<br />
Bay at Wai‘ula‘ula is roughly the same or better than the comparison beaches shown in Table 9.<br />
Compared to the other beaches, Wai‘ula‘ula has lower concentrations of total phosphorus and<br />
nitrate. Wai‘ula‘ula’s chlorophyll and ammonia concentrations are lower than some beaches<br />
and higher than others. For suspended sediment, Wai‘ula‘ula’s concentration is the same or<br />
better than that found at comparison beaches.<br />
In summary, the waters of Kawaihae Bay at Wai‘ula‘ula are impaired by excessive levels of<br />
ammonia and algae. Levels of other nutrients are near the standard or slightly above. The<br />
levels of nutrients and algae are comparable to —if not slightly better than —many other<br />
Hawaiian beaches. Notably, Pelekane Bay, which receives runoff from the <strong>watershed</strong><br />
immediately north of the Wai‘ula‘ula <strong>watershed</strong>, is strongly impaired by high levels of nutrients,<br />
sediment, and algae. It is important to prevent conditions in Wai‘ula‘ula <strong>watershed</strong> from<br />
deteriorating to the level found in Pelekane <strong>watershed</strong>.<br />
Marine water quality can deteriorate after <strong>watershed</strong> runoff events and after high surf events.<br />
To see if the runoff events were a factor at Kawaihae Bay (Wai‘ula‘ula outlet), Kawaihae data<br />
(33 measurements made over 22 months) were compared with stream discharge in the<br />
<strong>watershed</strong> headwaters (Marine Dam) and with open ocean wave height (NOAA buoy 51003 at<br />
19.087N, 160.66W). When streamflow increases at Marine dam, ocean TN and silica increase<br />
two days later. (Silica comes from the land, not the ocean). This suggests that <strong>watershed</strong><br />
runoff is contributing nitrogen to the bay. Marine algae concentrations are lower when there is<br />
high surf or higher than usual streamflow. This could indicate that coastal waters are being<br />
diluted with either open ocean seawater or stream floodwaters.<br />
3.7 Watershed Loads (total amount of pollutants)<br />
“Loads” are the total amount of a pollutant that is exported from a <strong>watershed</strong>. Loads are<br />
usually measured in pounds (of Nitrogen, Phosphorus, or Sediment) per year. We want to<br />
know what the loads are now, what they will be in the future, and whether there is anything<br />
that can be done to reduce loads. Existing loads can be measured, although obtaining data is<br />
very expensive. Modeling can be used to estimate loads for locations where measurements are<br />
95<br />
Wai‘ula‘ula Watershed Management Plan DRAFT MK<strong>SWCD</strong>
not available. Modeling is also used to estimate future loads or reductions in loads resulting<br />
from remediation efforts.<br />
Measuring loads requires simultaneous measurements of stream discharge and<br />
sediment/nutrient concentration. Discharge and concentration are multiplied together to<br />
obtain loads or fluxes. (Fluxes and loads are synonyms.) The MK<strong>SWCD</strong> measured fluxes for<br />
several runoff events, but did not make the year-long measurements necessary to obtain the<br />
total load for an entire year. Annual loads were, therefore, estimated using NOAA’s N-SPECT<br />
model.<br />
3.7.1 Load Measurements<br />
Each autosampler collected discharge and water quality data for several runoff events. By<br />
multiplying discharge and sediment/nutrient concentration together, it is possible to calculate<br />
the load (pounds of sediment, nitrogen, phosphorus) carried by the stream for a particular<br />
runoff event (Table 10). The values in Table 10 represent all the pollutants carried by the<br />
stream (at each location) for a particular runoff event. Not all storms were sampled, so we do<br />
not have annual loads (total for an entire year). The discharge at the upper sampler was<br />
measured very accurately, but the discharge measurements at the other locations are<br />
approximate. As a result, the load measurements are approximate for all but the upper site<br />
(Marine Dam). Data from the Marine Dam site are reasonably representative of loads<br />
produced in the high-elevation forests. Data from the Sandalwood site and the <strong>watershed</strong><br />
outlet, however, represent a mix of land uses.<br />
The load measurements, while valuable, are limited because they cover only some locations<br />
and some storms. Because weather varies from one year to the next, several years of data<br />
would be needed to obtain a reliable estimate of the average annual load. Because such data<br />
do not exist for the Wai‘ula‘ula <strong>watershed</strong>, a model was used to estimate average annual loads<br />
and examine spatial variations over the <strong>watershed</strong>. Collection of even one complete year of<br />
data would be very expensive and currently there are no immediately <strong>plan</strong>s to do so.<br />
3.7.2 Using the N-SPECT Model to Estimate Loads and Spatial Variability in Pollutants<br />
The Nonpoint Source Pollution and Erosion Comparison Tool (N-SPECT model) estimates<br />
average annual pollutant loads as a function of climate, soil characteristics, topography, and<br />
landcover class. (Landcover classes describe both vegetation and land use.) One advantage of<br />
using a model is that it will provide explicit estimates of the contributions of each landcover<br />
class. N-SPECT can also identify areas that are particularly susceptible to erosion or predict the<br />
change in loads resulting from land use changes. The success of this approach depends on the<br />
model's assumptions about how runoff coefficients and nutrient concentrations vary among<br />
landcover classes. The key issue is whether the relative differences between landcover classes<br />
reflect the relative differences in the actual <strong>watershed</strong>.<br />
96<br />
Wai‘ula‘ula Watershed Management Plan DRAFT MK<strong>SWCD</strong>
Table 10: Measured Loads<br />
Measurements of the amount of nutrients and sediment carried by the stream during a particular runoff event. Values<br />
represent how much was carried past each autosampler. The Marine Dam site is above Waimea Town near the lower edge<br />
of the forest. The Sandalwood site is immediately below Waimea Town. TN values in italics were estimated from sediment<br />
and TDN data.<br />
SITE Runoff Sediment TDN TN NO 3 +NO 2 NH 4 PO 4 TP Runoff<br />
event Tons lbs<br />
as N<br />
Marine Dam 11/1/07 0.2 12.9 19.0 1.1 1.0 0.3 2.6 20<br />
Marine Dam 11/6/07 0.5 12.3 22.5 0.6 0.8 0.3 3.2 20<br />
Marine Dam 11/14/07 0.1 3.0 5.4 0.6 0.4 0.2 0.7 15<br />
Marine Dam 12/3/07 0.4 17.6 27.7 1.4 1.6 0.4 2.3 34<br />
Marine Dam 12/5/07 3.7 71.4 115.3 3.6 3.5 0.8 19.4 113<br />
Marine Dam 12/16/07 7.5 68.6 172.6 7.4 10.5 2.0 55.6 169<br />
Marine Dam 1/26/08 0.1 9.3 11.5 1.2 1.1 0.2 0.4 19<br />
geometric mean 0.5 16.8 28.3 1.5 0.4 0.4 3.4 36<br />
Sandalwood 11/22/07 5.4 55.3 143.5 26.6 3.6 3.2 36.2 81<br />
Sandalwood 12/6/07 6.8 102.1 199.3 26.6 5.4 4.3 51.1 135<br />
Sandalwood 12/16/07 9.2 72.6 200.6 13.2 3.9 3.0 84.2 164<br />
Sandalwood 1/26/08 0.1 7.3 9.3 2.2 1.1 0.3 0.6 12<br />
geometric mean 2.1 41.6 85.5 11.9 3.1 1.9 17.7 68<br />
Coastal outlet 1/17/09 1.1 47.0 87.9 20.4 2.7 0.4 4.9 39<br />
Coastal outlet 2/3/09 1.7 71.2 121.0 7.1 8.5 1.3 7.9 106<br />
geometric mean 1.4 57.9 103.1 12.0 0.5 0.0 6.2 64<br />
34<br />
Pelekane 12/6/07 157 157 199 6147 79 22 5 204<br />
* An acre-foot is a volume equal to one acre of land flooded to a depth of one foot.<br />
lbs<br />
as N<br />
lbs<br />
as N<br />
lbs<br />
as N<br />
lbs<br />
as P<br />
lbs<br />
as P<br />
acrefeet*<br />
97<br />
Wai‘ula‘ula Watershed Management Plan DRAFT MK<strong>SWCD</strong>
N-SPECT, which was developed by NOAA, is a GIS-based <strong>watershed</strong> model. It uses the SCS<br />
Curve Number method to estimate runoff and the RUSLE method to estimate erosion export of<br />
sediment from the <strong>watershed</strong>. The <strong>watershed</strong>’s export of total nitrogen and total phosphorus<br />
are estimated by multiplying predicted runoff by the average concentration of nitrogen and<br />
phosphorus in streamwater. At the time the modeling was done, the field measurements in the<br />
Wai‘ula‘ula <strong>watershed</strong> had not been collected. (Even if they were available, most of the data<br />
represent a mix of landcover classes, whereas we needed distinct values for each different<br />
landcover class.) Default pollutant coefficients (NT and TP concentrations in mg/L), which had<br />
been developed from a national database, were therefore used (Table 11). The Wai‘ula‘ula<br />
<strong>watershed</strong> was divided into 4 sub-basins, based on elevation and precipitation gradients, to<br />
allow for distribution of the raining days factor in the model (Figure 25). The <strong>Mauna</strong> <strong>Kea</strong> “leg”<br />
was excluded, for reasons described in Section 2.1.1. The modeling work was conducted by Ms.<br />
Katie Gaut as part of her Master’s thesis (Gaut 2009).<br />
Table 11: Pollutant Coefficients (average concentrations in runoff)<br />
Model’s Default Values for various CCAP categories<br />
High Intensity Development 0.47 2.22<br />
Low Intensity Development 0.18 1.77<br />
Cultivated Land 0.42 2.68<br />
Grassland 0.48 2.48<br />
Evergreen Forest 0.05 1.25<br />
Scrub/ Shrub 0.05 1.25<br />
Bare Land 0.12 0.97<br />
Measurements (provided for comparison)<br />
Total Total<br />
Phosphorus Nitrogen comment<br />
(mg/L) (mg/L) _______<br />
Waimea urban runoff 0.51 2.67 arithmetic average of all measurements<br />
Marine Dam (Forest) 0.08 0.35 volume-weighted average of 7 events<br />
Sandalwood (below Waimea) 0.16 0.52 volume-weighted average of 4 events<br />
Watershed outlet 0.03 0.49 volume-weighted average of 3 events<br />
98<br />
Wai‘ula‘ula Watershed Management Plan DRAFT MK<strong>SWCD</strong>
Figure 25: Sub-basin Delineation of the Waiulaula Watershed for N-SPECT (from Gaut 2009)<br />
Gaut (2009) notes that the limited hydrologic and water quality data for the <strong>watershed</strong> “means<br />
that it is not possible to validate the model by statistically rigorous comparison with historic<br />
observations. She goes on to add “Nevertheless, model simulations that are based on<br />
reasonable assumptions, expert advice of local resource managers, and default parameter<br />
values may give results that are of sufficient quality for the purposes of section 319-related<br />
<strong>watershed</strong> <strong>management</strong>” (p.14).<br />
Modeled runoff was similar to stream gage measurements in the <strong>watershed</strong>, as well as other<br />
<strong>watershed</strong>s within Hawai‘i (Table 12). The best results were obtained when the model’s<br />
“raining days” parameter was set to 0.50 inches. In the model, the forest sub-basin accounts<br />
for the majority of runoff.<br />
99<br />
Wai‘ula‘ula Watershed Management Plan DRAFT MK<strong>SWCD</strong>
Table 12: Model Prediction of Pollutant Concentrations<br />
Measured values are volume-weighted averages from the autosampler sites. Modeled and measured<br />
values are not directly comparable because the former represents the annual average, whereas<br />
measurements reflect only four (Sandalwood), seven (Marine Dam), or three (outlet) storms.<br />
Marine Dam<br />
Measured Values<br />
Marine Dam<br />
Modeled Values<br />
Total Phosphorus<br />
concentration mg/L<br />
Total Nitrogen<br />
concentration mg/L<br />
0.08 0.35 23<br />
0.06 1.27 12<br />
TSS<br />
concentration mg/L<br />
Sandalwood<br />
Measured Values<br />
0.16 0.52 40<br />
Sandalwood<br />
Modeled Values<br />
0.34 2.01 42<br />
Watershed outlet<br />
measured values<br />
0.03 0.49 13<br />
Watershed outlet<br />
Modeled values<br />
0.16 1.56 14<br />
Gaut (2009) calculated the relative contributions of major tributaries for total suspended solids,<br />
nitrogen, and phosphorus (See Figure 26 and Table 13). This information can help direct future<br />
monitoring efforts in the <strong>watershed</strong> so that ground-truthing can help confirm these results. She<br />
found:<br />
The largest contributors of runoff were Kohākōhau and Waikoloa streams. As these are the only<br />
two perennial streams in the <strong>watershed</strong>, the results are reasonable and expected. These two<br />
tributaries also are the primary contributors of nitrogen and total suspended solids to the<br />
<strong>watershed</strong>, with a combined input of 57% and 47%, respectively. Kohākōhau and Lanikepu<br />
Gulch were the primary and secondary tributary contributors of phosphorus, respectively.<br />
Lanikepu Gulch was found to deliver the majority of sediment. Mamaewe Gulch and Kohākōhau<br />
were the secondary tributaries for sediment delivery. (67%)<br />
100<br />
Wai‘ula‘ula Watershed Management Plan DRAFT MK<strong>SWCD</strong>
Figure 26: Tributaries in the Wai‘ula‘ula Watershed Assessed for Runoff, Nutrient, and Sediment<br />
Contributions in Table 11 (Figure 19 in Gaut 2009)<br />
The model’s estimate of sediment concentration (TSS) was about 20% higher than the<br />
measured concentration at the Marine Dam autosampler and more than double the measured<br />
concentration at the Sandalwood autosampler. Also, the model produced higher sediment<br />
loads than has been observed in other <strong>watershed</strong>s in Hawai‘i. It is possible that NSPECT underestimated<br />
the amount of sediment that is re-deposited a short distance from where it was<br />
eroded. Or, it is possible that some of the RUSLE/MUSLE coefficients are not appropriate to<br />
Hawai‘i. On an average annual basis, the model predicts that the accumulated nitrogen load<br />
from the <strong>watershed</strong> is approximately 23,000 kg or 1.4 kg/acre/year, while the predicted<br />
accumulated phosphorus is 2,176 kg or 0.129 kg/acre/year (Gaut 2009). When compared to<br />
other <strong>watershed</strong>s in Hawai‘i, N-SPECT produced reasonable estimates of nitrogen and<br />
phosphorus loads; however, the limited water quality data collected by autosamplers within<br />
the Wai‘ula‘ula <strong>watershed</strong> suggest these estimates may be high (Gaut 2009).<br />
101<br />
Wai‘ula‘ula Watershed Management Plan DRAFT MK<strong>SWCD</strong>
Table 13: Relative contributions of major tributaries for pollutants displayed.<br />
Underlined and bold values represent the first and second largest contributor tributaries for that<br />
particular pollutant, respectively. (From Gaut 2009: Table 28)<br />
The model was also used to identify “critical” areas that produced disproportionately large<br />
amounts of sediment and nutrients (Figures 27, 28, and 29). The model predicts high sediment<br />
sources in the mid-west region of the forest sub-basin, as well as the lower reaches of the<br />
Waimea sub-basin. Gaut (2009) notes that “the top 1% of source areas are on steep grassy<br />
slopes. In the middle region of the <strong>watershed</strong>, however, the high sediment source areas appear<br />
to be associated with bare lands....” (p. 70). The model predicts that the lower <strong>watershed</strong><br />
produces little sediment and nutrients. The reason for this is probably that there is little rainfall<br />
in the lower <strong>watershed</strong>.<br />
If critical areas are identified, then selected BMPs can be evaluated with N-SPECT to assist in<br />
estimating potential load reductions from the implementation of these BMPs. Gaut (2009)<br />
examined several BMPs. She found that restoration of riparian areas did result in significant<br />
reductions in accumulated sediment and phosphorus (11% and 8%). Re<strong>plan</strong>ting of 50% of the<br />
bare land resulted in a 15% reduction of accumulated sediment. The modeling effort found<br />
little to no change in polluted runoff with the implementation of BMPs on agricultural<br />
(cultivated) lands. However, it may be that, given the small proportion of cultivated agricultural<br />
land in the <strong>watershed</strong>, the N-SPECT model operates at too large a scale (30x30 meter pixels) to<br />
accurately model these BMPs (Gaut 2009).<br />
102<br />
Wai‘ula‘ula Watershed Management Plan DRAFT MK<strong>SWCD</strong>
Figure 27: Modeled Sediment Sources<br />
Figure 28: Modeled Phosphorus Sources<br />
103<br />
Wai‘ula‘ula Watershed Management Plan DRAFT MK<strong>SWCD</strong>
Figure 29: Modeled Nitrogen Sources<br />
3.7.3 Using the N-SPECT Model to Estimate Future Loads<br />
Gaut (2009) also ran a simulation of future conditions, using land use changes projected in<br />
Hawai‘i County's General Plan LUPAG (Table 14). She found:<br />
Percent changes for the future scenario predict further increases in runoff, nitrogen and<br />
phosphorus. The phosphorus amounts are predicted to increase by over 20%. In addition, a<br />
large proportion of the increase in the amount of phosphorus is expected to occur at a close<br />
proximity to the coast. Much of the <strong>watershed</strong> that is currently classified as bare land is<br />
<strong>plan</strong>ned to be converted to urban expansion zones, which will cause the predicted overall<br />
accumulated sediment to decrease. (p. 79)<br />
While the absolute quantitative output values may not be accurate, “they are indicative of the<br />
overall magnitude and patterns of sediment and nutrient delivery in the <strong>watershed</strong>” (Gaut<br />
2009: 79).<br />
Table 14: Current and Future Load Estimates from the N-SPECT Model (based on Gaut 2009: Table 33)<br />
Exports are at the <strong>watershed</strong> mouth (where the stream enters the ocean).<br />
Current Scenario Future Scenario % Change<br />
from Current<br />
Total Watershed Runoff (m 3 /yr) 15,290,900 16,692,500 9%<br />
Total Sediment Export (tons/yr) 233,637 212,551 -9%<br />
Total Nitrogen Export (kg/yr) 23,860 26,824 12%<br />
Total Phosphorus Export (kg/yr) 2,473 3,003 21%<br />
104<br />
Wai‘ula‘ula Watershed Management Plan DRAFT MK<strong>SWCD</strong>
3.8 Toxics<br />
University of Hawai‘i graduate student James Tait conducted a study to see if trace elements in<br />
stream sediment reflect land use in the upstream <strong>watershed</strong> (Tait 2008). Four main classes of<br />
land use were evaluated as potential sources of pollution: Urban, Cultivated, Pasture /<br />
Rangeland, and Forest. The study looked at lead (Pb), zinc (Zn), copper (Cu), arsenic (As) and<br />
Vanadium (V).<br />
Tait concluded:<br />
Both anthropogenic and natural factors were found to influence the composition of soils and<br />
streambed sediment. The composition of non-point pollutants often showed significant<br />
variability but some consistent trends were identified:<br />
.<br />
• Lead and zinc were enriched in surface soils that are near roadways.<br />
• Larger urban areas were associated with more lead and zinc in streambed sediment<br />
(downstream of the urban area). This was also true to a lesser extent for Copper.<br />
The Tait study also looked at whether the isotopic composition of nitrate in stream waters<br />
could be used to identify the source of nitrate. These results were inconclusive, however.<br />
3.9 Biological Data<br />
Assessment of ecosystem health can be based either on water quality or on biological<br />
populations. A healthy ecosystem is diverse and contains native species.<br />
DLNR's Atlas of Hawaiian Watersheds and Their Aquatic Resources (2008) compiles information<br />
from many years of surveys and publications on Hawaiian stream animals. The following data,<br />
taken from DLNR (2008), comes from biotic samples collected in 1968, 1990, 1992, 1994, 1999,<br />
2000, and 2001 (Table 15). It includes data most recently collected by Bishop Museum's<br />
Hawai‘i Biological Survey for DHHL's Lālāmilo Residential Project EIS. In addition, information<br />
from the recent stream survey undertaken by Englund (2010) is also included.<br />
105<br />
Wai‘ula‘ula Watershed Management Plan DRAFT MK<strong>SWCD</strong>
Table 15: Distribution of Biotic Sampling<br />
The number of survey locations that were sampled in the various reach types.<br />
Survey type Estuary Lower Middle Upper Headwaters<br />
Damselfly<br />
Surveys<br />
DAR Point<br />
Quadrat<br />
0 0 1 0 1<br />
0 26 41 129 0<br />
HDFG 0 0 0 0 1<br />
Microhabitat<br />
Survey<br />
Published<br />
Reports<br />
0 0 0 24 0<br />
1 1 1 2 1<br />
Table 16 compiles the list of species found in different stream reaches within the Wai‘ula‘ula<br />
<strong>watershed</strong>. The letter “P” indicates the presence of that species in that reach of stream. Data<br />
from DLNR (2008) is in regular font; data from Englund (2010) is in bold font. The reach<br />
classification system was developed by Parham and Lapp (2006). The reach types are based on<br />
elevation and the presence of different sized barriers (waterfalls) in the stream:<br />
• Estuary: all stream segments between the coastline and 1 m. elevation.<br />
• Lower Reach: stream segments between 1 and 20 m. elevation and below any barrier of<br />
approximately 10 m. high.<br />
• Middle Reach: stream segments greater than 20 m. elevation or above the first 10 m.<br />
barrier and less than 200 m. elevation or below the first 20 m. high barrier.<br />
• Upper Reach: stream segments greater than 200 m. elevation or above the first 20 m.<br />
barrier and less than 750 m. elevation.<br />
• Headwaters: stream segments greater than 750 m. elevation.<br />
106<br />
Wai‘ula‘ula Watershed Management Plan DRAFT MK<strong>SWCD</strong>
Table 16: Presence (P) of Species in Different Stream Reaches<br />
Scientific Name (Common Name) Status Estuary Lower Middle Upper Headwaters<br />
Fish<br />
Lentipes concolor (‘o‘opu hi‘ukole) Endemic P P<br />
Sicyopterus stimpsoni (‘o‘opu nōpili) Endemic P P P<br />
Stenogobius Hawai‘iensis (‘o‘opu naniha) Endemic P<br />
Eleotris sandwincensis (‘o‘opu ‘akupa) Endemic P<br />
Awaous guamensis (‘o‘opu nākea) Indigenous P P P/P P<br />
Mugil cephalus (striped mullet)<br />
Gambusia affinis (mosquito fish) Introduced P P P/P<br />
Poecilia reticulate (guppy) Introduced P/P P P/P<br />
Misgurnus anguillicaudatus (dojo loach) Introduced P/P P/P<br />
Poeciliidae sp. Introduced P P P<br />
Crustaceans<br />
Macrobrachium grandimanus (‘Ōpae ‘oeha‘a) Indigenous P P<br />
Macrobrachium Iar (Tahitian prawn) Introduced P P/P P/P<br />
Procambarus clarki (crayfish) Introduced P<br />
P<br />
Hyallela azteca<br />
P<br />
Metopograpsus sp. (Purple climber crabs) Indigenous P<br />
Mollusks<br />
Physa sp. Introduced P P P<br />
Lymnaea sp. Indigenous P<br />
Amphibians<br />
Bufo marinus (Cane toad) Introduced P/P P/P P<br />
Rana catesbeiana (American bullfrog) Introduced P/P P<br />
Rana rugosa (wrinkled frog) Introduced P P P<br />
Ranidae sp. (bullfrog) Introduced P<br />
Aquatic Insects<br />
Anax junius (common green darner) Indigenous P P P P/P<br />
Anax strenuous (giant Hawai‘ian dragonfly) Endemic P/P P<br />
107<br />
Wai‘ula‘ula Watershed Management Plan DRAFT MK<strong>SWCD</strong>
Scientific Name (Common Name) Status Estuary Lower Middle Upper Headwaters<br />
Crocothemis servilia (scarlet skimmer) Introduced P P/P<br />
Orthemis ferruginea (roseate skimmer) Introduced P P/P<br />
Pantala flavescens (wandering glider) Indigenous P P P/P<br />
Tramea lacerate (black saddlebags) P P<br />
Megalagrion caliphya Endemic P<br />
Enallagma civile (familiar bluet damselfly) Introduced P P/P<br />
Ischnura ramburii (Rambur’s forktail) Introduced P P P/P P<br />
Chironomus Hawai‘iensis (Hawaiian midge) Endemic P<br />
Megalagrion sp. (dragonfly) Endemic P P<br />
Orthocladius grimshawi Endemic P<br />
Ischnura posita Introduced P/P<br />
Rhantus gutticollis Introduced P<br />
Diptera (Flies, gnats)<br />
Chironomus sp. Endemic P P<br />
Procanace sp. Endemic P<br />
Forcipomyia hardyi Endemic P<br />
Cricotopus bicinctus Introduced P P<br />
Dolichopus exsul Introduced P<br />
Dolichopodidae sp. 1 Endemic P<br />
Scatella sp. Endemic P P<br />
Scatella clavipes Endemic P<br />
Heteroptera<br />
Saldula exulans Endemic P<br />
Microvelia vagans Endemic P<br />
Trichoptera<br />
Cheumatopsyche analis Introduced P<br />
Oxyethira maya Introduced P P<br />
Bryozoans<br />
Plumatella repens Introduced P<br />
108<br />
Wai‘ula‘ula Watershed Management Plan DRAFT MK<strong>SWCD</strong>
As noted in Section 2.1.10, the biodiversity of native species found in the Wai‘ula‘ula <strong>watershed</strong><br />
is high. This indicates that, from a biological resources standpoint, the stream quality is very<br />
high, particularly in the upper reaches.<br />
3.10 Summary<br />
3.10.1 Pollutants of greatest concern and their spatial variability<br />
Water quality data were collected for the purpose of determining which nonpoint pollutants<br />
are of the greatest concern in the <strong>watershed</strong> and in the marine receiving waters. Marine<br />
waters just offshore of the <strong>watershed</strong> have excessive levels of algae and ammonia. Ammonia is<br />
a form of nitrogen that is especially harmful to marine life. For streams, the parameter of<br />
greatest concern is total nitrogen (TN), followed by total phosphorus (TP). Suspended sediment<br />
and nitrate are parameters of possible concern. Stream water quality was measured in three<br />
locations. The highest levels of nutrients and sediment were found at the downstream edge of<br />
Waimea Town, and the lowest levels were found where Waikoloa stream exits the forest.<br />
Intermediate levels were found at the <strong>watershed</strong> outlet (where the stream enters the ocean).<br />
There are high levels of pollutants in runoff from high-use paved areas in urban Waimea. This<br />
urban runoff has particularly high values of TSS, TN, and TP. The headwaters of the <strong>watershed</strong><br />
contain pristine forests. Runoff originating in the forest contains sediment and nutrients, but,<br />
for the most part, the concentrations are not particularly high. The forest runoff does, however,<br />
have slightly elevated TN concentrations, and, occasionally, TP concentrations are elevated.<br />
3.10.2 Information Gaps<br />
A few of the following data gaps are addressed in the monitoring <strong>plan</strong> (Chapter 6).<br />
• Monitoring has been conducted on only one of the two major tributaries of the<br />
Wai‘ula‘ula Stream. We do not have data for <strong>Kea</strong>nu‘i‘omanō stream, so it is unknown if<br />
different sections of the high elevation forest generates runoff with different chemical<br />
characteristics. It is possible that there are differences based on vegetation type<br />
(nitrogen fixing or not) or distribution of oxygen-poor bogs.<br />
• The middle reaches of the stream are intermittent, and there are periods when these<br />
reaches contain stagnant isolated pools. Although these pools are small, they are quite<br />
important to aquatic species. It is likely that the water quality in these pools is poor, but<br />
we do not have any measurements of water quality. Nor do we know the extent to<br />
which these pools are adversely affected by upstream diversions (both legal and illegal).<br />
• Interpretation of the nitrogen data is complicated by the fact that we know little about<br />
the nitrogen transformations (one type changing into another) (cycling) occurring in<br />
Wai‘ula‘ula Bay.<br />
109<br />
Wai‘ula‘ula Watershed Management Plan DRAFT MK<strong>SWCD</strong>
• We do not know if the stream water is N-limited or P-limited. Nor do we know if<br />
Wai‘ula‘ula Bay is N-limited or P-limited.<br />
• We are unsure if the lower Wai‘ula‘ula <strong>watershed</strong> is capable of occasionally generating<br />
the kind of sediment-rich runoff that has been observed in the Pelekane Bay <strong>watershed</strong><br />
immediately to the north. Based on one event measured at the outlet of Pelekane<br />
<strong>watershed</strong>, the concentration of sediment in Pelekane storm runoff is 150 times greater<br />
than what is allowed. The total nitrogen concentration was 240 times greater than what<br />
is allowed. The lower elevation regions of the Pelekane and Wai‘ula‘ula <strong>watershed</strong>s are<br />
similar in climate and land use, so it is difficult to dismiss the possibility that, given the<br />
right storm, the lower portion of the Wai‘ula‘ula <strong>watershed</strong> is capable of generating<br />
runoff with very high concentrations of sediment and nitrogen. On the other hand, the<br />
lower Pelekane <strong>watershed</strong> is steeper than the lower Wai‘ula‘ula <strong>watershed</strong> and has<br />
older soils. Moreover, the comparison between the two <strong>watershed</strong>s is based on only<br />
one event for Pelekane and three events for Wai‘ula‘ula. The Pelekane samples were<br />
collected on a day that we did not collect data at the outlet of the Wai‘ula‘ula<br />
<strong>watershed</strong>.<br />
• Sections of the Wai‘ula‘ula Stream and its tributaries are losing streams, meaning that<br />
water leaks through the streambed. Infiltrating water likely goes into groundwater,<br />
although it is possible that some of it is taken up by streamside vegetation. Thus, the<br />
water that leaks through the streambed could eventually flow to the ocean. Notably,<br />
most of the lower reaches are losing. Also, it is likely that the stream is a losing one (at<br />
least some of the time) between the Sandalwood autosampler and the Marine Dam<br />
autosampler. This raises the question as to how much of the nonpoint pollutants<br />
generated in the upper and middle reaches of the <strong>watershed</strong> are delivered to the ocean.<br />
We do not have data on the amount of losses, however, nor on which reaches are<br />
gaining reaches.<br />
• The modeling results suggest that large amounts of sediment are being eroded from<br />
certain sections of the middle <strong>watershed</strong> that have an unfavorable combination of<br />
intense rain and erodible soil. Ground-truthing is recommended to verify this result.<br />
110<br />
Wai‘ula‘ula Watershed Management Plan DRAFT MK<strong>SWCD</strong>
Chapter 4: Threats to the Water Quality of<br />
the Watershed<br />
This section describes the threats to the water quality of Wai‘ula‘ula <strong>watershed</strong>. It responds to<br />
element (a) of EPA’s 9 key elements for <strong>watershed</strong>-based <strong>plan</strong>s that are critical for achieving<br />
improvements in water quality (see Appendix B). At this time, there are insufficient data to<br />
conclusively prioritize threats by load contribution or impacts to resources.<br />
The focus of this <strong>management</strong> <strong>plan</strong> is on preventing further degradation of water quality.<br />
Possible pollutant sources and threats to the <strong>watershed</strong> are described below. Based on these<br />
threats, the <strong>management</strong> <strong>plan</strong> establishes goals and objectives for maintaining and restoring<br />
water quality.<br />
4.1 Nonpoint Sources of Pollution<br />
Nonpoint source pollution (or polluted runoff) is pollution that cannot be traced to a single<br />
source but, rather, comes from many diffuse sources. It generally results from precipitation,<br />
land runoff, infiltration, drainage, seepage, hydrologic modification or atmospheric deposition.<br />
As runoff from rainfall moves across the landscape, it picks up pollutants from human activities,<br />
ultimately depositing them in surface waters. Pollutants can also seep into the ground and<br />
affect groundwater, as well as surface water with connections to groundwater.<br />
4.1.1 Agriculture<br />
Agricultural activities, if not properly managed, can contribute polluted runoff in the forms of<br />
sediment, nutrients, pesticides and animal waste. Agricultural activities can also directly impact<br />
the habitat of aquatic species through physical disturbances caused by livestock or equipment.<br />
Agriculture is a significant land use in the Wai‘ula‘ula <strong>watershed</strong>, with over 8,000 acres<br />
dedicated to crops and livestock grazing.<br />
Good soil is essential to conventional farming. Farmers are generally motivated to prevent soil<br />
runoff and keep the soil on the land where it benefits food production. However, without<br />
proper <strong>management</strong>, there is always the potential for soil erosion into streams during storm<br />
events or from excessive irrigation after fields have been tilled and before there is sufficient<br />
vegetative cover to prevent runoff.<br />
Sediment is a result of soil erosion. Soil erosion can be characterized as the transport of<br />
particles that are detached by rainfall, flowing water or wind. Eroded soil is either redeposited<br />
111<br />
Wai‘ula‘ula Watershed Management Plan DRAFT MK<strong>SWCD</strong>
on the same field or transported from the field in runoff. The types of erosion associated with<br />
agriculture are typically sheet and rill erosion, and gully erosion. Sediments transported from<br />
the field into waterbodies often have other pollutants attached to the soil particles, such as<br />
nutrients and chemicals (herbicides, pesticides, etc.). Suspended sediments in stream and<br />
coastal waters reduce the amount of sunlight available to aquatic <strong>plan</strong>ts, cover fish spawning<br />
areas and food supplies, smother coral reefs, adversely affect the filtering capacity of filter<br />
feeders, and clog and harm the gills of fish.<br />
Nitrogen (N) and phosphorus (P) are the two major nutrients from agricultural activities that<br />
can degrade water quality. Nutrients are applied to agricultural lands in several different forms<br />
and come from a variety of sources, including commercial fertilizers, manure, and irrigation<br />
water. While all <strong>plan</strong>ts require nutrients for growth, excessive nutrient application can cause<br />
runoff into streams and the ocean, disrupting ecosystems by causing blooms of aquatic and<br />
marine <strong>plan</strong>ts such as algae. In addition, over-application of nutrients costs the farmer<br />
unnecessary expense.<br />
When excessive nutrients are introduced into a stream or ocean, aquatic <strong>plan</strong>t growth may<br />
increase dramatically, a process called eutrophication. This adds more organic material to the<br />
system, which eventually dies and decays. The decaying organic matter can produce odors and<br />
deplete the oxygen supply required by aquatic organisms. Eutrophication also increases<br />
turbidity and is harmful to coral reefs.<br />
The term pesticide includes any substance or mixture of substances used to prevent, destroy,<br />
repel, or mitigate any pest or intended for use as a <strong>plan</strong>t regulator, defoliant, or desiccant.<br />
Pesticides are generally applied to crops to kill insects, molds, mildew, fungus, and weedy<br />
<strong>plan</strong>ts that are detrimental to the successful growth of the food crop. Pesticides can harm the<br />
environment by eliminating or reducing populations of desirable organisms and riparian or<br />
aquatic <strong>plan</strong>ts. Some chemicals resist degradation and can persist in soils and aquatic<br />
environments. Pesticides are normally transported into surface water either through direct<br />
application or attached to sediment in runoff.<br />
Animal waste from agricultural activities in the Wai‘ula‘ula <strong>watershed</strong> is comprised mostly of<br />
the fecal and urinary wastes of cattle. Not only is manure high in nutrients that can lead to<br />
eutrophication, but it can also contain bacteria, viruses, and pathogens. Cattle are currently<br />
allowed to graze adjacent to streams and access the streams for water. This facilitates the<br />
introduction of pollutants into the waterbodies of the <strong>watershed</strong>. Livestock grazing near and in<br />
the streams can also destabilize streambanks and reduce streambank vegetation.<br />
The <strong>Mauna</strong> <strong>Kea</strong> Soil and Water Conservation District (MK<strong>SWCD</strong>) normally works with individual<br />
agricultural landowners to develop conservation <strong>plan</strong>s for approval by the district. A<br />
conservation <strong>plan</strong> is a customized document that outlines the use of conservation practices to<br />
maintain or improve the natural resources that support productive and profitable agricultural<br />
operations. An approved conservation <strong>plan</strong> enables the landowner to be exempted from the<br />
county grading ordinances for any earthmoving activities. NRCS usually assists in developing<br />
112<br />
Wai‘ula‘ula Watershed Management Plan DRAFT MK<strong>SWCD</strong>
conservation <strong>plan</strong>s to treat existing and potential resource problems and has funding available<br />
for eligible participants to assist with the installation of best <strong>management</strong> practices, under the<br />
Federal Farm Bill. Every farm or ranch has its own unique resource problems or concerns.<br />
Conservation <strong>plan</strong>ning is a voluntary way for operators to meet land <strong>management</strong> goals, with<br />
<strong>plan</strong>ning assistance from NRCS and the local conservation district to help identify options that<br />
provide the greatest conservation benefit while meeting production goals.<br />
Of the 640 acres currently used for farming, only 94 acres (or 15%) are farmed under<br />
conservation <strong>plan</strong>s developed by NRCS and approved by the MK<strong>SWCD</strong>. While those farms with<br />
conservation <strong>plan</strong>s are probably implementing appropriate best <strong>management</strong> practices to<br />
control erosion, properly manage nutrient and pesticide applications, and apply irrigation<br />
water, there are many others who may not be. This objective addresses the CNPCP<br />
<strong>management</strong> measures for agricultural erosion and sediment control, nutrient <strong>management</strong>,<br />
pesticide <strong>management</strong>, and irrigation water <strong>management</strong>.<br />
As noted earlier, a high percentage of land in the <strong>watershed</strong> - both prime kikuyu land and<br />
marginal land - is used for grazing (about 8,000 acres). While the primary grazers, Parker Ranch<br />
and FR Cattle Co., have conservation <strong>plan</strong>s with the <strong>Mauna</strong> <strong>Kea</strong> Soil and Water Conservation<br />
District, improvements can still be made. Infrastructure is limited, with more fencing to reduce<br />
paddock size and watering facilities needed. In some areas, cattle are accessing streams for<br />
water because there are no other sources of water available, causing streambank erosion, and<br />
adding nutrients and pathogens to the stream system.<br />
A considerable amount of land currently being grazed in the <strong>watershed</strong> is considered marginal<br />
lands. With sufficient rainfall, these lands support cattle production. During the drought<br />
conditions experienced during most of the past decade, grazing in these areas has been<br />
seasonal at best. However, the grazing of these lands can be considered a public benefit,<br />
protecting the numerous residential communities adjacent to these marginal lands. Without<br />
periodic grazing, the resulting tall, dry grasses would present a significant fire hazard.<br />
The Conservation Reserve Enhancement Program (CREP) is a joint federal-state program that<br />
was recently started in Hawai‘i to help restore degraded agricultural lands and reduce polluted<br />
runoff from these lands. It provides incentives to farmers and ranchers to remove degraded<br />
cro<strong>plan</strong>d and marginal pastureland from agricultural production and convert the land to native<br />
grasses, trees, and other vegetation.<br />
4.1.2 Urban/Suburban Runoff<br />
Urban development can have a negative impact on the hydrology and water quality of a<br />
<strong>watershed</strong>. Impervious surface area is often associated with polluted runoff. The “hardening”<br />
of the landscape that comes with urbanization increases runoff volumes and pollutant loadings.<br />
Impervious surfaces, such as rooftops, roads, parking lots, and sidewalks, decrease the<br />
infiltration capacity of the ground and result in greater runoff volumes that can exacerbate<br />
113<br />
Wai‘ula‘ula Watershed Management Plan DRAFT MK<strong>SWCD</strong>
flooding problems. Urban development also causes an increase in pollutants, such as<br />
sediments, nutrients, pathogens, hydrocarbons, heavy metals, and toxins.<br />
Scientists use percent imperviousness to describe how much of a given area is covered by hard<br />
surfaces. As the amount of impervious cover increases, the amount of runoff generated also<br />
increases, making it difficult for the water to seep into the soil because it is flowing so quickly.<br />
This visual, developed by EPA, shows the relationship between impervious cover and surface<br />
runoff. As little as 10% impervious cover in a <strong>watershed</strong> can result in stream degradation (EPA<br />
2003).<br />
According to NOAA’s C-CAP Land Cover map, the high-intensity and low-intensity developed<br />
(urban) areas within the <strong>watershed</strong> are concentrated along the streams. While urban areas<br />
occupy relatively small areas of the Wai‘ula‘ula <strong>watershed</strong> (2%), their pollutant contributions<br />
can be significant. Measured water quality below Waimea town is significantly worse than<br />
upstream. Comparing water quality below Waimea to water quality above town, ammonia<br />
concentrations doubled, total phosphorus concentrations (TP) more than doubled, and nitrate<br />
concentrations quadrupled. Urban development within the <strong>watershed</strong> increased significantly<br />
over the past 30 years and is projected to continue to increase. The lower <strong>watershed</strong> is slated<br />
for urban expansion (Hawai‘i County 2005), and additional urban growth is projected in<br />
Waimea town and along Waikoloa and <strong>Kea</strong>nu‘i‘omanō streams.<br />
Stormwater picks up nutrients, sediment, and chemical contaminants as it flows across yards,<br />
parking lots, construction sites, and parks. Roofs and driveways generate additional<br />
stormwater runoff that must be managed. Development activities like clearing vegetation,<br />
grading, removing or compacting soil, and adding impervious surfaces also increase stormwater<br />
and polluted runoff.<br />
Fifty-five to seventy percent of impervious surfaces in an urban area are transportation<br />
associated (Chesapeake Bay Program 2008). Runoff from roadways and parking lots can have a<br />
particularly adverse effect on water quality if no measures are taken to remove contaminants<br />
114<br />
Wai‘ula‘ula Watershed Management Plan DRAFT MK<strong>SWCD</strong>
efore the runoff reaches the receiving water. Oil and grease are leaked onto road surfaces<br />
from car and truck engines, spilled at fueling stations, and discarded directly into storm drains<br />
instead of being taken to recycling stations. Heavy metals come from car and truck exhaust,<br />
worn tires and engine parts, brake linings, weathered paint, and rust. Rain water picks up these<br />
pollutants and carries them to roadsides or into storm drains.<br />
In urban areas of the Wai‘ula‘ula <strong>watershed</strong>, Hawai‘i County has the lead in the control of<br />
erosion during site development, and ensuring proper site <strong>plan</strong>ning and stormwater<br />
<strong>management</strong> to protect sensitive natural features, through its ordinances and rules related to<br />
zoning, subdivisions, drainage, and erosion and sediment control. The State Department of<br />
Health also regulates stormwater runoff through its NPDES permit process. The Hawai‘i<br />
Department of Transportation requires best <strong>management</strong> practices during construction of State<br />
roads, highways, and bridges. The Hawai‘i CZM Program funded the production of a Low<br />
Impact Development (LID) manual for Hawai‘i (Horsley Witten Group 2006), which describes<br />
stormwater and wastewater <strong>management</strong> techniques for urban and suburban areas that<br />
reduces impacts on sensitive water resources.<br />
Many roads within the Wai‘ula‘ula <strong>watershed</strong> are fitted with curb and gutter catch basins to<br />
convey stormwater away from roads. This stormwater is then discharged into dry wells or<br />
directly into streams, affecting either groundwater or surface water. On other roads,<br />
stormwater is conveyed to grassy shoulders on either side of the road, where it ponds until it is<br />
either absorbed or runs off. All the bridges in the <strong>watershed</strong> have scuppers that discharge<br />
stormwater directly into the streams below.<br />
Hawai‘i County has historically relied on deep (+20 feet) 5-feet diameter drainage injection<br />
wells (or “dry wells”) as the primary means of capturing and disposing of urban stormwater<br />
runoff, because Hawai‘i Island's geology allows for good lateral and downward percolation. The<br />
county allows a maximum disposal rate of 6 cubic-feet per second (cfs) of water per dry well<br />
(Kuba 2005). Many new and existing developments within the Waimea area employ dry wells<br />
to trap runoff from roadways and parking areas, notably the Parker Ranch shopping center,<br />
Sandalwood residential area, Parker Ranch's Luala‘i development, and DHHL's new Lālāmilo<br />
housing development.<br />
The U.S. Geological Survey in cooperation with Hawai‘i County Department of Public Works<br />
assessed the potential for roadside dry wells to affect water quality (Izuka et al. 2010). Using<br />
the presence or absence of urbanization in the drainage area, distance between the bottom of<br />
the dry well and the water table, and the proximity to receiving waters, USGS identified wells<br />
that have the greatest potential to affect the water quality of receiving waters at the coast and<br />
in drinking-water wells. Effects to surface water were not considered. Water quality sampling<br />
of water entering the dry wells has not been undertaken on a large scale. Sampling of runoff<br />
into dry wells in Waimea show significant pollutant loads. Based on a limited amount of data, it<br />
appears likely that runoff from high-use paved areas exceeds water quality criteria for sediment<br />
(by a factor of five), total phosphorus (by a factor of four), total nitrogen (by a factor of three)<br />
and nitrate (measured values are only slightly greater than the standard).<br />
115<br />
Wai‘ula‘ula Watershed Management Plan DRAFT MK<strong>SWCD</strong>
According to Kuba (2005), all dry wells operate functionally “as both a sediment trap and a<br />
storm water disposal system.” The County Department of Public Works has a dry well cleaning<br />
program for its transportation-related dry wells to removed accumulated sediment in its more<br />
than 1,000 permitted dry wells island-wide, in order to maintain the capacity of these dry wells.<br />
It is less clear how frequently private dry wells are maintained.<br />
Pipe Discharging into Waikoloa Stream<br />
There is one large pipe discharging urban stormwater runoff directly into Waikoloa Stream.<br />
This concrete pipe is located behind the Waimea Community Education building on Māmalohoa<br />
Highway and discharges untreated runoff from storm drains along Māmalohoa Highway. PVC<br />
pipes discharge roof runoff from the KTA shopping center directly into Waikoloa stream.<br />
Within DHHL’s Lālāmilo development, it appears that runoff from the subdivision’s yards is<br />
being channeled down steep, rock lined slopes into Lanikepu and <strong>Kea</strong>nu‘i‘omanō streams.<br />
4.1.3 Wastewater Disposal Systems<br />
Sewage contains pathogens, high levels of nutrients and oxygen-consuming organic matter.<br />
Standard sewage treatment (primary plus secondary) kills pathogens, removes solids, and<br />
removes some of the nutrients from the wastewater. Typically, a significant amount of<br />
nutrients (more than half of what was originally in the sewage) is not removed. Septic systems<br />
tanks are somewhat more effective than secondary treatment at removing nitrogen, but<br />
cesspools are less effective.<br />
Sewer systems within the Wai‘ula‘ula <strong>watershed</strong> are limited to sections of Waimea town and<br />
the <strong>Mauna</strong> <strong>Kea</strong> Beach Resort properties. Everyone else is using an onsite disposal system<br />
(OSDS), either a cesspool or septic system, which are effective over the long-term only if<br />
properly operated and maintained. When system failure occurs, untreated wastewater and<br />
sewage can be introduced into groundwater or nearby streams and waterbodies, introducing<br />
pathogens and causing eutrophication.<br />
116<br />
Wai‘ula‘ula Watershed Management Plan DRAFT MK<strong>SWCD</strong>
Hawaii has made progress in eliminating new individual cesspools 7 . Efforts to ban the use of<br />
new cesspools statewide have been made through revision to Chapter 11-62, HAR. The rule<br />
either bans or severely restricts the use of cesspools throughout the state. On Hawai‘i Island,<br />
new cesspools for individual homes only are allowed in certain areas. These areas are<br />
designated in Critical Wastewater Disposal Area maps. The maps are based upon development<br />
density, groundwater development, potential contamination of coastal waters and the use of<br />
OSDS. In the Wai‘ula‘ula <strong>watershed</strong>, cesspools are allowed in most areas on parcels of greater<br />
than 5 acres in size.<br />
Although the current rule still allows some new cesspools in limited areas, there are a number<br />
of items that either prohibit new cesspools or require that existing cesspools be upgraded.<br />
These are described in Section 2.2.9.3.<br />
Houses in the Waimea area built before 1991 will likely have cesspools, unless they were<br />
required to convert to a septic system because of problems with the existing cesspool or if<br />
significant changes were made to the structure. Houses built more recently, especially if part of<br />
a subdivision, will likely have septic systems. The type of wastewater system by TMK has not<br />
yet been mapped for the <strong>watershed</strong>, because at this time these data are not available in an<br />
electronic format. This information would help identify potential sources of nutrients within<br />
the <strong>watershed</strong>, and, then, more detailed water quality assessments can be undertaken to<br />
determine whether these systems, particularly the older cesspools, in neighborhoods adjacent<br />
to the streams are having a detrimental effect on surface water quality.<br />
Pumping Septic Tank<br />
7 The U.S. Environmental Protection Agency (EPA) promulgated Underground Injection Control (UIC) regulations on<br />
December 7, 1999, which prohibited the construction of new large capacity cesspools (LCCs) nationwide, effective<br />
April 5, 2000. Existing large capacity cesspools were required to be replaced by an alternative wastewater system<br />
and closed by April 5, 2005. Numerous large capacity or “gang” cesspools in Waimea were converted to<br />
alternative systems as a result.<br />
117<br />
Wai‘ula‘ula Watershed Management Plan DRAFT MK<strong>SWCD</strong>
Parker Ranch owns and operates the Waimea Treatment Company, the only wastewater<br />
treatment <strong>plan</strong>t in the Waimea area. The current treatment capacity is 0.1 MGD (100,000<br />
gallons per day). Currently inflow is 65% of its capacity. Wastewater is treated to R-3 quality,<br />
which, according to DOH, is undisinfected water that has received primary and secondary<br />
treatment. Treated effluent is disbursed through a 40-acre sprinkler system that is located<br />
approximately 300 yards from the treatment <strong>plan</strong>t on Parker Ranch land. The treatment <strong>plan</strong>t<br />
currently handles sewage from areas of downtown Waimea, including the KTA shopping center,<br />
Parker Ranch shopping center, Ace hardware store, North Hawai‘i Community Hospital,<br />
Kamuela senior housing project, Kahilu Theatre, HoloHolo Ku residential development, and<br />
Luala‘i subdivision.<br />
<strong>Mauna</strong> <strong>Kea</strong> Beach Resort also operates a wastewater treatment <strong>plan</strong>t which serves all the<br />
resort-associated developments in the coastal part of the <strong>watershed</strong>, including Kumulani,<br />
Moani, Apa Apa‘a, Wai‘ula‘ula, Kaunaoa, High Bluffs, Bluffs, and Hapuna and <strong>Mauna</strong> <strong>Kea</strong> Beach<br />
resorts. The <strong>plan</strong>t's maximum capacity is 600,000 gallons per day (gpd), though current inflow<br />
ranges between 130,000 and 300,000 gpd. The wastewater is treated to R-1 standards, which<br />
is the highest level of treatment in Hawai‘i. This means the wastewater goes through<br />
secondary treatment (activated sludge), tertiary treatment (filtration), and ultraviolet<br />
disinfection. The treated wastewater is then blended with brackish well water and used to<br />
irrigate the golf course.<br />
4.1.4 Streambank Erosion<br />
Hawai‘i's streams are subject to wide fluctuations in both flow depth and velocity because of<br />
their flashy nature. As flow depths and velocities increase, the force of water flowing against<br />
the streambank removes particles from the banks. Over time, the erosion can cause the<br />
streambank to slump and fall into the stream channel. Runoff from adjacent land that enters a<br />
stream by flowing over the streambanks can also erode soil from streambanks, particularly if<br />
the banks are already unstable because of an absence of vegetation or roots holding soil in<br />
place. Streambanks can also be destabilized by hoof action, when cattle access the streams for<br />
water. Fallen trees or other debris in the stream channel can contribute to streambank erosion,<br />
as the flowing water finds other ways around the impediments in the stream channel.<br />
Riparian buffers can help stabilize eroding streambanks. They can also help improve the quality<br />
of water resources by removing or ameliorating the effects of pollutants in runoff. A riparian<br />
buffer is defined as:<br />
an area of trees and other vegetation located in areas adjoining and upgradient<br />
from surface water bodies and designed to intercept surface runoff, wastewater,<br />
subsurface flow, and deeper groundwater flows from u<strong>plan</strong>d sources for the<br />
purpose of removing or buffering the effects of associated nutrients, sediment,<br />
organic matter, pesticides, or other pollutants prior to entry into surface waters<br />
and groundwater recharge areas. (Welsch 2007)<br />
118<br />
Wai‘ula‘ula Watershed Management Plan DRAFT MK<strong>SWCD</strong>
There are a number of streambanks within the Wai‘ula‘ula that are experiencing<br />
erosion. The most significant are along Waikoloa stream within Waimea town and along<br />
<strong>Kea</strong>nu‘i‘omanō stream from Wai‘aka bridge to Kamuela Plantations. A detailed survey<br />
of all streambanks is needed to discover the extent of the problem.<br />
Streambank erosion on Waikoloa Stream<br />
In 2004, NRCS prepared an Engineering Report for the Waimea Nature (Ulu La`au) Park<br />
(NRCS 2004), in which it conducted hydrologic and hydraulic analyses and developed<br />
alternatives for enhancing stream channel and bank stability and reducing flood-related<br />
damage to the park. The document outlines potential streambank treatments for<br />
several specific problem areas within the park.<br />
Just upstream and downstream from the Waimea Nature Park, several areas have been<br />
identified where streambank stabilization is needed in association with the proposed<br />
Waimea Trails and Greenways path. In addition, the county has identified two stream<br />
crossings for the trail that will require streambank stabilization at the ends of the<br />
headwalls and culverts.<br />
The streambanks behind and downstream of KTA shopping center are also experiencing<br />
erosion. This is the area where the stream jumped its banks during the 2004 flood<br />
event. A riparian buffer along this stream segment would help stabilize the streambank<br />
in a highly visible location in the middle of Waimea town.<br />
119<br />
Wai‘ula‘ula Watershed Management Plan DRAFT MK<strong>SWCD</strong>
4.1.5 Feral Ungulates<br />
Wild pigs and goats can contribute to polluted runoff in the Wai‘ula‘ula <strong>watershed</strong>. Feral pigs<br />
(Sus scrofa) create soil disturbances, accelerating degradation, erosion, landslides, and<br />
sedimentation. They destroy native habitat, spread seeds of weedy <strong>plan</strong>ts and eat native<br />
<strong>plan</strong>ts. They also serve as carriers and vectors of parasites and diseases, such as Leptospirosis,<br />
found in stream waters on Kohala Mountain. Feral pigs reduce and change the understory<br />
vegetation, affecting the <strong>watershed</strong> hydrology. The <strong>management</strong> of feral pigs in the forest<br />
reserve and NAR is addressed in KWP (2007) and will not be addressed under this <strong>plan</strong>.<br />
The population of wild goats (Ovis aries) in West Hawai‘i has increased dramatically over the<br />
past decade. Goats are extremely destructive herbivores that will eat nearly any type of<br />
available vegetation. These browsing ungulates are having a significant impact on the<br />
groundcover in the lower <strong>watershed</strong>. There is currently no <strong>management</strong> of these animals, and<br />
they roam freely in the <strong>watershed</strong>, moving in response to available vegetation and water<br />
sources. Goat-proof fencing will be critical to the success of any revegetation or groundcover<br />
<strong>management</strong> project proposed in the <strong>watershed</strong>.<br />
4.1.6 Invasive Plants<br />
There are numerous invasive <strong>plan</strong>ts that are well-established in the Wai‘ula‘ula <strong>watershed</strong>.<br />
These <strong>plan</strong>ts in the forested upper <strong>watershed</strong> can out-compete native <strong>plan</strong>ts for nutrients or<br />
water and quickly alter a native ecosystem by changing the vegetation. The diversity of <strong>plan</strong>ts<br />
and physical structure of the forest is lost when invasive <strong>plan</strong>ts form homogenized <strong>plan</strong>t<br />
communities. According to KWP (2007), “Many invasive <strong>plan</strong>t root structures do not hold the<br />
soil well when the <strong>plan</strong>ts form monotypic stands, which can accelerate geologic processes like<br />
erosion.... This in turn accelerates geologic erosion and decreases water quality, resulting in<br />
reef sedimentation” (p. 54).<br />
In the lower, more arid parts of the <strong>watershed</strong>, fountain grass (Pennisetum setaceum) has<br />
become a problematic <strong>plan</strong>t. It poses a major fire threat and has been designated one of<br />
Hawai‘i's most invasive horticultural <strong>plan</strong>ts by DLNR. Fountain grass is considered firepromoting,<br />
because dry fountain grass is an excellent fuel for brush fires. It is also considered<br />
fire-adapted because it can survive wildfires, where native <strong>plan</strong>ts often cannot. Wildfires strip<br />
the land of vegetation and render the thin soil susceptible to erosion through runoff, leading to<br />
sedimentation of streams and nearshore waters.<br />
4.1.7 Atmospheric Sources of Nitrogen<br />
Nitrogen is present in the atmosphere as N 2 gas (comprising about 80% of the atmosphere),<br />
other types of nitrogen-containing gases that occur in trace amounts, tiny liquid droplets<br />
containing dissolved nitrogen, and in the form of dust that includes nitrogen compounds. Rain<br />
contains nitrogen in the form of nitrate. Part of a <strong>watershed</strong>’s nitrogen input is from rain, or<br />
from so-called “dry deposition” of nitrogen-containing dust. A variety of natural (lightning) and<br />
120<br />
Wai‘ula‘ula Watershed Management Plan DRAFT MK<strong>SWCD</strong>
man-made (combustion) processes contribute to atmospheric deposition of nitrogen. The<br />
extreme temperatures on the surface of a lava flow facilitate chemical processes that change N 2<br />
gas to nitrate-rich cloud droplets (Huebert et al. 1999). The volcanic nitrate has been shown to<br />
be biologically-significant at certain locations near Kilauea Volcano, but the significance in the<br />
Wai‘ula‘ula <strong>watershed</strong> is unknown. A new eruption of <strong>Mauna</strong> Loa could increase the delivery of<br />
atmospheric nitrogen to the <strong>watershed</strong>.<br />
Another way that nitrogen can be transferred to <strong>watershed</strong>s is when <strong>plan</strong>ts (actually the<br />
bacteria on their roots) “fix” atmospheric nitrogen (turn it from a gas to forms that <strong>plan</strong>ts can<br />
use). The distribution of nitrogen-fixing <strong>plan</strong>ts, particularly crops, is therefore important. In<br />
some <strong>watershed</strong>s, it is not uncommon for atmospheric deposition to account for one-third of<br />
the nitrogen inputs and biological fixation to account for another one-third. The density and<br />
distribution of nitrogen-fixing <strong>plan</strong>ts within the <strong>watershed</strong> is therefore significant. Elsewhere<br />
on Hawai‘i Island, the spread of the nitrogen-fixing Albizia tree is affecting <strong>watershed</strong> nitrogen<br />
budgets (Atwood et al. 2010).<br />
It is estimated that human activities have doubled the amount of atmospheric nitrogen that is<br />
delivered to tropical <strong>watershed</strong>s (relative to background).<br />
4.2 Wildfire<br />
Wildfire is a significant threat in the Wai‘ula‘ula <strong>watershed</strong>. In the last decade, some part of the<br />
<strong>watershed</strong> has burned every couple of years on average, due to the recurring fire cycle and<br />
unmanaged grass fuels. Wildfires strip the land of vegetation and render the thin soil<br />
susceptible to erosion through runoff, leading to sedimentation of streams and nearshore<br />
waters. It was estimated, using the modeling tool called the Nonpoint Source Pollution and<br />
Erosion Comparison Tool (N-SPECT), that if 1,350 acres in the lower <strong>watershed</strong> burned, it could<br />
increase the load of total suspended sediments to the streams and coastal waters by 290%.<br />
The changing composition of vegetation in the <strong>watershed</strong> has contributed to an increased fire<br />
hazard. Alien grasses, such as fountain grass (Pennisetum setaceum), now dominate much of<br />
the lower <strong>watershed</strong> and are often more fire-adapted than native species and will not only<br />
carry fire well but quickly exploit suitable habitat after a fire. The area's strong, gusty winds<br />
and naturally hot and dry weather produce a climate conducive to wildfire occurrence and<br />
contribute to the rapid spread of fire. Wildfires typically start at the end of a dry cycle, and the<br />
exposed soils are most vulnerable at the onset of the wet season.<br />
There have been numerous fires within the <strong>watershed</strong> over the past five years, many of a<br />
suspicious nature (Figure 30). In September 2004, a 1,500-acre fire started south of Kawaihae<br />
Road near the egg farm and burned down to Queen Ka‘ahumanu Highway, causing the<br />
evacuation of 40 homes within the ‘Ōuli Ekahi subdivision and 16 homes in the <strong>Mauna</strong> <strong>Kea</strong><br />
U<strong>plan</strong>ds subdivision. In May and June of 2005, fires blackened 400 acres at Pu‘u Pā on Parker<br />
121<br />
Wai‘ula‘ula Watershed Management Plan DRAFT MK<strong>SWCD</strong>
Ranch lands near the Waimea Airport and 100 acres makai of Queen Ka‘ahumanu Highway just<br />
south of Kawaihae Road. In August 2005, a fire that began near the Lālāmilo Farm lots burned<br />
15,000 acres and led to the evacuation of 4,000 residents of Waikoloa Village. The fire also<br />
burned north towards Waikoloa Stream. However, the reduced fuel load from cattle grazing in<br />
the area slowed the fire considerably and kept the neighborhoods along Kawaihae Road safe.<br />
The August 2005 fire lasted days and required the collective efforts of the Hawai‘i County Fire<br />
Department, volunteer units, U.S. Army, and Hawai‘i DLNR. In late August 2005, another fire<br />
started near the Lālāmilo Farm lots, but because of favorable weather conditions and cattle<br />
grazing, it was slower-moving and more-easily contained.<br />
In July 2007, brushfires burned about 10 acres makai of Kawaihae Road near the Pu‘ukoholā<br />
Heiau National Historic Site, forcing the evacuation of residents of the Kawaihae transitional<br />
housing, and 600 acres makai of Māmalohoa Highway near the Waimea Airport. In August<br />
2007, a wind-driven brush fire burned down the slopes above Kamuela View Estates, burning<br />
approximately 170 acres. The fire, likely caused by a downed power line, came within a quarter<br />
of a mile of homes, until a fire break was cut between the flames and homes. In October 2007,<br />
a wildfire burned 550 acres near Spencer Beach Park and Mau‘umae. In July 2008, a fire burned<br />
2-1/2 acres on the south side of Kawaihae Road near mile-marker 66. Another fire burned<br />
about 35 acres near the subdivisions of Anekona and ‘Ōuli Ekahi in September 2008, causing<br />
the evacuation of some homes. While no houses were damaged, the fire came extremely close<br />
to 10 homes. In March 2010, roadside mowing operations along Kawaihae Road sparked a fire<br />
that burned 630 acres in the lower <strong>watershed</strong>. A November 2010 fire burned 130 acres within<br />
the Kanehoa subdivision, destroying an agricultural out-building, damaging a house, and<br />
resulting in the evacuation of the subdivision residents.<br />
122<br />
Sediment in the Stream Channel Following the March 2010 Wildfire<br />
Wai‘ula‘ula Watershed Management Plan DRAFT MK<strong>SWCD</strong>
Figure 30: Wai‘ula‘ula Watershed Wildfire History Map (1973-2009)<br />
Managed grazing is a tool to mitigate the risk of wildfire. Effective fine fuels <strong>management</strong> via<br />
cattle grazing has been demonstrated to slow the spread of wildfire and, therefore, reduce the<br />
surface area that is susceptible to sediment runoff. About 90% of fire starts occur along the<br />
highways bordering the <strong>watershed</strong> and away from the stream corridor. With effective grazing<br />
<strong>management</strong>, fire starts can be contained more rapidly, preventing the spread of fire to the<br />
sensitive stream corridor. This will protect water quality within Wai’ula’ula stream as well as<br />
coastal areas.<br />
While a significant portion of the <strong>watershed</strong> is used for cattle grazing, parts of the <strong>watershed</strong><br />
have historically remained ungrazed because they have not been fenced and there has been no<br />
water available for cattle. In particular, the lower <strong>watershed</strong> between 1,200-ft elevation and<br />
sea level is currently unfenced. These wildland areas, classified as Agricultural District, are the<br />
most fire-prone part of the <strong>watershed</strong>. These areas have burned several times in the past five<br />
years, leaving bare land susceptible to significant erosion. Queen Ka‘ahumanu Highway bisects<br />
123<br />
Wai‘ula‘ula Watershed Management Plan DRAFT MK<strong>SWCD</strong>
these marginal lands and Kawaihae Road follows the northern boundary, providing access for<br />
intentional and accidental fire starts.<br />
Fire-fighting within the Wai‘ula‘ula <strong>watershed</strong> is challenging. Access is difficult and, because of<br />
the concern about unexploded ordnance from WWII-era firing exercises in the area, it is<br />
normally not considered safe for firefighters to fight the fire on the ground. Rather, they are<br />
stationed around the perimeter of the fire, and the Fire Department uses helicopters to drop<br />
water on the hot spots. Bulldozers are brought in to cut fire breaks to help contain the fire and<br />
protect neighborhoods from its encroachment.<br />
Not only does fire itself damage the natural environment, but the process of fighting the fire<br />
also affects the resources of the <strong>watershed</strong>. Construction of access roads and fire breaks during<br />
a fire can create channels for future erosion. Therefore, it is critical that post-fire assessments<br />
be performed and restoration activities undertaken, preferably before available heavy<br />
equipment is released from the site following a fire.<br />
The Hawai‘i Wildfire Management Organization (HWMO) is a 501(c)(3) non-profit organization<br />
established in 2002 to protect, conserve and enhance resource values in West Hawai‘i by<br />
reducing wildfire frequency and size. The organization's goals are to develop and implement<br />
fuels <strong>management</strong> activities, to provide educational opportunities about wildfire, to conduct<br />
fuels <strong>management</strong> research, to promote the protection of native ecosystems from the effects<br />
of wildfire, and to support and facilitate a multi-faceted approach to wildfire prevention and<br />
<strong>management</strong>. Participating agencies and organizations include DLNR, Hawai‘i County Fire<br />
Department, NRCS, U.S. Fish and Wildlife Service (USFWS), U.S. Army, U.S. Forest Service,<br />
University of Hawai‘i Cooperative Extension Service (CES), MK<strong>SWCD</strong>, and affected landowners<br />
and communities.<br />
4.3 Unexploded Ordnance<br />
Between 1943 and 1953, the U.S. military used 130,000 acres of land in West Hawai‘i for<br />
training purposes (Figure 31). At least 40% of the area was used for training with live military<br />
munitions (Hawai‘i County 2008), including significant portions of the Wai‘ula‘ula <strong>watershed</strong>.<br />
Following the deactivation of Camp Tarawa and the Waikoloa Maneuver Area, the Department<br />
of Defense performed cleanup activities, consistent with the standards and technologies of that<br />
time. However, within the last decade, unexploded ordnance (UXO) has been found at several<br />
sites within Waimea and in and around Waikoloa Village. At least six people have been killed or<br />
injured by old artillery rounds since the 1940s (USACOE 2005).<br />
The Formerly Used Defense Sites (FUDS) program, administered by the U.S. Army Corps of<br />
Engineers, addresses potential risks on lands formerly owned or controlled by the Department<br />
of Defense prior to 1986 (Hawai‘i County 2008). The Waikoloa FUDS area covers 137,000 acres,<br />
of which 50,000 are considered “high risk.” Most of these high risk lands are in or adjacent to<br />
124<br />
Wai‘ula‘ula Watershed Management Plan DRAFT MK<strong>SWCD</strong>
the Wai‘ula‘ula <strong>watershed</strong>. “To date the Army Corps has cleared about 8,000 acres of land and<br />
removed approximately 1,800 pieces of live munitions” (Hawai‘i County 2008: p. 36). Live<br />
ordnance found in the area includes grenades, bazooka rounds, artillery and mortar rounds,<br />
land mines, and hedgehog missiles.<br />
As more and more of the region is undergoing development, “the Corps' FUDS team has taken<br />
an aggressive approach to reaching current and future homeowners and developers” (Hawai‘i<br />
County 2008: p. 36). Private land owners who have property in high- or moderate-risk areas<br />
that have not yet been cleared are encouraged to contact the USACOE for help in surveying the<br />
land for UXO prior to construction.<br />
Because of the risk of unexploded ordnance, the policy of the Hawai‘i County Fire Department<br />
is to not allow firefighters to access those high risk areas on-the-ground to fight wildfires.<br />
Rather, they use helicopter water drop operations, fuel breaks, and perimeter defense as a way<br />
to control wildfires in these areas.<br />
Figure 31: Formerly Used Defense Sites (FUDS) in South Kohala (from Hawai‘i County 2008)<br />
125<br />
Wai‘ula‘ula Watershed Management Plan DRAFT MK<strong>SWCD</strong>
Addressing UXO removal is beyond the scope of this <strong>watershed</strong> <strong>management</strong> project.<br />
However, implementing projects to facilitate fire-fighting without on-the-ground response that<br />
could endangered fire-fighter lives is part of the scope of this <strong>plan</strong>.<br />
4.4 Solid and Hazardous Waste<br />
The old Waimea landfill is located immediately adjacent to Waikoloa Stream, downstream of<br />
Sandalwood and adjacent to the transfer station. This unlined, 30-40-ft. deep landfill was<br />
closed in 1987 and replaced with the solid waste transfer station. It was covered with<br />
approximately two feet of soil and <strong>plan</strong>ted with grass. Inspections of the old landfill by DOH in<br />
2001 and 2002 confirmed the presence of an active underground fire (DHHL 2002). As material<br />
buried in the landfill decomposes, cracks and sinkholes have also developed in the landfill<br />
surface. The landfill is under the jurisdiction of the Hawai‘i County Department of<br />
Environmental Management. According to DHHL (2002), the County applies layers of dirt on a<br />
regular basis to suppress the smoke and particulate emissions, and fill cracks and fissures. No<br />
information is currently available on the effects of the landfill on stream water quality, though<br />
it is likely there is seepage of pollutants from the landfill into the adjacent stream. Water<br />
sampling above and below the old landfill would be necessary to determine its effects on water<br />
quality. However, addressing any effects of the landfill on water quality is beyond the scope of<br />
this <strong>watershed</strong> <strong>management</strong> <strong>plan</strong>.<br />
The County Solid Waste Division Waimea Baseyard and County Solid Waste Transfer Station are<br />
also located adjacent to Waikoloa Stream. Trash is deposited at the transfer station into<br />
enclosed containers. The containers are removed from the site when they are full, and the<br />
waste is transferred to the Pu‘uanahulu landfill. Because the transfer station is exposed to the<br />
strong trade winds, trash – usually plastic waste – often blows out of the containers downwind,<br />
where it gets caught in fences or trees and shrubs along Waikoloa Stream. This trash often<br />
ends up in Waikoloa Stream, where it is carried downstream during storm events.<br />
There are several areas within the <strong>watershed</strong> that are used as dumping grounds. There are<br />
unfenced areas in the lower <strong>watershed</strong> that are accessed by people to abandon vehicles, which<br />
are often smashed up and left to rust, spilling fluids on the ground. There are also sections of<br />
Waikoloa stream, particularly in Waimea town, where people litter regularly. Because the<br />
stream bed is usually dry, people seem to treat it as more of a “back alley” than as a natural<br />
asset to be protected. A District-sponsored stream cleanup in April 2008 netted 25 bags of<br />
trash, a foam mattress, and several large pieces of rusty metal within a ¼ mile section of stream<br />
in town. Parker School classes regularly pick up trash within the stream along the school<br />
grounds.<br />
126<br />
Wai‘ula‘ula Watershed Management Plan DRAFT MK<strong>SWCD</strong>
4.5 Flooding<br />
Flooding is not normally a threat, unless development has occurred in the floodplain. That<br />
being said, flooding has been a problem in the Waimea area for decades, as described in<br />
Section 2.2.6. During times of unusually heavy rainfall, the town of Waimea has suffered<br />
disruptive flooding. As Waimea has grown over the years, there are greater numbers of<br />
structures potentially in harm's way.<br />
Flood control structures have been built (Parker Ranch’s grassed drainage channel) and<br />
contemplated (proposed concrete channelization of Waikoloa Stream in Waimea town center).<br />
Stormwater runoff is currently managed primarily through regulation and by dry wells as a<br />
means to reduce flooding potential. As more impervious surfaces are created through<br />
increased urban and suburban development, the hardened areas prevent infiltration and<br />
generate greater volumes of stormwater runoff. While the runoff may carry relatively smaller<br />
pollutant loads, it consists of a greater volume of water, which can lead to more frequent and<br />
severe flooding. Low Impact Development (LID) techniques, a relatively new and under-utilized<br />
concept in stormwater <strong>management</strong>, can create less impervious area, generate less surface<br />
runoff, and require smaller infrastructure for drainage.<br />
4.6 Stream Diversions<br />
There are numerous permitted and unpermitted diversions within the Wai‘ula‘ula <strong>watershed</strong>.<br />
So much water is being diverted, in fact, that the <strong>watershed</strong>’s streams are no longer perennial<br />
in the lower reaches. The specific amount of water taken from each stream varies daily, and<br />
total annual withdrawal amounts are not documented.<br />
There are segments of the Wai‘ula‘ula Stream system that are sometimes dry or sometimes<br />
have water only in stagnant pools. This creates stress for aquatic life (insects, crustaceans, fish,<br />
etc.), which is particularly important given the presence of native species in the stream. Legal<br />
and illegal streamflow diversions contribute to this situation. Increases in the amount of<br />
diversions have the potential to threaten the freshwater aquatic ecosystem in certain reaches.<br />
The timing of diversions is important. Diversions during periods of low streamflow are less<br />
significant than diversions during periods of high streamflow, which native fish species are<br />
actively migrating upstream. Because of the importance of water resources, this is a potentially<br />
sensitive issue.<br />
127<br />
Wai‘ula‘ula Watershed Management Plan DRAFT MK<strong>SWCD</strong>
4.7 Climate Change<br />
There is a considerable body of evidence that the global climate has undergone change in the<br />
last 50-100 years, and the scientific consensus is that continued change is very likely. In<br />
addition to warming, the hydrological cycle is expected to intensify, with more evaporation,<br />
more precipitation, and more runoff in certain regions (Huntington 2006). Indeed, these<br />
changes have already been detected at the global scale. It is more difficult, however, to predict<br />
changes in regional hydrology (some regions could become wetter and some drier) than to<br />
predict global averages. One study of possible changes in Hawai‘i concluded that within a<br />
hundred years, rainy season rainfall could decrease and dry season rainfall could increase<br />
slightly (Timm and Diaz 2009). Another report predicts increasing temperatures, decreasing net<br />
precipitation during the winter (with concurrent decline in streamflow), in addition to<br />
increasing sea level (exacerbating high wave inundation), ocean temperatures (leading to coral<br />
bleaching), and ocean acidification (negatives effects on coral, disruption of marine food web)<br />
(HCA 2009).<br />
The specific impact to the Wai‘ula‘ula <strong>watershed</strong> is unknown. Climate change has the potential<br />
to exacerbate other threats to <strong>watershed</strong> health. The possibility of altered streamflow regimes<br />
cannot be ruled out. This would have negative impacts on freshwater availability for domestic<br />
and agricultural uses, and survival of native aquatic species. Further, temperature shifts could<br />
alter biogeochemical nutrient cycles, thereby altering stream nutrient concentrations and<br />
fluxes. Shifts in vegetation communities are possible, which could affect erosion and runoff.<br />
Given the obvious trends but the uncertainty about specific regional effects, it is important to<br />
protect ecosystems from non-climate stressors in order to promote ecosystem resilience and<br />
adaptation (HCA 2009).<br />
128<br />
Wai‘ula‘ula Watershed Management Plan DRAFT MK<strong>SWCD</strong>
Chapter 5: Recommended Management<br />
Measures<br />
The purpose of this chapter is to describe <strong>management</strong> actions that can be implemented to<br />
achieve <strong>watershed</strong> restoration and protection goals and address the existing impairments and<br />
threats described in Chapters 3 and 4. Management actions are typically groups of<br />
<strong>management</strong> practices – both structural and non-structural – that have the greatest likelihood<br />
of achieving <strong>watershed</strong> goals, treating sources of pollutants in the <strong>watershed</strong> and types of<br />
impairments found, and achieving the amount of load reduction needed.<br />
This <strong>plan</strong> focuses efforts primarily in the riparian corridor and on the land immediately adjacent<br />
to the riparian zone because these areas most directly impact the quality of the stream and<br />
nearshore waters and habitats. Riparian corridors are considered critical areas within a<br />
<strong>watershed</strong> because they serve as buffer strips, trapping and filtering pollutants, stabilizing<br />
streambanks, and attenuating effects of high flows and volumes. Riparian corridors also<br />
provide habitat for wildlife and can provide various economic, recreational and aesthetic<br />
opportunities for landowners. A well-functioning corridor consists of a variety of <strong>plan</strong>t species<br />
and vegetative covers. The goals, objectives, and recommended actions contained in this<br />
chapter support the <strong>plan</strong>’s overall goal to maintain healthy stream and riparian environments,<br />
both in terms of water quality and habitat integrity, that sustain a healthy mauka-makai<br />
connection and promote community-based environmental stewardship.<br />
Polluted runoff comes from a large number of sources that vary in size and impact on water<br />
quality. Degradation of a waterbody results from the cumulative effect of pollutants from<br />
these sources. This <strong>watershed</strong> <strong>management</strong> <strong>plan</strong> describes a coordinated program of effective<br />
actions to be implemented to prevent and abate polluted runoff within the <strong>watershed</strong>, as well<br />
as address other threats that have a direct impact of overall <strong>watershed</strong> health and habitat<br />
integrity. As noted in Section 1.2, <strong>management</strong> strategies were developed using the Guidance<br />
Specifying Management Measures for Sources of Nonpoint Pollution in Coastal Waters (EPA<br />
1993) and the Updated Management Measures for Hawai‘i’s Coastal Nonpoint Pollution Control<br />
Program (CNPCP) (Stewart 2009). See Appendix B for a list of relevant <strong>management</strong> measures.<br />
As part of the <strong>plan</strong>ning process, the relevant <strong>management</strong> measures provided a starting point<br />
to help with development of goals and objectives for the Wai‘ula‘ula <strong>watershed</strong> and<br />
recommended actions (“best <strong>management</strong> practices” or BMPs) to achieve those goals and<br />
objectives. While there are 50 <strong>management</strong> measures within Hawai‘i’s CNPCP, only 24 apply to<br />
the land uses in the Wai‘ula‘ula <strong>watershed</strong>: 5 for agriculture; 12 for urban areas; 4 for<br />
hydromodifications 8 ; and 3 for wetlands and riparian areas. Table 17 lists these <strong>management</strong><br />
measures and notes the implementing projects that relate to each.<br />
8 Hydromodification means an “alteration of the hydrologic characteristic of coastal and non-coastal<br />
waters, which in turn could cause degradation of water resources” (EPA 1993; p. 6-90).<br />
129<br />
Wai‘ula‘ula Watershed Management Plan DRAFT MK<strong>SWCD</strong>
Table 17: Management Measures Applicable to the Waiulaula Watershed<br />
Management Measures<br />
Applicable<br />
to<br />
Watershed?<br />
Implementing Projects<br />
AGRICULTURE<br />
Erosion and Sediment Control Yes NUTR-1, 2; SED-1, 2, 3;<br />
FIRE-1, 2, STREAM-1<br />
Wastewater & Runoff from Confined Animal Facilities No<br />
Nutrient Management Yes NUTR-1, 2; SED-2,<br />
STREAM-1<br />
Pesticide Management Yes NUTR-1, SED-1<br />
Grazing Management Yes NUTR-2, SED-2, 3; FIRE-1,<br />
2; STREAM-1<br />
Irrigation Water Management Yes NUTR-1, SED-1, 2<br />
FORESTRY<br />
(10 <strong>management</strong> measures) No<br />
URBAN<br />
New Development Yes STORM-4, 5, 6; STREAM-4<br />
Watershed Protection Yes NUTR-3, 4; SED-4, FIRE-3,<br />
4, 5; STORM-1 through 6;<br />
STREAM-2,3,4<br />
Site Development Yes STORM-1, 2, 3, 4, 6;<br />
STREAM-2, 4<br />
Existing Development Yes NUTR-3, 4; FIRE-3, 5;<br />
STORM-2, 4, 6; STREAM 4<br />
New On-Site Disposal Systems (OSDS) Yes STORM 6<br />
Operating OSDS Yes NUTR-3, 4<br />
Pollution Prevention Yes NUTR-3, 4; FIRE-5;<br />
STORM-1 through 6;<br />
STREAM 2, 3, 4;<br />
Golf Course Management Yes STREAM 3, 4; MONIT-1<br />
Planning, Siting, & Developing Roads and Highways Yes STORM-5, 6<br />
Bridges Yes STORM-4, 5, 6<br />
Operation & Maint. of Roads, Highways, Bridges Yes STORM-5, 6<br />
Road, Highway, and Bridge Runoff Systems Yes STORM-4, 5, 6<br />
MARINAS and RECREATIONAL BOATING<br />
(15 <strong>management</strong> measures) No<br />
HYDROMODIFICATIONS<br />
Channelization and Channel Modification<br />
Physical & Chem. Characteristics of Surface Waters<br />
Yes STORM 2, 4; STREAM-3,<br />
4; AQU-1, 3; MONIT-1<br />
Instream and Riparian Habitat Restoration Yes STREAM-1, 3, 4; AQU-1, 3<br />
Dams<br />
Protection of Surface Water Quality and Instream and Yes STREAM-3, 4; AQU-1, 3<br />
Riparian Habitat<br />
130<br />
Wai‘ula‘ula Watershed Management Plan DRAFT MK<strong>SWCD</strong>
Management Measures<br />
Streambank and Shoreline Erosion<br />
Eroding Streambanks and Shorelines<br />
Applicable<br />
to<br />
Watershed?<br />
Implementing Projects<br />
Yes STREAM-1, 3, 4; AQU-1<br />
WETLANDS, RIPARIAN AREAS, and VEGETATED TREATMENT SYSTEMS<br />
Protection of Wetlands and Riparian Areas Yes STREAM-1, 3, 4; AQU-1<br />
Restoration of Wetlands and Riparian Areas Yes STREAM-1, 3, 4; AQU-1<br />
Vegetated Treatment Systems Yes STREAM-1, 3, 4; AQU-1<br />
The <strong>watershed</strong> <strong>management</strong> <strong>plan</strong> also addresses EPA's 9 key elements for <strong>watershed</strong>-based<br />
<strong>plan</strong>s that EPA believes are critical for achieving improvements in water quality. All projects<br />
that apply for Section 319(h) funding under the Clean Water Act and administered by the<br />
Hawai‘i Department of Health must include nine key elements in their <strong>watershed</strong>-based <strong>plan</strong>s.<br />
Appendix C lists these 9 required elements and indicates where each is addressed in the<br />
Wai‘ula‘ula <strong>watershed</strong> <strong>management</strong> <strong>plan</strong>.<br />
This chapter lays out <strong>watershed</strong> restoration and protection goals and objectives, as well as<br />
recommended projects and tasks to address the goals and objectives. This chapter identified<br />
implementing measures that will have the greatest likelihood of achieving the stated <strong>watershed</strong><br />
goals. Under each goal, there is a brief description of the problem to be addressed, estimated<br />
pollutant load reductions expected, and a table listing criteria by which to measure success in<br />
achieving that particular goal, followed by one or more measurable objectives. Under each<br />
objective there are one or more projects to implement the objective. Under each project there<br />
is a list of tasks, which are interim measurable milestones to gauge progress toward project<br />
implementation. Table 19 summarizes these projects. Worksheets for each project are<br />
provided in Appendix A, summarizing project tasks, implementation timeframe and schedule,<br />
pollutant load reduction estimates (if applicable), responsible entity and project partners, and<br />
an estimation of costs and technical assistance. Table 20 outlines the timelines for project<br />
implementation. Project timeframes and schedules assume a start date of 2012 for <strong>plan</strong><br />
implementation.<br />
The projects proposed in the Wai‘ula‘ula Watershed Management Plan were prioritized based<br />
on relative scores generated against a set of criteria. These criteria were developed by the<br />
<strong>plan</strong>ning team from information gathered by stakeholders and input from agency<br />
representatives. Criteria used to evaluate and prioritize projects include 1) total load reduction;<br />
2) significance as a pollution source; 3) ease of implementation; 4) feasibility of project costs;<br />
5) level of stakeholder buy-in; 6) severity of the threat addressed by the project; 7) the area of<br />
impact from the project; and 8) its relevance to <strong>management</strong> measures and <strong>plan</strong> objectives.<br />
Each of the proposed projects was evaluated against the eight criterion and assigned a value<br />
between one and three, for a total possible score of 24. A value of "3" given for project cost<br />
feasibility, for instance, would mean that the project cost totals less than $25,000; "2" would<br />
represent a project cost between $25,000 and $100,000, and a "1" would be given to a project<br />
131<br />
Wai‘ula‘ula Watershed Management Plan DRAFT MK<strong>SWCD</strong>
costing over $100,000. For total load reduction, a "3" represents a direct relationship or a<br />
significant load reduction, a "2" would be indirectly related or an assumption that loads would<br />
be somewhat reduced, and a "1" would be given to a project with no relevance to load<br />
reduction or would not result in load reduction.<br />
The results of this prioritization process placed the projects in high, medium, or low priority<br />
levels for implementation (Table 18), and their respective implementation schedules are based<br />
on their cumulative scores for each criterion. Some projects were moved up in priority as their<br />
implementation is prerequisite to projects in other priority levels. While these are the priority<br />
levels as proposed at the finalization of this <strong>management</strong> <strong>plan</strong>, projects assigned a lower<br />
priority may be implemented sooner if project funding or grant opportunities become available,<br />
or new information elevates a project's urgency. The implementation schedule for priority level<br />
1 is from 0 to 5 years, priority level 2 from 6 to 10 years, and priority level 3 between 11 and 15<br />
years. Monitoring the overall implementation of the Wai‘ula‘ula <strong>watershed</strong> <strong>management</strong> <strong>plan</strong><br />
on an ongoing basis will determine if the proposed priority levels are relevant over the <strong>plan</strong>ning<br />
horizon of 15 years, and, if they are not, they shall be adjusted accordingly.<br />
132<br />
Wai‘ula‘ula Watershed Management Plan DRAFT MK<strong>SWCD</strong>
Table 18: Priority Levels for Projects in the Wai‘ula‘ula Watershed Management Plan<br />
Priority Level 1 Projects<br />
(1-5 years)<br />
NUTR-2: Fence riparian areas to<br />
exclude cattle<br />
NUTR-3: OSDS education and<br />
outreach<br />
SED-2: Extend Waimea Irrigation<br />
System to lower <strong>watershed</strong><br />
SED-3: Divide large paddocks in<br />
grazing areas<br />
SED-4: Assess streambank<br />
erosion<br />
SED-5: Remove goats between<br />
rock wall and Queen K<br />
FIRE-1: Fence large grassdominated<br />
area above Queen<br />
K to manage fine fuels with<br />
cattle grazing<br />
FIRE-3: Update fire resources<br />
maps<br />
FIRE-4: Develop agreements for<br />
access and water use<br />
FIRE-6: Develop post-fire<br />
restoration manual<br />
STORM-1: Survey and line catch<br />
basins within the <strong>watershed</strong><br />
STORM-3: Stormwater educ and<br />
outreach program<br />
STORM-6: Develop & implement<br />
LID outreach program<br />
STREAM-2: Educational events/<br />
projects to educate about<br />
riparian buffers<br />
AQU-4: Invasive aquatic species<br />
control<br />
EDU-1: Develop/ adapt<br />
educational materials<br />
EDU-2: Provide on-the-ground<br />
svc learning opportunities<br />
ADMIN-1: Wai‘ula‘ula<br />
Watershed Coordinator<br />
MONIT-1: Implement monitoring<br />
program<br />
Priority Level 2 Projects<br />
(6 to 10 years)<br />
NUTR-1, SED-1: Assist Farmers in<br />
Lālāmilo Farm Lots with<br />
Conservation Plans<br />
NUTR-4: Incorporate point-ofsale<br />
inspections of OSDS<br />
SED-6: Remove goats below<br />
Queen K<br />
FIRE-2: Fence large grassdominated<br />
area below Queen<br />
K to manage fine fuels<br />
FIRE-5: Construct and maintain<br />
fuel breaks<br />
STORM-2: Dry well insert<br />
installation and maintenance<br />
program<br />
STREAM-1: Convert marginal<br />
grazing lands into native<br />
vegetation via CREP<br />
STREAM-3: Restore riparian<br />
areas within the <strong>watershed</strong><br />
STREAM-4: Policy language for<br />
overlay district that protects<br />
wetlands and riparian areas<br />
AQU-1: Remove illegal diversions<br />
AQU-2: Evaluate need for specific<br />
instream flow standards<br />
AQU-3: Determine the effects of<br />
dams on ‘o‘opu habitat<br />
AQU-5: Protect priority instream<br />
perennial pools<br />
EDU-1: Develop/ adapt<br />
educational materials<br />
EDU-2: Provide on-the-ground<br />
service learning<br />
opportunities<br />
ADMIN-1: Wai‘ula‘ula Watershed<br />
Coordinator<br />
MONIT-1: Implement monitoring<br />
program<br />
Priority Level 3 Projects<br />
(11-15 years)<br />
SED-7: Identify and revegetate<br />
bare land in <strong>watershed</strong><br />
STORM-4: Upgrade existing<br />
runoff control structures<br />
STORM-5: Develop operation<br />
and maintenance guidelines<br />
for County roads<br />
EDU-1: Develop/ adapt<br />
educational materials<br />
EDU-2: Provide on-the-ground<br />
service learning<br />
opportunities<br />
ADMIN-1: Wai‘ula‘ula Watershed<br />
Coordinator<br />
MONIT-1: Implement monitoring<br />
program<br />
133<br />
Wai‘ula‘ula Watershed Management Plan DRAFT MK<strong>SWCD</strong>
Goal 1: Reduce nutrient loads in the Wai‘ula‘ula <strong>watershed</strong>.<br />
In the limited water quality monitoring undertaken for this <strong>management</strong> <strong>plan</strong>, results indicated<br />
water quality impairment with respect to nutrient loads. Nitrate concentrations in Waikoloa<br />
Stream below Waimea town slightly exceeded state water quality standards, while the TP<br />
concentration was nearly twice the allowable amount. Further downstream just above the<br />
mouth of the Wai‘ula‘ula <strong>watershed</strong>, TN concentrations were double the allowable amount. In<br />
the nearshore waters, ammonia concentrations were 2.8 times the water quality standard and<br />
chlorophyll-a concentrations were double. All other nutrients measured at the various stations<br />
were within allowable limits.<br />
The following table provides criteria to measure success in achieving this <strong>watershed</strong> and<br />
ecosystem health goal.<br />
Indicators<br />
Targeted load, level or value<br />
Total Phosphorus (TP)<br />
By 2025, the geometric mean of<br />
measurements for all water quality indicators<br />
Total Nitrogen (TN)<br />
shall be less than water quality standards for<br />
the dry season in any year and at any sampling<br />
site.<br />
Ammonia – mouth of <strong>watershed</strong> only<br />
By 2025, the difference between upstream<br />
Dissolved Oxygen (DO)<br />
values and downstream values for all water<br />
Nitrate<br />
quality indicators in any year and for every<br />
Chlorophyll-a<br />
upstream/ downstream sampling pair shall be<br />
indistinguishable from zero according to a<br />
paired t-test.<br />
Linear feet of riparian corridor excluded from<br />
cattle<br />
By 2025, fence 58,000-ft. of riparian corridor<br />
in the grazing area between 1,200-ft. and<br />
2,600-ft. elevation along <strong>Kea</strong>nu‘i‘omanō and<br />
Waikoloa streams.<br />
Objective 1a: Reduce nutrient loads in agricultural runoff from Lālāmilo Farm Lots by 20% by<br />
2019.<br />
The Lālāmilo Farm Lots are located adjacent to and upslope of Waikoloa Stream. While<br />
conservation <strong>plan</strong>ning is an effective tool for ensuring that agricultural operations do not have a<br />
negative impact on a <strong>watershed</strong>’s natural resources, only 94 acres (or 15%) of the Wai‘ula‘ula<br />
<strong>watershed</strong>’s farmlands are currently covered by a <strong>plan</strong>. These lands are a mix of crop<br />
agriculture, with regular tilling of the fields, and greenhouses, buildings, and other areas that<br />
could still benefit from conservation <strong>plan</strong>s to address stormwater runoff. Farmers may not<br />
know that MK<strong>SWCD</strong> and NRCS can provide technical expertise free-of-charge to assist them in<br />
identifying immediate or potential resource problems and developing a conservation <strong>plan</strong> to<br />
address those problems. Recognizing that conservation <strong>plan</strong>ning is a voluntary action taken by<br />
agricultural operators, outreach into the agricultural community is important first step.<br />
134<br />
Wai‘ula‘ula Watershed Management Plan DRAFT MK<strong>SWCD</strong>
Through outreach, the benefits of conservation <strong>plan</strong>ning to the land and to the productivity,<br />
sustainability and profitability of farm operations can be explained.<br />
Current nutrient loads from the Lālāmilo Farm Lots estimated through N-SPECT analysis are<br />
290 kg/yr for nitrogen and 40 kg/yr for phosphorus.<br />
Project NUTR-1. Assist farmers in Lālāmilo Farm Lots with the development and<br />
implementation of Conservation Plans to reduce polluted runoff. This project<br />
also addresses objectives for sediment control and stormwater <strong>management</strong>.<br />
Project Tasks:<br />
• Identify all active and inactive agricultural producers by TMK in the Lālāmilo<br />
Farm Lots.<br />
• Conduct outreach to active producers about developing a conservation <strong>plan</strong><br />
for their operations or expanding upon existing <strong>plan</strong>s, targeting producers<br />
closest to the stream or with obvious resource concerns.<br />
• Execute cooperator agreements with at least three additional producers or<br />
covering at least 200 additional acres.<br />
• Assist cooperators in identifying possible cost-share opportunities for best<br />
<strong>management</strong> practice implementation.<br />
• Follow-up with cooperators to track implementation of BMPs.<br />
Objective 1b: Fence 58,000-ft. of riparian corridors on <strong>Kea</strong>nu‘i‘omanō Stream to exclude<br />
livestock from streams by 2023 (relates to Project STREAM-1).<br />
At this time, there are two primary grazers of the <strong>watershed</strong>'s rangelands: Parker Ranch in the<br />
mauka area and FR Cattle Co. in the marginal lands. Much of the grazing land is owned by the<br />
State of Hawai‘i (DLNR and DHHL) and leased to the ranchers. While these lands are being<br />
grazed under existing conservation <strong>plan</strong>s, improvements can still be made. Infrastructure is<br />
limited, with more fencing to reduce paddock size and watering facilities needed. In some<br />
areas, cattle are accessing streams for water because there are no other sources of water<br />
available, causing streambank erosion and adding nutrients and pathogens to the stream<br />
system.<br />
Project NUTR-2. Work with Parker Ranch and FR Cattle Co. to fence critical riparian areas that<br />
cattle are currently using to access water. This project will also address<br />
pathogens and sediment loads from eroding streambanks caused by cattle<br />
trampling.<br />
Project Tasks:<br />
• Identify stream segments used by cattle for watering and prioritize based<br />
on critical resources, environmental impact, availability of alternative water<br />
sources, and continuity among stream segments.<br />
135<br />
Wai‘ula‘ula Watershed Management Plan DRAFT MK<strong>SWCD</strong>
• Work with land users to develop alternative water sources (troughs) for<br />
cattle away from stream (see Project SED-2).<br />
• Once alternative water sources are developed, limit livestock access by<br />
installing fence.<br />
Objective 1c: Increase inspections and maintenance (pumping) of onsite wastewater disposal<br />
systems (OSDS) within the <strong>watershed</strong> by 20% by 2019.<br />
The majority of homes and businesses in the Wai‘ula‘ula <strong>watershed</strong> are using onsite<br />
wastewater disposal systems (OSDS), either a cesspool or septic system, which are effective<br />
over the long-term only if they are properly sited, designed, operated and maintained.<br />
According to Ogata (2009), “many of these systems are at or past their designed lifetimes and<br />
are operated by owners with little knowledge of the basic workings/ maintenance requirements<br />
of their system” (p. 1). At this time, there is no map or electronic document that identifies type<br />
of wastewater treatment system by TMK within the <strong>watershed</strong>. Therefore, it is currently not<br />
possible to assess the effects of OSDS on water quality.<br />
Project NUTR-3. By 2016, educate home owners about proper operation and maintenance of<br />
OSDS and the effects of failing OSDS on water quality, public health, and<br />
environmental conditions.<br />
Project Tasks:<br />
• Inventory and map type of wastewater system by TMK and year installed,<br />
focusing first on areas adjacent to the streams within the <strong>watershed</strong>.<br />
• Conduct risk assessment to highlight potential critical areas based on<br />
density on OSDS, average age of systems, proximity to stream or floodplain.<br />
• Compile information required by Section 11-62-62, HAR, and received by<br />
DOH from wastewater pumpers in the <strong>watershed</strong>, including number of<br />
systems pumped, location by TMK, type of OSDS, date, and volume.<br />
• During baseflow periods, monitor above and below potential problem areas<br />
on a quarterly basis for two years to look for onsite waste signals.<br />
Parameters to be monitored include TN, TP, and c. perfringens.<br />
• Develop or adapt outreach materials about OSDS and potential effects on<br />
water quality and environmental and public health.<br />
• Distribute information to homeowners with OSDS about the operation,<br />
maintenance, and self-inspection of cesspools and septic systems as a way<br />
to extend their operating lives and prevent failures.<br />
136<br />
Wai‘ula‘ula Watershed Management Plan DRAFT MK<strong>SWCD</strong>
Project NUTR-4. Work with local realtors and lenders to establish voluntary point-of-sale<br />
inspections of OSDS in critical areas of the <strong>watershed</strong> by 2017.<br />
Project Tasks:<br />
• Meet with local realtors and lenders to discuss the importance of OSDS<br />
inspections to protect both buyer and seller from conflicts arising from<br />
failing OSDS, and to gage interest and level of cooperation.<br />
• Develop process for third party inspection of OSDS at time of sale.<br />
• Develop or adapt form to disclose, at time of property sale, type of OSDS,<br />
location, when it was last pumped, known operational defects, date of last<br />
inspection and inspector name, system design and plumbing information,<br />
and any special monitoring or maintenance needs.<br />
Goal 2: Prevent an increase in sediment loads in the Wai‘ula‘ula <strong>watershed</strong>.<br />
As measured through limited water quality monitoring, sediment loads throughout the<br />
<strong>watershed</strong> meet State water quality standards, though sediment concentrations below Waimea<br />
are just slightly below the threshold level. Sediment pulses into the ocean are likely to be<br />
episodic in nature, following fire or other land disturbances that precede a major storm event.<br />
In contrast to the adjacent Pelekane <strong>watershed</strong> -- which generates sediment concentrations in<br />
runoff that exceed the water quality standard by two orders of magnitude because it has been<br />
denuded by an unfortunate combination of fire, overgrazing, and drought – the Wai‘ula‘ula<br />
<strong>watershed</strong> has generally maintained decent ground cover. A goal of this <strong>plan</strong> is to prevent<br />
wildfire, overgrazing and other land disturbances that would strip the land of vegetation and<br />
render the thin soil susceptible to erosion.<br />
The following table provides criteria to measure success in achieving this <strong>watershed</strong> and<br />
ecosystem health goal.<br />
Indicators<br />
Targeted load, level or value<br />
Turbidity<br />
By 2025, the geometric mean of<br />
measurements for all water quality indicators<br />
shall be less than water quality standards for<br />
Total Suspended Sediment (TSS)<br />
the dry season in any year and at any sampling<br />
site.<br />
By 2025, the difference between upstream<br />
values and downstream values for all water<br />
quality indicators in any year and for every<br />
upstream/ downstream sampling pair shall be<br />
indistinguishable from zero according to a<br />
paired t-test.<br />
Erosion Rate<br />
Statistically-significant reduction in erosion<br />
rates over 67% of erosion pins<br />
Number of goats<br />
Reduce goats in fenced areas of <strong>watershed</strong> by<br />
80%<br />
137<br />
Wai‘ula‘ula Watershed Management Plan DRAFT MK<strong>SWCD</strong>
Objective 2a: Reduce sediment loads in agricultural runoff from Lālāmilo Farm Lots by 20% by<br />
2019.<br />
Current sediment loads from the Lālāmilo Farm Lots estimated through N-SPECT analysis are<br />
10,900 kg/yr.<br />
Project SED-1. Assist farmers in Lālāmilo Farm Lots with the development and implementation<br />
of Conservation Plans to reduce polluted runoff. (Implement concurrently with<br />
Project NUTR-1 above.)<br />
Objective 2b: By 2020, improve grazing efficiency 9 as a way to prevent overgrazing and limit<br />
wildfire size to an average of 100 acres burned per year in the fire prone area between 1,200-<br />
ft. and 2,600-ft. elevation.<br />
A high percentage of land in the <strong>watershed</strong> - both prime kikuyu land and marginal land - is used<br />
for grazing (about 8,000 acres). A significant amount of this grazing land is considered marginal.<br />
With sufficient rainfall, these marginal lands can support cattle production. During dry<br />
conditions, grazing in these areas is seasonal at best, with cattle grazing for a short time when<br />
the grass is green following a rain event. However, it is important to graze these marginal<br />
lands; otherwise, without periodic grazing, the resulting tall, dry grasses would present a<br />
significant fire hazard to the numerous adjacent residential communities.<br />
While the primary grazers, Parker Ranch and FR Cattle Co., have conservation <strong>plan</strong>s with the<br />
<strong>Mauna</strong> <strong>Kea</strong> Soil and Water Conservation District, improvements can still be made to encourage<br />
cattle to graze the land more evenly, rather than concentrate on specific locations or grass<br />
species. In addition, infrastructure is limited or non-existent in some areas, with more fencing<br />
to reduce paddock size and watering facilities needed.<br />
N-SPECT modeling suggests that if the grazed area between 1,200-ft. and 2,600-ft. elevation<br />
were to burn (5,550 acres), sediment loads would increase sevenfold (3,613 to 26,867 kg/yr.).<br />
Phosphorus loads would more than double (189 to 417 kg/yr.) and Nitrogen loads would more<br />
than triple (1,085 to 3,373 kg/yr.).<br />
Project SED-2. By 2013, extend the Waimea Irrigation Water System from Lālāmilo Farm Lots<br />
to the rock wall at the 1,200-ft. elevation.<br />
Surface water from outside the Wai‘ula‘ula <strong>watershed</strong> is transported into the <strong>watershed</strong> for use<br />
by farmers in the Lālāmilo Farm Lots. Surface water from windward Kohala streams is diverted<br />
into the Upper Hāmākua Ditch to the Hawai‘i Department of Agriculture’s Waimea Irrigation<br />
Water System’s 60 MG Waimea and 100 MG Pu‘u Pulehu reservoirs. This system provides<br />
9 Grazing efficiency is the percentage of forage produced that animals actually consume (versus trample, soil and<br />
reject).<br />
138<br />
Wai‘ula‘ula Watershed Management Plan DRAFT MK<strong>SWCD</strong>
irrigation water to farmers in both Pu‘ukapu and Lālāmilo. While crop agriculture receives<br />
priority for use of the water, grazers may also use this agricultural water.<br />
Project Tasks:<br />
• Develop an agreement between the Hawai‘i Department of Agriculture<br />
Waimea Irrigation Water System and MK<strong>SWCD</strong> to extend irrigation water<br />
pipeline from the Lālāmilo Farm Lots to the rock wall at the 1,200-ft.<br />
elevation, a distance of six miles. (This land is all zoned for agricultural<br />
use.)<br />
• Design a water conveyance system that meets NRCS standards and<br />
specifications.<br />
• Install pipeline and water tanks, as needed, to store water for cattle use<br />
during dry times.<br />
• Water users of the pipeline will pay the agricultural water rate through<br />
individual metering.<br />
• Use of water from the pipeline will be limited to the agricultural and<br />
revegetation projects proposed in the <strong>watershed</strong> <strong>management</strong> <strong>plan</strong><br />
(Projects NUTR-2, SED-3, SED-7, FIRE-1, STREAM-1, STREAM-3).<br />
Project SED-3. Sub-divide large paddocks in the wildfire prone area between Lālāmilo and the<br />
rock wall at 1,200-ft. elevation into smaller paddocks by 2016 to improve<br />
grazing efficiency of fine fuels.<br />
Project Tasks:<br />
• Work with land user to design an improved rotational grazing system that<br />
meets NRCS standards and specifications as part of the land user’s<br />
conservation <strong>plan</strong>.<br />
• Install approximately 5 miles of additional fence to sub-divide existing<br />
paddocks in order to achieve even grazing throughout paddocks.<br />
• Use water storage and conveyance system developed under Project SED-2<br />
to convey water into the new paddocks. Assist land user in securing a<br />
permit to withdraw water from <strong>Kea</strong>nu‘i‘omanō Stream as a back-up supply<br />
in the event of low flows from the Waimea Irrigation Water System.<br />
• Conduct bi-weekly stubble height monitoring when cattle are present as a<br />
<strong>management</strong> tool to determine when cattle should be rotated out of<br />
paddocks, based on the minimum heights established under NRCS’s<br />
standards and specifications.<br />
• Monitor long-term changes in erosion rates from these lands, using erosion<br />
pin monitoring described under Chapter 6 “Monitoring”.<br />
139<br />
Wai‘ula‘ula Watershed Management Plan DRAFT MK<strong>SWCD</strong>
Objective 2c: By 2016, assess 100% of the <strong>watershed</strong>’s riparian corridors to identify eroding or<br />
unstable streambanks and monitor at least 10 sites over 3 years to determine annual erosion<br />
rates.<br />
While site visits and anecdotal information suggest there are eroding streambanks within the<br />
<strong>watershed</strong>, no comprehensive survey has been conducted to document the location, extent,<br />
cause, and sediment-load contribution of such erosion. Fixing streambank erosion problems<br />
will be a long-term undertaking. In the near-term, MK<strong>SWCD</strong> will identify potential problem<br />
areas and monitor actual erosion rates from representative streambanks. With this additional<br />
information in hand, MK<strong>SWCD</strong> will be able to develop actions to address eroding streambanks<br />
that are contributing to the sediment load in the <strong>watershed</strong>.<br />
Project SED-4. Identify eroding and unstable streambanks and install erosion pins in<br />
representative sites to monitor annual erosion rates.<br />
Project Tasks:<br />
• Conduct stream corridor assessment by 2013 to identify and map locations<br />
of a variety of environmental problems including streambank erosion and<br />
instability (see Chapter 6 “Monitoring”). (This assessment tool will need to<br />
be developed/ adapted for Hawai‘i’s stream systems first.)<br />
• For representative eroding streambanks at various elevations within the<br />
<strong>watershed</strong>, install erosion pins (see Chapter 6 “Monitoring”) to measure<br />
annual rate of erosion. A minimum of 10 sites will be selected and<br />
monitored over a 3-year period.<br />
• Given the findings of stream corridor assessment and erosion pin<br />
monitoring, a prioritized list of needed <strong>management</strong> actions for<br />
streambank stabilization and restoration will be developed.<br />
• Stabilize and restore high priority streambanks that are severely eroding<br />
using dormant <strong>plan</strong>tings, vegetative materials, stone structures and other<br />
low-cost techniques. (project costs and timeframes TBD)<br />
Objective 2d: Following fencing projects (FIRE-1 and FIRE-2), remove all feral goats from the<br />
lower <strong>watershed</strong> (rock wall down to the coast) by 2020.<br />
The population of wild goats (Capra hircus) in West Hawai‘i has increased dramatically over the<br />
past decade. Goats are extremely destructive herbivores that will eat nearly any type of<br />
available vegetation. These browsing ungulates are having a significant impact on the<br />
groundcover in the lower <strong>watershed</strong>, stripping certain areas of vegetation and rendering these<br />
areas susceptible to erosion. There is currently no <strong>management</strong> of these animals, and they<br />
roam freely in the <strong>watershed</strong>, moving in response to available vegetation and water sources.<br />
140<br />
Wai‘ula‘ula Watershed Management Plan DRAFT MK<strong>SWCD</strong>
Project SED-5. Remove feral goats from the lower <strong>watershed</strong> between Queen Ka‘ahumanu<br />
Highway and the rock wall at the 1,200-ft. elevation by 2014.<br />
Project Tasks:<br />
• In coordination with Project FIRE-1, ensure fence constructed in lower<br />
<strong>watershed</strong> between Queen Ka‘ahumanu Highway and the rock wall is “goat<br />
proof” (extra strands of barbed wire at top, mesh covering gates, no large<br />
gaps at ground).<br />
• Work with land owners to develop and implement feral ungulate removal<br />
program.<br />
Project SED-6. Remove goats from lower <strong>watershed</strong> below Queen Ka‘ahumanu Highway by<br />
2020. This project would only occur following the fencing of this area under<br />
Project FIRE-2.<br />
Project Tasks:<br />
• In coordination with Project FIRE-2, ensure fence in lower <strong>watershed</strong><br />
between the coast and Queen Ka‘ahumanu Highway is “goat proof”.<br />
• Work with land owners to develop and implement a feral ungulate removal<br />
program.<br />
Objective 2e: By 2022, restore 25% of bare land in the <strong>watershed</strong> contributing to erosion,<br />
using techniques described in the post-fire restoration manual (Project FIRE-6).<br />
There are several areas within the <strong>watershed</strong> that have been rendered bare land for a variety of<br />
reasons, including recent fire, intentional land clearing, demolition, change in land use and<br />
other causes. These areas are particularly susceptible to erosion and sedimentation of streams<br />
and nearshore waters.<br />
Project SED-7. Identify and re-vegetate 25% of priority bare land contributing to sediment<br />
load in the <strong>watershed</strong> by 2022.<br />
Project Tasks:<br />
• Survey and map all significant bare areas within the <strong>watershed</strong>, noting<br />
proximity to a stream and whether they are hydrologically-connected to a<br />
stream, cause of de-vegetation (fire, overgrazing, land disturbance, etc.),<br />
and infiltration rate of soil (will determine what size storm event will cause<br />
runoff from area).<br />
• Select priority areas for restoration based on above information and<br />
develop implementation <strong>plan</strong> and schedule.<br />
• Install erosion pins (see Chapter 6 “Monitoring”) in priority areas to<br />
measure annual rate of erosion before and after restoration activities. At<br />
least one erosion pin grid will be installed per area and monitoring for at<br />
141<br />
Wai‘ula‘ula Watershed Management Plan DRAFT MK<strong>SWCD</strong>
least one year before restoration and for at least five years following<br />
restoration.<br />
• Using practices described in the post-fire restoration manual (Project FIRE-<br />
6), restore priority bare land contributing to sediment load in the <strong>watershed</strong><br />
(project costs and timeframes TBD).<br />
Goal 3: Reduce wildfire occurrences and associated impacts to water quality and ecosystem<br />
health.<br />
Wildfire is a significant threat in the Wai‘ula‘ula <strong>watershed</strong>. In the past decade, some part of<br />
the <strong>watershed</strong> has burned every couple of years on average, due to the recurring fire cycle and<br />
unmanaged grass fuels. The accumulation of unmanaged fine fuels (grasses) is a recurring<br />
threat for devastating wildfires that strip the land of vegetation and render the thin soil<br />
susceptible to erosion through runoff, leading to sedimentation of streams and nearshore<br />
waters.<br />
The changing composition of vegetation in the <strong>watershed</strong> has contributed to an increased fire<br />
hazard. The alien grasses that now dominate much of the lower <strong>watershed</strong> are more fireadapted<br />
than native species and will not only carry fire well but quickly exploit suitable habitat<br />
after a fire. The area's strong, gusty winds and naturally hot and dry weather produce a climate<br />
conducive to wildfire occurrence and contribute to the rapid spread of fire. Wildfires typically<br />
start at the end of a dry cycle, and the exposed soils are most vulnerable at the onset of the wet<br />
season.<br />
There are a number of fuels mitigation techniques used in Hawai‘i and on the continental<br />
United States to reduce or modify the size, arrangement, and kind of vegetative fuels. These<br />
techniques include: mechanical removal (fuel break treatment), prescribed burn (landscapescale),<br />
herbicide (fuel break treatment), and grazing (landscape-scale).<br />
Cattle grazing is arguably one of the most valuable and cost-effective techniques. Effective fine<br />
fuels <strong>management</strong> via cattle grazing has been demonstrated to slow the spread of wildfire and<br />
therefore reduce the surface area that is susceptible to sediment runoff. About 90% of fire<br />
starts occur along the highways bordering and bisecting the <strong>watershed</strong>. With effective grazing<br />
<strong>management</strong>, fire starts can be contained more rapidly, preventing the spread of fire to the<br />
sensitive stream corridor. This will protect water quality within Wailulaula stream as well as<br />
coastal areas.<br />
142<br />
Wai‘ula‘ula Watershed Management Plan DRAFT MK<strong>SWCD</strong>
The following table provides criteria to measure success in achieving this <strong>watershed</strong> and<br />
ecosystem health goal.<br />
Indicators<br />
Targeted load, level or value<br />
Fuel loads / stubble height<br />
Fuel loads of 1,500 lbs/acre for buffel grass<br />
(key forage species) and 3” stubble height<br />
Annual acreage burned<br />
Less than an average of 100-acres burned per<br />
year throughout the <strong>watershed</strong>.<br />
Objective 3a: Reduce size of wildfires to an average of 100 acres burned per year by 2015 in<br />
the fire prone area between Queen Ka‘ahumanu Highway and 1,200-ft. elevation by using<br />
grazing to manage fine fuel loads.<br />
Project FIRE-1. Fence lower <strong>watershed</strong> between Queen Ka‘ahumanu Highway and the rock<br />
wall at 1,200-ft. by 2013 to manage fine fuel loads with cattle grazing.<br />
The lower <strong>watershed</strong> between Queen Ka‘ahumanu Highway and the rock wall (1,200-ft.<br />
elevation) is neither fenced nor grazed. Consequently, this area and its immediate vicinity have<br />
burned repeatedly over the past few decades, including a 630-acre fire within the project area<br />
in March 2010. This 1,350-acre project area represents about 8% of the roughly 18,000-acre<br />
<strong>watershed</strong>. N-SPECT modeling suggests that if this ungrazed area were to burn, sediment loads<br />
would increase sevenfold (3,702 to 26,755 kg/yr.). Phosphorus loads would more than double<br />
(33 to 77 kg/yr.) and Nitrogen loads would more than triple (194 to 627 kg/yr.).<br />
Project Tasks:<br />
• Develop agreement between landowners, land user (grazer) and MK<strong>SWCD</strong><br />
regarding the implementation and maintenance of the project.<br />
• Work with land user to amend his conservation <strong>plan</strong> to include the project<br />
area and develop a grazing system that meets NRCS standards and<br />
specifications.<br />
• Survey and map intended fence alignment and location of gates for<br />
approval of landowners.<br />
• Install approximately 6.8 miles of new cattle fence in conformance with<br />
NRCS standards and specifications, including perimeter fence along<br />
Kawaihae Road, Queen Ka‘ahumanu Highway, the rock wall, the north side<br />
of Wai‘ula‘ula stream and cross-fencing at 600-ft. elevation.<br />
• Install water pipeline and infrastructure in conformance with NRCS<br />
standards and specifications to convey water to troughs strategicallyplaced<br />
in the paddocks to ensure even grazing and sufficient reduction of<br />
fuel loads along highways, and to keep cattle away from stream.<br />
• When the cattle fence has been installed and the pipelines and troughs are<br />
operational, permanent monitoring points will be established to assess fuel<br />
loads at the onset of grazing activities. Initial monitoring of the grass loads<br />
143<br />
Wai‘ula‘ula Watershed Management Plan DRAFT MK<strong>SWCD</strong>
144<br />
will take place as soon as the fence is complete and prior to the<br />
introduction of cattle to the project area.<br />
• Land user will graze approximately 400 head of cattle within the project<br />
area for about 60 days per year, during the wet season that instigates rapid<br />
growth of the dominant buffel grass cover.<br />
• Conduct bi-weekly stubble height monitoring when cattle are present as a<br />
<strong>management</strong> tool to determine when cattle should be rotated out of<br />
paddocks, based on the minimum heights established under NRCS’s<br />
standards and specifications.<br />
Project FIRE-2. By 2018, develop a project to reduce the fuel load in the unfenced, ungrazed<br />
area below Queen Ka‘ahumanu Highway (to sea level) in consultation with<br />
land owners, Hawai‘i Wildfire Management Organization, NRCS, UH<br />
Cooperative Extension Service, and possible grazers.<br />
While equally important, managing the fuel load in the 80-acre fire-prone area below Queen<br />
Ka‘ahumanu Highway is a much more difficult undertaking. Unlike the area above Queen<br />
Ka‘ahumanu Highway, it does not adjoin an area currently grazed, and the question of how to<br />
move cattle (or another type of ungulate such as sheep) has been the subject of many<br />
discussions. Water is also not readily available. For these reasons, MK<strong>SWCD</strong> sees this as a<br />
longer-term project, so that options can be explored, a willing grazer found, and issues of public<br />
access to Mau‘umae Beach and along the Ala Kahakai National Historic Trail addressed. In this<br />
<strong>plan</strong>, we propose continuing the discussions and identifying possible solutions that will be<br />
presented separately for implementation funding.<br />
Project Tasks:<br />
• Assembled a committee to explore the issues, including representatives of<br />
the land owners, MK<strong>SWCD</strong>, NRCS, UH Cooperative Extension Service,<br />
HWMO, and possible grazers.<br />
• Conduct site visit(s) and meet to discuss and agree upon the most costeffective<br />
and practical way to manage the fuel load.<br />
• Submit proposal for implementation funding (project costs and timeframes<br />
TBD).<br />
Objective 3b: By 2020, install measures within the <strong>watershed</strong> to facilitate rapid response by<br />
fire suppression agencies in the event of a fire start, to include reducing fuel loads in a 150-ft.<br />
to 300-ft. buffer zone around neighborhoods and along roadways by 80%.<br />
Because of the history of wildfire in the Wai‘ula‘ula <strong>watershed</strong>, it is important to implement<br />
additional on-the-ground mitigation measures and pre-suppression <strong>plan</strong>ning to reduce the<br />
number and/or severity of fires and facilitate fire-fighting in the event of a fire. Managing fuel<br />
loads and providing on-the-ground resources that will assist fire fighters will be especially<br />
important in the future, with climate change likely causing conditions (changes to vegetation,<br />
rainfall patterns, wind speed and/or direction) that will exacerbate the fire-grass cycle.<br />
Wai‘ula‘ula Watershed Management Plan DRAFT MK<strong>SWCD</strong>
Effective pre-suppression <strong>plan</strong>ning enables firefighters and land managers to more easily and<br />
effectively control a fire. Knowing the location in the <strong>watershed</strong> of sensitive resources (natural<br />
and cultural) that are a priority for protection, water resources, access points, roads, and the<br />
types of equipment available from land users for fire suppression will enable a quick and<br />
effective initial attack against fire outbreaks.<br />
Availability of water is critical to the suppression of fire. Water use agreements and<br />
strategically-placed water sources within the <strong>watershed</strong>, such as pipelines and water tanks<br />
(Project SED-2, Project FIRE-1), allow first responders to more-quickly respond to a fire in the<br />
first hour, which can be the difference between a 100 acre or several thousand acre fire.<br />
Fuel breaks, areas where vegetation that easily carries fire has been reduced, keep firestarts<br />
from spreading quickly, provide access for fire-fighting, and divide fire-prone areas into smaller<br />
areas that provide easier fire control. These can be strategically-located and established<br />
through grazing, mowing, weed-whacking, bull-dozing, and strategic use of herbicides. Cattle<br />
grazing along the southern boundaries of the neighborhoods of Kanehoa, Anekona, ‘Ōuli Ekahi<br />
already provide a fuel break of sorts to attenuate the fire risk to these communities. More fuel<br />
breaks are needed, especially along Kawaihae Road, Queen Ka‘ahumanu Highway, and Kohala<br />
Mountain Road.<br />
Project FIRE-3. Update fire resource maps that cover the Wai‘ula‘ula <strong>watershed</strong> by 2012.<br />
Project Tasks:<br />
• Meet with HWMO personnel and large land owners in the Wai‘ula‘ula<br />
<strong>watershed</strong> to verify and update information for the fire resource maps,<br />
including primary responders by location, location of sensitive cultural and<br />
natural resources, water resources, roads, access points and access<br />
codes/keys, available equipment for fire suppression, and contact<br />
information for land owner representatives.<br />
• Work with HWMO to update the maps and provide copies (paper and<br />
electronic) to State and county fire response agencies.<br />
Project FIRE-4. Facilitate development and/or update of water use and access agreements<br />
between private land owners in the Wai‘ula‘ula <strong>watershed</strong> and fire response<br />
agencies by 2012.<br />
Project Tasks:<br />
• Help execute agreements between private land owners in the <strong>watershed</strong><br />
(Parker Ranch, Queen Emma Land Co., <strong>Mauna</strong> <strong>Kea</strong> Properties, <strong>Mauna</strong> <strong>Kea</strong><br />
Resort, Hapuna Prince Hotel, etc.) and fire response agencies to facilitate<br />
rapid access to water sources on private property in the event of a wildfire.<br />
145<br />
Wai‘ula‘ula Watershed Management Plan DRAFT MK<strong>SWCD</strong>
Project FIRE-5. Construct and/or maintain at least 6 miles of fuel breaks by 2017 to protect<br />
residential communities in fire-prone areas from wildfire and to slow spread of<br />
fire starts along roadways in the <strong>watershed</strong>.<br />
Project Tasks:<br />
• Survey and map existing fuel breaks and note current condition of those<br />
breaks.<br />
• Evaluate current grazing adjacent to Kamuela Plantations, Lālāmilo (DHHL),<br />
Kanehoa, Anekona, ‘Ōuli Ekahi for its effectiveness in protecting these<br />
communities from wildfire.<br />
• Work with HWMO to identify and map priority residential areas and<br />
roadsides in need of protective fuel breaks. Calculate current fuel loads in a<br />
150-ft. to 300-ft. wide buffer zone around priority residential areas and<br />
along priority roadways.<br />
• Determine most appropriate type of fuelbreak for each area. An emphasis<br />
will be on the use of existing cattle grazing to reduce fuel loads in priority<br />
areas.<br />
• For fuel breaks around residential areas, present proposed fuel break<br />
projects to each relevant neighborhood association for comments and<br />
concerns.<br />
• Create approximately 6 miles of fuel breaks. Fuel breaks will be a minimum<br />
of 150-ft. wide. Develop a maintenance <strong>plan</strong> to ensure regular<br />
maintenance of fuel breaks, especially preceding the dry season.<br />
• Measure changes in fuel loads at representative sites within fuel breaks on<br />
a semi-annual basis.<br />
Objective 3c: In cooperation with HWMO, develop a post-fire restoration manual of effective<br />
practices by 2015.<br />
Sometimes, areas that have been overgrazed, experienced fires, or suffered severe erosion<br />
remain bare for long periods of time, exacerbating their erosion potential. This can occur for a<br />
number of reasons: absence of seeds in the soil, poor or depleted soil quality, capping of the<br />
soil making seed penetration difficult, and lack of rainfall or other forms of irrigation.<br />
Opportunistic species of grasses and <strong>plan</strong>ts introduced into an area are sometimes less<br />
effective for erosion control and create a greater fire hazard (e.g., fountain grass). Frequently,<br />
the riparian corridor, which normally would provide a buffer to polluted runoff entering the<br />
streams, is completely denuded during a fire, because of its tremendous fuel load in the form of<br />
trees and shrubs. In these situations, there may be a need for human assistance in restoring or<br />
revegetating areas severely impacted by wildfires or other causes, particularly in the riparian<br />
zone. There is currently little data available on successful revegetation of burned areas in<br />
Hawai‘i.<br />
146<br />
Wai‘ula‘ula Watershed Management Plan DRAFT MK<strong>SWCD</strong>
Project FIRE-6. In cooperation with HWMO, develop a post-fire restoration manual of<br />
effective practices by 2015.<br />
Project Tasks:<br />
• In coordination with HWMO, develop a post-fire restoration manual of<br />
effective practices to restore burned areas following fires. The manual will<br />
also be applicable to other denuded lands, whatever the cause. The manual<br />
will address large- and small-scale restoration of grasslands and riparian<br />
corridors, using grasses, fire-resistant species, and native species.<br />
Development of the manual will involve research on post-fire revegetation<br />
techniques used in dry environments around the world, small-scale test<br />
plots to determine effectiveness of practices in Hawai‘i’s leeward<br />
environments, and consultation with local and Mainland experts.<br />
• Organize and host a workshop to present information to land and resource<br />
managers and others.<br />
• Implement techniques developed to remediate burned areas (project costs<br />
and timeframes TBD).<br />
Goal 4: Reduce the volume and increase the quality of stormwater runoff in the urban and<br />
suburban areas of the Wai‘ula‘ula <strong>watershed</strong>.<br />
Urban development can have a negative impact on the hydrology and water quality of a<br />
<strong>watershed</strong>. Impervious surface area is often associated with polluted runoff. The “hardening”<br />
of the landscape that comes with urbanization increases runoff volumes and pollutant loadings.<br />
Impervious surfaces, such as rooftops, roads, parking lots, and sidewalks, decrease the<br />
infiltration capacity of the ground and result in greater runoff volumes that can exacerbate<br />
flooding problems. Urban development also causes an increase in pollutants, such as excessive<br />
nutrients, pathogens, hydrocarbons, heavy metals, and toxins.<br />
Based on a limited amount of data, it appears that urban runoff in parts of the Wai‘ula‘ula<br />
<strong>watershed</strong> exceeds State water quality criteria for sediment (by a factor of five), TP (by a factor<br />
of four), TN (by a factor of three), and nitrate (slightly greater than the standard). These<br />
problems can be addressed during the implementation timeframe of this <strong>management</strong> <strong>plan</strong>.<br />
N-SPECT was used to model future pollutant loads, given the land use changes (mostly urban<br />
and suburban expansion) projected in Hawai‘i County’s General Plan LUPAG. With future<br />
development scenarios, sediment loads will decrease but stormwater runoff volume and<br />
nutrient loads will increase.<br />
147<br />
Wai‘ula‘ula Watershed Management Plan DRAFT MK<strong>SWCD</strong>
The following table provides criteria to measure success in achieving this <strong>watershed</strong> and<br />
ecosystem health goal.<br />
Indicators<br />
Targeted load, level or value<br />
Total Suspended Sediment (TSS)<br />
By 2020, reduce pollutants loads in<br />
stormwater runoff conveyed directly into<br />
streams or into dry wells in close proximity to<br />
stream channels by 50%.<br />
Total Nitrogen (TN)<br />
Total Phosphorus (TP)<br />
Runoff Volume<br />
A percentage increase in runoff volume less<br />
than 5% from new developments in the<br />
<strong>watershed</strong>, and a decrease of runoff volume of<br />
at least 5% from existing development.<br />
Objective 4a: By 2020, treat 70% of urban stormwater runoff that is conveyed directly into<br />
streams and 30% of stormwater conveyed to dry wells in close proximity to stream channels.<br />
Many roads within the Wai‘ula‘ula <strong>watershed</strong> are fitted with curb and gutter catch basins to<br />
convey stormwater away from roads. This nutrient- and sediment-laden stormwater is then<br />
discharged into dry wells or directly into streams, affecting either groundwater or surface<br />
water. While Izuka et al. (2010) examined the potential effects of dry wells on county roads on<br />
the water quality of receiving waters at the coast and in drinking water wells, they did not<br />
consider effects to surface waters. On other roads, stormwater is conveyed to grassy shoulders<br />
on either side of the road, where it ponds until it is either absorbed or runs off. All existing<br />
bridges in the <strong>watershed</strong> have scuppers that discharge stormwater directly into the streams<br />
below.<br />
There are several new residential development projects, highway projects, road realignments,<br />
bypasses, and new bridges proposed for the <strong>watershed</strong>. These provide opportunities for the<br />
District to work with the responsible State and county agencies to ensure the projects protect<br />
sensitive aquatic ecosystems, consider types and locations of permanent erosion and sediment<br />
controls, and manage stormwater through a combination of structural and non-structural<br />
practices.<br />
Project STORM-1. Install storm drain and curbside catch basin filter inserts by 2016 on<br />
priority drains/ basins that discharge directly into streams.<br />
Project Tasks:<br />
• Survey and map all storm drains and curbside catch basins in Waimea,<br />
quantify impervious surface areas, and determine which flow into dry wells<br />
and which flow directly into streams.<br />
• Model volume of runoff from 2 year-24 hour storm event generated in the<br />
catchment areas of storm drain systems that discharge directly into<br />
streams.<br />
148<br />
Wai‘ula‘ula Watershed Management Plan DRAFT MK<strong>SWCD</strong>
• Prioritize storm drains and curbside catch basins for treatment upgrade<br />
based on discharge into stream systems.<br />
• In cooperation with the County Division of Public Works (DPW), research<br />
available catch basin insert products and select product based on design<br />
features, pollutants captured, effectiveness, cost, and ease of installation<br />
and maintenance.<br />
• In cooperation with the County DPW, install catch basin filter inserts on<br />
priority storm drains/ curbside catch basins.<br />
• Work with County to establish a maintenance <strong>plan</strong> and establish a tracking<br />
system to gage effectiveness of catch basin insert program.<br />
• Monitor water quality from end of storm pipe(s) discharging into stream<br />
before and for every storm event for one year after installation of filter<br />
inserts. Parameters to be monitored include TSS, TP, TN.<br />
Project STORM-2. By 2018, install catch basin filter inserts on priority dry wells that are in<br />
close proximity to streams, where stormwater carrying pollutants may rapidly seep into<br />
stream channels.<br />
Project Tasks:<br />
• Based on survey, mapping, and modeling conducted under Project STORM-<br />
1, prioritize dry wells for treatment upgrade based on proximity to streams.<br />
• In cooperation with the dry well owners (private or public), install catch<br />
basin filter inserts on priority dry wells.<br />
• Work with dry well owners to establish maintenance <strong>plan</strong> and tracking<br />
system to gage effectiveness of catch basin insert program.<br />
• On a representative dry well, monitor water quality entering storm drain<br />
and water quality below the filter insert. Parameters to be monitored<br />
include TSS, TP, TN.<br />
Objective 4b: Conduct semi-annual educational events to engage residential property owners<br />
in managing stormwater onsite for three years before 2016.<br />
Project STORM-3. Develop and implement a public education and outreach program for<br />
residential stormwater <strong>management</strong>.<br />
Project Tasks:<br />
• Develop or adapt outreach materials about innovative residential<br />
stormwater <strong>management</strong>, including fact sheets about best <strong>management</strong><br />
practices, including stormwater harvesting (rain barrels, cisterns), rain<br />
gardens, and pervious pavement.<br />
• Distribute information through MK<strong>SWCD</strong> website and at community<br />
outreach events.<br />
149<br />
Wai‘ula‘ula Watershed Management Plan DRAFT MK<strong>SWCD</strong>
150<br />
• Conduct two educational events per year for three years, including handson<br />
events and demonstration projects.<br />
Objective 4c: Decrease volumes flowing offsite and increase treatment of stormwater from<br />
existing commercial and residential developments by 15% by 2023.<br />
In response to flood hazards caused by development in the early 1980s, all new urban<br />
developments (with very few exceptions) have been mandated by Hawai‘i County to maintain<br />
pre-development runoff conditions (Kuba 2005). Developers island-wide are now routinely<br />
required to dispose of all development-generated runoff onsite. These requirements have<br />
been codified in Chapter 23, HCC, “Subdivisions,” Chapter 25, HCC, “Zoning,” and Chapter 27,<br />
HCC, “Flood Control.” Hawai‘i County relies on deep (+20 feet) 5-feet diameter drainage<br />
injection wells (or “dry wells”) as the primary means of capturing and disposing of stormwater<br />
runoff.<br />
Older developments that pre-date the changes in regulations often convey stormwater runoff<br />
directly offsite into streams and storm drainage systems, which can contribute to flooding<br />
during large storm events. While not required by State or county directives, upgrading existing<br />
stormwater control structures to meet new requirements would help reduce both volume and<br />
pollutant loads in stormwater runoff.<br />
Project STORM-4. Upgrade existing urban runoff control structures on a priority basis.<br />
Project Tasks:<br />
• Survey existing urban runoff control structures in commercial and<br />
residential developments and identify and prioritize needed upgrades/<br />
improvements to reduce runoff pollutant concentrations and volumes or<br />
retain conveyance of polluted runoff onsite.<br />
• Work with landowners to identify cost-share opportunities to<br />
retrofit/upgrade existing urban runoff control structures.<br />
• Survey stream corridor rehabilitation opportunities that would help<br />
attenuate effects of runoff from existing development by improving<br />
retention and treatment capabilities of riparian corridors.<br />
• Implement improvements to priority urban runoff control structures in<br />
coordination with land owners (project costs and timeframes TBD).<br />
Objective 4d: Develop written pollution prevention procedures for the operation and<br />
maintenance of existing County roads, highways, and bridges by 2019 to reduce pollutant<br />
loadings to surface waters.<br />
New publicly-constructed roads, highways and bridges, and privately-constructed roads,<br />
highways and bridges that are transferred over to the State or county as public roadways upon<br />
completion of construction must comply with State and county standards. New privatelyconstructed<br />
roads, highways, and bridges that remain private must comply with counties<br />
Wai‘ula‘ula Watershed Management Plan DRAFT MK<strong>SWCD</strong>
equirements for erosion and sediment control, stormwater <strong>management</strong>, drainage, zoning and<br />
subdivisions.<br />
The State and county are responsible for maintenance of their respective roads, highways, and<br />
bridges. Chapter 19-127.1, HAR, administered by DOT, establishes design, construction and<br />
maintenance guidelines that should be followed in the construction, reconstruction, and<br />
maintenance of all highways, streets, or roads undertaken either by State or county authorities<br />
or by individuals intending to dedicate the facilities to governmental authorities. Hawai‘i<br />
County, however, does not have separate written operation and maintenance guidelines for its<br />
roads, highways and bridges.<br />
Project STORM-5. Work with the County to formalize operations and maintenance practices<br />
for County roads, highways, and bridges by developing written guidelines.<br />
151<br />
Project Tasks:<br />
• Using the “Pollution Prevention and Good Housekeeping” chapter of<br />
Hawai‘i DOT’s Oahu Storm Water Management Program Plan (DOT 2007)<br />
as a model, draft maintenance guidelines for debris control, chemical<br />
application, erosion control, maintenance facilities (baseyards, etc.), and<br />
flood control facilities related to County roads, highways and bridges.<br />
Objective 4e: By promoting use of Low Impact Development techniques, reduce the volume<br />
of stormwater runoff conveyed offsite from new large developments by 2025 so that total<br />
runoff volumes calculated by N-SPECT modeling of land use changes do not increase as urban<br />
and suburban expansion occurs.<br />
As noted above, urban development generally increases stormwater runoff volumes. Low<br />
Impact Development (LID) is a relatively new concept in stormwater <strong>management</strong>. “It<br />
incorporates a suite of landscaping and design techniques known as “Better Site Design” that<br />
attempt to maintain the natural, pre-development hydrology of a site and the surrounding<br />
<strong>watershed</strong>” (Horsley Witten Group 2006, p. 1-2). The goal of LID is to minimize the<br />
environmental footprint of a development, while retaining the owner's purpose for the site.<br />
According to Horsley Witten (2006), more concentrated (cluster) design creates less impervious<br />
area, generates less surface runoff, and requires smaller infrastructure for drainage and other<br />
utilities. EPA has found that implementing LID practices saves money for developers, property<br />
owners and communities while protecting and restoring water quality (EPA 2007).<br />
Urban developments (with very few exceptions) have been mandated by Hawai‘i County to<br />
maintain pre-development runoff conditions (Kuba 2005). Developers island-wide are now<br />
routinely required to dispose of all development-generated runoff onsite. These requirements<br />
have been codified in Chapter 23, HCC, “Subdivisions,” Chapter 25, HCC, “Zoning,” and Chapter<br />
27, HCC, “Flood Control.” In addition, Hawai‘i County’s Zoning ordinance provides for cluster<br />
development and flexible design standards, though it is not well-publicized. It may also allow<br />
for innovative stormwater <strong>management</strong> techniques, reduced street and sidewalk widths, and<br />
Wai‘ula‘ula Watershed Management Plan DRAFT MK<strong>SWCD</strong>
other <strong>management</strong> measures to attenuate runoff from developments. While it does not<br />
explicitly promote the minimizing of impervious surfaces, the County may permit the use of<br />
pervious pavements and other <strong>management</strong> measures that are not currently allowed under<br />
regular zoning and subdivision provisions. Cluster development can result in a cost savings with<br />
respect to infrastructure.<br />
Workshops on LID techniques for Hawai‘i have been held on other islands, and informational<br />
resources have been developed for Hawai‘i (see Horsley Witten 2006). However, large<br />
landowners and developers on Hawai‘i Island may not be familiar with these resources.<br />
Therefore, there is a need develop outreach programs to landowners, businesses, and land<br />
<strong>management</strong> agencies in order to encourage use of LID techniques in new urban developments.<br />
Key large landowners to target in the short term for the Wai‘ula‘ula <strong>watershed</strong> include<br />
Department of Hawaiian Homelands, Parker Ranch, and <strong>Mauna</strong> <strong>Kea</strong> Properties.<br />
Project STORM-6. Develop and implement a LID outreach program for large landowners,<br />
developers, State and county land managers and permitting agencies, and<br />
engineering and land use <strong>plan</strong>ning firms by 2015.<br />
Project Tasks:<br />
• Organize and host a workshop on LID techniques and applicable<br />
regulations, with site visit(s), for large landowners, developers, State and<br />
county land managers and permitting agencies, and engineering and land<br />
use <strong>plan</strong>ning firms.<br />
• Make documents on LID available for download on the MK<strong>SWCD</strong> website.<br />
• Meet with individual land owners to discuss the possibility of implementing<br />
small-scale LID projects to demonstrate the effectiveness of these<br />
techniques.<br />
• Submit proposal for implementation funding for small-scale LID project<br />
(project costs and timeframes TBD).<br />
Goal 5: Restore and enhance riparian buffers that serve as protective filters for streams in<br />
the Wai‘ula‘ula <strong>watershed</strong>.<br />
A riparian buffer is land next to a stream that is vegetated, usually with trees and shrubs, which<br />
serves as a protective filter for streams. It protects water quality against pollutants and helps<br />
stabilize eroding streambanks. Establishing riparian buffer zones and protecting existing<br />
riparian zones help in trapping sediment and particulates, in slowing flows, and in increasing<br />
water percolation. Riparian buffers can vary in width, depending on the stream, soil type,<br />
vegetation, slope, surrounding land use, and desired level of protection.<br />
In Hawai‘i, riparian buffers are afforded the greatest protection within the Conservation<br />
District. DLNR manages lands in the Conservation District in order to conserve, protect, and<br />
preserve the important natural resources of the State through appropriate <strong>management</strong> and<br />
152<br />
Wai‘ula‘ula Watershed Management Plan DRAFT MK<strong>SWCD</strong>
use to promote their long-term sustainability. The headwaters of the streams in the Wai‘ula‘ula<br />
<strong>watershed</strong> originate in the conservation district. The southeastern portion of the conservation<br />
lands within the Wai‘ula‘ula <strong>watershed</strong> are designated as part of the Kohala Watershed Forest<br />
Reserve. Another portion is designated the Kohala Restricted Watershed. The remaining<br />
conservation lands within the Wai‘ula‘ula <strong>watershed</strong> are part of the Pu‘u o ‘Umi Natural Area<br />
Reserve. The conservation lands of the Wai‘ula‘ula <strong>watershed</strong> are also part of the Kohala<br />
Watershed Partnership.<br />
Outside of the conservation district, the State does not have a specific process by which to<br />
protect wetlands and riparian areas. These areas are afforded marginal protection under<br />
regulations addressing flood plains, stormwater, and zoning. However, these regulations are<br />
aimed primarily at protecting homeowners from flooding rather than protecting the functions<br />
of riparian buffers. Many of the riparian corridors in the Wai‘ula‘ula <strong>watershed</strong> pass through<br />
grazing lands, where, historically, cattle have been provided access to streams for water. Many<br />
of these grazing lands, particular below 2,600-ft. elevation are marginal agricultural lands<br />
because of dry conditions and invasive grass species (i.e., fountaingrass).<br />
N-SPECT modeling has shown that for every 100-ft. of stream corridor converted to evergreen<br />
cover 10 , an average of 900 kg/yr. of sediment, 86 kg/yr. of phosphorus, and 293 kg/yr of<br />
nitrogen are reduced. These numbers vary by elevation of the restored riparian buffer and<br />
pollutant type.<br />
A first step to restoring riparian buffers is the development of a mechanism by which to identify<br />
environmental problems present within a stream system and along its riparian corridor and to<br />
provide sufficient information on each problem so that both the severity and correctability can<br />
be determined and restoration efforts can be prioritized. Maryland has developed survey<br />
protocols for a Stream Corridor Assessment to rapidly measure the general physical condition<br />
of a stream system and identify the locations of a variety of environmental problems within its<br />
stream corridors (Yetman 2001). These problems could include erosion sites, inadequate<br />
stream buffers, fish migration blockages, exposed or discharging pipes, channelized stream<br />
sections, trash dumping sites, in or near-stream construction, streambank instability, areas<br />
prone to flooding, and any unusual conditions. Project MONIT-1 will develop such a survey tool<br />
to help determine specific areas in which to focus limited resources.<br />
Bishop Museum has developed an interactive <strong>plan</strong>t key designed to assist in selecting native<br />
<strong>plan</strong>ts appropriate for their out<strong>plan</strong>ting sites. This <strong>plan</strong>t key Riparian Plant Restoration: A<br />
Management Tool for Habitat Restoration in Hawai‘i can be found at<br />
http://hawaiiconservation.org/resources/publications/pacific_island_<strong>plan</strong>t_restration_database.<br />
10 from scrub/shrub below 2,600-ft. elevation and from grassland above 2,600-ft. elevation.<br />
153<br />
Wai‘ula‘ula Watershed Management Plan DRAFT MK<strong>SWCD</strong>
The following table provides criteria to measure success in achieving this <strong>watershed</strong> and<br />
ecosystem health goal.<br />
Indicators<br />
Targeted load, level or value<br />
Total Suspended Sediment (TSS)<br />
By 2020, a 10% reduction in modeled loads,<br />
Total Phosphorus (TP)<br />
using N-SPECT.<br />
Total Nitrogen (TN)<br />
Linear feet of riparian corridor fenced and<br />
restored<br />
New legislation protecting wetlands and<br />
riparian buffers<br />
Number of people accessed by public<br />
education and outreach<br />
25,000-ft. total by 2025<br />
Established by 2018<br />
8,500 people by 2025<br />
Objective 5a: By 2025, restore 25,000-ft. of stream riparian corridor to provide an adequate<br />
buffer for managing stormwater, reducing pollutant loads by 10% from current levels,<br />
protecting from property loss due to flooding and erosion, and creating healthy habitat for<br />
native aquatic species.<br />
Project STREAM-1. By 2017, convert marginal agricultural lands within a 15,000-ft. length of<br />
the stream corridor into native vegetation under the Hawai‘i Conservation<br />
Resource Enhancement Program.<br />
Through the Hawai‘i Conservation Resource Enhancement Program (CREP), program<br />
participants receive financial incentives to voluntarily enroll and remove marginal pastureland<br />
from agricultural production and convert the land to natives grasses, trees and other<br />
vegetation. Hawaii CREP will provide for restoration of previously forested, degraded<br />
agricultural land. This project will improve water quality and quantity by reducing soil runoff,<br />
increasing potential ground absorption, and reducing stream sedimentation and nutrient<br />
loading to near-shore environments.<br />
Project Tasks:<br />
• Using results of the stream corridor assessment conducted under Project<br />
MONIT-1), prioritize stream corridor segments in need of restoration by<br />
2013 based on severity of problem and correctability. Identify stream<br />
corridor segments by elevation, land use, threat and/or problem.<br />
• Identify riparian corridor areas experiencing streambank erosion/<br />
instability, being used by cattle for water (relates to Project NUTR-2),<br />
and/or located within degraded or marginal pastureland.<br />
• Identify interested land users for participation in CREP. Determine eligibility<br />
and extent of area that will be included in CREP.<br />
• Assist land user(s) in enrolling in CREP, through NRCS.<br />
154<br />
Wai‘ula‘ula Watershed Management Plan DRAFT MK<strong>SWCD</strong>
• Develop or amend conservation <strong>plan</strong>s for the areas, in consultation with<br />
MK<strong>SWCD</strong> and NRCS.<br />
• Fence and restore at least 15,000-ft. of riparian corridor within marginal<br />
agricultural lands (specific site TBD). Buffer width can be between 30-ft.<br />
and 1,320-ft. depending on circumstances specific to each site.<br />
Project STREAM-2. Conduct semi-annual educational events, including hands-on events and<br />
demonstration projects, for three years before 2016 to educate the public<br />
about the importance of riparian buffers.<br />
Project Tasks:<br />
• By 2013, develop or adapt informational materials for streamside property<br />
owners about the importance of riparian buffers for managing stormwater,<br />
protecting from property loss due to flooding and erosion, and creating<br />
healthy habitat for native aquatic species. Include information about<br />
appropriate riparian <strong>plan</strong>ts based on elevation and proper <strong>plan</strong>ting<br />
techniques.<br />
• Distribute information through MK<strong>SWCD</strong> website and at community<br />
outreach events.<br />
• Conduct two educational events per year for three years, including handson<br />
events and demonstration projects.<br />
• In cooperation with the land owner (Parker School), re-establish a riparian<br />
buffer along Waikoloa Stream from upstream of the KTA Shopping Center<br />
to behind the Waimea Community Education building by 2015 as part of<br />
providing hands-on educational events to community members. This<br />
highly-visible 1.5-acre site in the middle of Waimea town is a perfect<br />
teaching site and will help inspire and promote other riparian restoration<br />
efforts.<br />
Project STREAM-3. Prioritize riparian buffers for restoration, and work with land owner(s) to<br />
implement restoration project(s) on at least 10,000-ft. of priority stream<br />
corridors.<br />
Project Tasks:<br />
• Using results of the stream corridor assessment conducted under Project<br />
MONIT-1), prioritize stream corridor segments in need of restoration by<br />
2013 based on severity of problem and correctability. Identify stream<br />
corridor segments by elevation, land use, threat and/or problem.<br />
• Develop a Comprehensive Riparian Management Plan by 2017 that<br />
identifies describes restoration activities for each priority stream corridor<br />
segment, including fencing, weed removal, <strong>plan</strong>ting, streambank<br />
stabilization, ongoing maintenance, and Adopt-a-Stream suitability and<br />
other community involvement opportunities.<br />
155<br />
Wai‘ula‘ula Watershed Management Plan DRAFT MK<strong>SWCD</strong>
• Fence and restore a minimum of 10,000-ft. of priority stream corridors<br />
within the Wai‘ula‘ula <strong>watershed</strong> by 2021 (specific sites TBD).<br />
Objective 5b: By 2018, establish a county regulatory mechanism that specifically protects<br />
wetlands and riparian areas of perennial streams on Hawai‘i Island.<br />
There are mechanisms that could be used to strengthen protection of riparian areas.<br />
Mechanisms such as overlay districts or zones have been used in recent years around the U.S.<br />
to provide a framework for conservation of special geographical areas. An overlay district is an<br />
additional zoning requirement that is placed on a geographical area but does not change the<br />
underlying zoning.<br />
Project STREAM-4. Help draft policy language to enact an overlay district that explicitly<br />
protects wetlands and riparian areas.<br />
Project Tasks:<br />
• Work with Hawai‘i County Council members to draft legislation creating an<br />
overlay district that enhances protection of wetlands and riparian areas of<br />
perennial streams. An overlay zone focused on conserving natural features,<br />
such as wetlands, riparian areas, aquifers, or other sensitive resource areas,<br />
would typically impose greater restrictions on the development of the land,<br />
but only on those parcels whose development, as permitted under the<br />
zoning, may threaten the viability of these features. In the context of<br />
protecting wetlands and riparian areas, an overlay district could be adopted<br />
that contains setback provisions, requires a portion of the existing<br />
vegetation to be maintained as a buffer, limits the amount of tree and<br />
shrub clearing, limits impervious surfaces in the stream buffer unless<br />
approved by special permit, or requires the use of additional BMPs.<br />
• Use informational materials developed under STREAM-2 to educate<br />
lawmakers and the public about the importance of riparian buffers for<br />
managing stormwater, protecting from property loss due to flooding and<br />
erosion, and creating healthy habitat for native aquatic species.<br />
• Develop informational materials about the benefits of an overlay district to<br />
help protect riparian areas.<br />
Goal 6: Protect aquatic habitat and manage instream flows.<br />
Freshwater streams have many values. They provide irreplaceable habitats for aquatic fauna<br />
and flora. Streams link the mountains with the ocean. They are essential to the productivity<br />
and quality of Hawai‘i’s nearshore waters. Stream health is both integral to the survival of the<br />
unique stream organisms and indicative of the overall quality of our island environment.<br />
156<br />
Wai‘ula‘ula Watershed Management Plan DRAFT MK<strong>SWCD</strong>
The Wai‘ula‘ula <strong>watershed</strong> is exceptional, from a native aquatic species standpoint. According<br />
to Englund (2010), “[t]he relatively high 65% overall native aquatic insect biodiversity found<br />
within the entire Wai‘ula‘ula <strong>watershed</strong> is comparable to other high quality streams (p. 12).” In<br />
the upper reaches of <strong>Kea</strong>nu‘i‘omanō, Waikoloa, and Kohākōhau streams, native species are<br />
even more dominant, maintaining an exceptionally high diversity “equaling any high quality<br />
stream found in the Hawaiian archipelago” (Englund 2010; p. 12). Stream surveys have noted<br />
all five native stream fish species in various locations throughout the <strong>watershed</strong>, from the<br />
Wai‘ula‘ula estuary to about the 2,700-ft. elevation. These species require streamflow for their<br />
survival. Their presence at various elevations in the Wai‘ula‘ula <strong>watershed</strong> “indicates that<br />
native fish traverse long stretches of intermittent stream channels during periods of flowing<br />
water, using the ephemeral stream habitat as an access corridor to the headwater regions…”<br />
(Englund 2010; p. 11).<br />
The Water Commission, as provided for under the State Water Code (Chapter 174C, HRS), sets<br />
policies and approves water allocations for all water users. Existing uses established prior to<br />
1987 are grandfathered in, provided the existing use is reasonable and beneficial. The Water<br />
Commission also establishes instream flow standards for perennial streams, in order to balance<br />
maintenance of fish and wildlife habitat, estuarine, wetland and stream ecosystems, and water<br />
quality with use of the water. Section 13-169-46, HAR, establishes interim instream flow<br />
standards (IFS) for Hawai‘i. These were generally defined as the amount of water flowing in<br />
each stream on the effective date of the standard (1988). The standards for some individual<br />
streams have subsequently been amended as a result of petitions to amend the IFS and<br />
describe the amount of water that can be withdrawn from the stream. Specific instream flow<br />
standards have not been established for any streams within the Wai‘ula‘ula <strong>watershed</strong>.<br />
At the same time, there are legal and illegal diversions of water that reduce otherwise normal<br />
streamflow volume. It is vital to the survival of these endemic species that adequate<br />
streamflow is ensured through a careful analysis of all diversions of water from streams in the<br />
<strong>watershed</strong>, and that unneeded or unauthorized diversions are removed to enhance stream<br />
ecosystems.<br />
The following table provides criteria to measure success in achieving this <strong>watershed</strong> and<br />
ecosystem health goal.<br />
Indicators<br />
Targeted load, level or value<br />
Dissolved Oxygen (instream perennial pools Every measurement shall be 80% saturation or<br />
only)<br />
greater; additionally, absolute values shall<br />
never fall below 6.25 mg/l (80% saturation of<br />
water at 86ºF (30ºC)).<br />
Total Phosphorus (TP)<br />
By 2025, the geometric mean of<br />
measurements for all indicators shall be less<br />
Total Nitrogen (TN)<br />
than water quality standards for the dry<br />
season in any year and at any sampling site.<br />
157<br />
Wai‘ula‘ula Watershed Management Plan DRAFT MK<strong>SWCD</strong>
Indicators<br />
Temperature (instream perennial pools only)<br />
Diversity of native aquatic insects within the<br />
<strong>watershed</strong><br />
Number of unpermitted diversion and<br />
instream structures<br />
Total volume of water withdrawn annually<br />
from all diversions<br />
Targeted load, level or value<br />
Between noon and 3 p.m., the surface water<br />
temperature shall be not more than 10ºF<br />
greater than air temperature in the shade.<br />
At a minimum, maintain 65% overall native<br />
aquatic insect biodiversity within the entire<br />
<strong>watershed</strong><br />
90% reduction<br />
Annual diversions should not exceed half the<br />
combined flow at the Marine Dam and<br />
Kohākōhau stream gages.<br />
Objective 6a: By 2021, ensure that instream flows for the streams within the Wai‘ula‘ula<br />
<strong>watershed</strong> balance permitted sustainable water use and protection of the biological,<br />
chemical, and physical integrity of these waters, and that annual diversions do not exceed<br />
half the combined flows at the Marine Dam and Kohākōhau stream gauges.<br />
Project AQU-1. Work with landowners and the Water Commission to permit or remove 100%<br />
of illegal diversions by 2018.<br />
Project Tasks:<br />
• Using results of the stream corridor assessment conducted under Project<br />
MONIT-1), identify all diversions within the Wai‘ula‘ula <strong>watershed</strong>.<br />
• Work with Water Commission staff to identify permitted and unpermitted<br />
diversions.<br />
• Develop or adapt an outreach program about Hawai‘i’s native aquatic<br />
species and the importance of maintaining instream flows. Develop a fact<br />
sheet about Water Commission permits and procedures.<br />
• Distribute information through MK<strong>SWCD</strong> website and at community<br />
outreach events.<br />
• Attend neighborhood association meetings in subdivisions with unpermitted<br />
withdrawals of stream water to present information and answer questions.<br />
• Support the Water Commission in taking action against illegal withdrawals<br />
if public outreach does not succeed in permit requests or remedial actions<br />
by land owners.<br />
158<br />
Wai‘ula‘ula Watershed Management Plan DRAFT MK<strong>SWCD</strong>
Project AQU-2. Evaluate need for specific instream flow standards for streams within the<br />
Wai‘ula‘ula <strong>watershed</strong> by 2019.<br />
159<br />
Project Tasks:<br />
• Measure actual water withdrawals from diversions in the <strong>watershed</strong> to<br />
determine a total average annual withdrawal amount for each stream in<br />
the <strong>watershed</strong>.<br />
• Work with the Water Commission to evaluate current and anticipated<br />
water withdrawals from the streams within the <strong>watershed</strong> to determine if<br />
specific instream flow standards are required.<br />
Objective 6b: Maintain or improve the current native species diversity of fish and<br />
invertebrate communities in the Wai‘ula‘ula <strong>watershed</strong> by 2025.<br />
Project AQU-3. Consult with experts by 2016 to determine if existing dams and other<br />
instream structures are having a negative effect on ‘o‘opu instream migration.<br />
Project Tasks:<br />
• Using results of the stream corridor assessment conducted under Project<br />
MONIT-1), identify all dams and other instream structures within the<br />
Wai‘ula‘ula <strong>watershed</strong>.<br />
• Work with Water Commission staff to identify permitted and unpermitted<br />
in-stream structures. Support the Water Commission in taking action<br />
against illegal in-stream structures.<br />
• Consult ‘o‘opu experts about the effects of existing, permitted dams on<br />
‘o‘opu migration and seek advice on possible remedial actions.<br />
• Depending on expert advice, submit proposal for implementation funding<br />
for “effective removal” 11 of barriers to ‘o‘opu passage (project costs and<br />
timeframes TBD).<br />
Project AQU-4. Prevent further introduction of invasive aquatic species into the streams and<br />
identify how to remove existing invasive species that threaten native species by<br />
2020.<br />
Project Tasks:<br />
• Develop or adapt outreach materials about the damage invasive aquatic<br />
species can have on the native Hawaiian aquatic ecosystem as a way to<br />
reduce new introductions. Distribute materials to streamside homeowners<br />
and schools.<br />
• Monitor for potentially-harmful invasive species when a threat to native<br />
fauna is likely.<br />
11 “Effective removal” can mean physical removal, breaching of a barrier, installation of fish passage structures, or<br />
implementation of other fish passage strategies to result in effective fish passage around or through a barrier.<br />
Wai‘ula‘ula Watershed Management Plan DRAFT MK<strong>SWCD</strong>
• Consult with aquatic ecosystem experts on how best to remove invasive<br />
aquatic species from the <strong>watershed</strong> without harming native species.<br />
Submit research proposals to evaluate impacts and possible control<br />
measures, if necessary.<br />
Project AQU-5. By 2015, protect priority instream perennial pools that provide important<br />
habitat for native aquatic species.<br />
Project Tasks:<br />
• Using results of the stream corridor assessment conducted under Project<br />
MONIT-1), identify and map all significant instream perennial pools within<br />
the Wai‘ula‘ula <strong>watershed</strong>.<br />
• Monitor water quality in instream perennial pools (DO, TP, TN, chlorophylla,<br />
temperature at surface and bottom) at various elevations and on<br />
different streams within the <strong>watershed</strong> on a quarterly basis. Note presence<br />
of both native and invasive aquatic species, along with other qualitative<br />
measures of ecosystem health (e.g., stagnant water, algae, etc.)<br />
• In consultation with aquatic ecosystem experts, prioritize pools based on<br />
size, depth, habitat quality, presence of native aquatic species, elevation,<br />
and distance between pools.<br />
• Conduct biological surveys of aquatic species every four years, with an<br />
emphasis on sites previously monitored.<br />
• Consult with aquatic ecosystem experts about how best to protect these<br />
deep pools because of their importance to the life cycle of Hawai‘i’s native<br />
aquatic species.<br />
• Depending on expert advice, implement measures to protect priority<br />
instream perennial ponds.<br />
Goal 7: Increase public education, understanding, and participation regarding <strong>watershed</strong><br />
issues.<br />
Educating the public about the Wai‘ula‘ula <strong>watershed</strong>, its resources and values, threats to these<br />
resources and values, and <strong>management</strong> activities is vital to all <strong>watershed</strong> restoration and<br />
protection goals and objectives. Conservation education and <strong>watershed</strong> awareness will help<br />
reduce unwanted human impacts on the landscape. Greater awareness about the <strong>watershed</strong><br />
should also translate into greater support for <strong>management</strong> efforts, in the form of a greater<br />
community voice for conservation measures and increased volunteerism.<br />
Public education and outreach are also helpful in recruiting a cadre of volunteers to assist in<br />
certain <strong>management</strong> activities, especially in labor-intensive efforts such as ecosystem<br />
restoration. Volunteers tend to be extremely enthusiastic, but often require an organized<br />
volunteer program to help keep motivation levels high. Hands-on opportunities both increase<br />
160<br />
Wai‘ula‘ula Watershed Management Plan DRAFT MK<strong>SWCD</strong>
awareness of <strong>watershed</strong> conditions and enable community members to participate in<br />
improving those conditions with a heightened sense of connection to the natural resources.<br />
Many of the projects described above have a strong educational component. Initially,<br />
<strong>watershed</strong> education and outreach will be conducted by the <strong>watershed</strong> coordinator, MK<strong>SWCD</strong><br />
personnel and contractors. However, as the program expands and more community members<br />
volunteer on projects, an education coordinator will be hired.<br />
The following table provides criteria to measure success in achieving this <strong>watershed</strong> and<br />
ecosystem health goal.<br />
Indicators<br />
Targeted load, level or value<br />
Number of volunteers<br />
100 participants per year<br />
Stakeholder awareness as measured by<br />
community survey<br />
Number of Facebook friends for Wai‘ula‘ula<br />
page<br />
Increase awareness by 20% by 2020<br />
500 friends by 2020<br />
Objective 7a: Increase stakeholder awareness and involvement by 15% by implementing an<br />
integrated <strong>watershed</strong> <strong>management</strong> information and education campaign by 2016.<br />
Project EDUC-1: Develop/ adapt and distribute educational materials related to <strong>watershed</strong><br />
issues to community members. The majority of these educational materials<br />
relate to projects described above.<br />
161<br />
Project Tasks:<br />
• Develop or adapt outreach materials about OSDS and potential effects on<br />
water quality and environmental and public health. Distribute information<br />
to homeowners with OSDS about the operation, maintenance, and selfinspection<br />
of cesspools and septic systems as a way to extend their<br />
operating lives and prevent failures. (Project NUTR-3)<br />
• Work with HWMO to distribute educational information about mitigating<br />
wildfire risk and implementing Firewise techniques to protect homes in fireprone<br />
areas. (Relates to Goal 3.)<br />
• Develop or adapt outreach materials about innovative residential<br />
stormwater <strong>management</strong>, including fact sheets about best <strong>management</strong><br />
practices, including stormwater harvesting (rain barrels, cisterns), rain<br />
gardens, and pervious pavement. (Project STORM-3)<br />
• Develop or adapt informational materials for streamside property owners<br />
about the importance of riparian buffers for managing stormwater,<br />
protecting from property loss due to flooding and erosion, and creating<br />
healthy habitat for native aquatic species. Include information about<br />
appropriate riparian <strong>plan</strong>ts based on elevation and proper <strong>plan</strong>ting<br />
techniques. (Project STREAM-2)<br />
Wai‘ula‘ula Watershed Management Plan DRAFT MK<strong>SWCD</strong>
• Develop or adapt an outreach program about Hawai‘i’s native aquatic<br />
species and the importance of maintaining instream flows. Develop a fact<br />
sheet about Water Commission permits and procedures. (Project AQU-1)<br />
• Develop or adapt outreach materials about the damage invasive aquatic<br />
species can have on the native Hawaiian aquatic ecosystem as a way to<br />
reduce new introductions. Distribute materials to streamside homeowners<br />
and schools. (Project AQU-4)<br />
• Develop or adapt targeted outreach activities and materials related to<br />
polluted runoff control, including lawn care practices, household hazardous<br />
waste disposal, low impact development techniques, graywater reuse, etc.<br />
• Distribute information through MK<strong>SWCD</strong> website and at community<br />
outreach events.<br />
• Use social media (i.e., Facebook) and direct emailing to distribute<br />
information about the <strong>watershed</strong> effort and educational materials, and<br />
post calendar events. Encourage people to become “friends” of the<br />
Wai‘ula‘ula Facebook site.<br />
• Use social media to conduct baseline and periodic surveys of community<br />
awareness about <strong>watershed</strong> issues.<br />
Objective 7b: Recruit and engage volunteers to assist in at least two large community-based<br />
projects in the <strong>watershed</strong> every year beginning in 2013.<br />
Project EDUC-2: Provide on-the-ground service learning opportunities for school children and<br />
community members.<br />
• Foster partnerships with landowners, agencies, local schools, stakeholders<br />
and the community at large.<br />
• Coordinate and supervise volunteer efforts by community members and<br />
students. These citizen engagement efforts will include stream cleanups,<br />
trash pickups, invasive species removal, riparian <strong>plan</strong>tings, and water<br />
quality monitoring.<br />
• Develop and coordinate an “Adopt-a-Stream” program.<br />
• Attend festivals and events to provide information at gatherings attended<br />
by the community.<br />
• Hire an outreach coordinator when the educational and volunteers<br />
programs have expanded to the point that dedicated outreach personnel is<br />
needed to build on established momentum and sustain and grow efforts<br />
throughout the <strong>watershed</strong>.<br />
162<br />
Wai‘ula‘ula Watershed Management Plan DRAFT MK<strong>SWCD</strong>
Goal 8: Provide effective project administration and <strong>management</strong> to ensure long-term<br />
success.<br />
Implementation of the Wai‘ula‘ula <strong>watershed</strong> <strong>management</strong> <strong>plan</strong> is a long-term commitment<br />
that requires sufficient personnel and financial resources. The <strong>management</strong> <strong>plan</strong> represents<br />
more work than can be accomplished by existing personnel under the <strong>Mauna</strong> <strong>Kea</strong> Soil and<br />
Water Conservation District or its partners. Effective, coordinated implementation is required<br />
for overall success and achievement of the goals and objectives described herein. Regular<br />
monitoring of the effectiveness of the Plan as a whole is required to ensure that the<br />
recommended actions are resulting in progress toward the desired outcomes, and to take<br />
corrective actions, if necessary. As such, a Watershed Coordinator is needed to oversee<br />
partners and personnel, contractors, vendors, and stakeholders in the <strong>watershed</strong>.<br />
The following table provides criteria to measure success in achieving this <strong>watershed</strong> and<br />
ecosystem health goal.<br />
Indicators<br />
Targeted load, level or value<br />
Percentage of Wai‘ula‘ula <strong>watershed</strong><br />
25% by 2015<br />
<strong>management</strong> <strong>plan</strong> implemented during the 55% by 2020<br />
<strong>plan</strong>ning timeframe between 2011 and 2025 85% by 2025<br />
Sustained monitoring as outlined in<br />
Type and frequency of monitoring described in<br />
Chapter 6<br />
Sustained funding<br />
Chapter 6<br />
Sufficient funding to implement projects<br />
outlined in the Wai‘ula‘ula <strong>watershed</strong><br />
<strong>management</strong> <strong>plan</strong><br />
Objective 8a: Establish appropriate administrative framework by 2012 to allow for effective<br />
and timely implementation of the Wai‘ula‘ula <strong>watershed</strong> <strong>plan</strong>.<br />
Project ADMIN-1: Hire Wai‘ula‘ula <strong>watershed</strong> coordinator.<br />
Project Tasks:<br />
• Hire <strong>watershed</strong> coordinator with a wide range of skills and abilities to<br />
implement, administer, and evaluate the full spectrum of projects contained<br />
in the <strong>watershed</strong> <strong>management</strong> <strong>plan</strong>.<br />
• Maintain communication among project partners to facilitate information<br />
sharing and project implementation.<br />
• Revise and update <strong>watershed</strong> <strong>management</strong> <strong>plan</strong> as <strong>management</strong> needs<br />
change, <strong>management</strong> techniques evolve, and new data become available.<br />
163<br />
Wai‘ula‘ula Watershed Management Plan DRAFT MK<strong>SWCD</strong>
Objective 8b: Implement monitoring program described in Chapter 6, following the<br />
timeframes established.<br />
Project: MONIT-1: When <strong>management</strong> <strong>plan</strong> implementation begins, initiate monitoring<br />
components described in Chapter 6.<br />
Project Tasks:<br />
• By 2013, develop a stream corridor assessment mechanism by which to<br />
rapidly identify environmental problems present within a stream system<br />
and along its riparian corridor and to provide sufficient information on each<br />
problem so that both the severity and correctability can be determined and<br />
restoration efforts can be prioritized. These problems could include erosion<br />
sites, inadequate stream buffers, fish migration blockages, exposed or<br />
discharging pipes, channelized stream sections, trash dumping sites, in or<br />
near-stream construction, streambank instability, areas prone to flooding,<br />
areas of invasive <strong>plan</strong>t species, and any unusual conditions.<br />
• Undertake monitoring described under above projects (with details<br />
provided in Chapter 6).<br />
• Monitor project implementation and measure success towards achieving<br />
project goals and objectives.<br />
• Track installation of <strong>management</strong> practices and gage effectiveness of these<br />
practices in preventing or reducing pollutant loads.<br />
• Institute long-term water quality monitoring described in Chapter 6.<br />
• Implement monitoring of <strong>watershed</strong> conditions as described in Chapter 6.<br />
164<br />
Wai‘ula‘ula Watershed Management Plan DRAFT MK<strong>SWCD</strong>
Table 19: Summary of Implementation Projects<br />
165<br />
Wai‘ula‘ula Watershed Management Plan DRAFT MK<strong>SWCD</strong>
166<br />
Wai‘ula‘ula Watershed Management Plan DRAFT MK<strong>SWCD</strong>
167<br />
Wai‘ula‘ula Watershed Management Plan DRAFT MK<strong>SWCD</strong>
168<br />
Wai‘ula‘ula Watershed Management Plan DRAFT MK<strong>SWCD</strong>
169<br />
Wai‘ula‘ula Watershed Management Plan DRAFT MK<strong>SWCD</strong>
170<br />
Wai‘ula‘ula Watershed Management Plan DRAFT MK<strong>SWCD</strong>
171<br />
Table 20: Project Timelines<br />
NUTR-1 – Assist Lālāmilo farmers with Conservations Plans<br />
NUTR-2 – Fence riparian areas to exclude cattle<br />
NUTR-3 – OSDS education and outreach<br />
NUTR-4 – Incorporate point-of-sale inspections of OSDS<br />
SED-1 -- Assist Lālāmilo farmers with Conservations Plans<br />
SED-2 – Extend Waimea Irrigation System to rock wall<br />
SED-3 – Subdivide paddocks between Lālāmilo and rock wall<br />
SED-4 – Assess streambank erosion<br />
SED-5 – goat removal from rock wall to Queen Ka‘ahumanu<br />
SED-6 – goat removal below Queen Ka‘ahumanu<br />
SED-7 – Identify and revegetate bare land in <strong>watershed</strong><br />
FIRE 1 – Fence and graze area between rock wall and Queen K<br />
FIRE-2 – Fence area below Queen K to manage fine fuels<br />
FIRE-3 – Update fire resources maps (3 periodic updates)<br />
FIRE-4 – Develop agreements for access and water use<br />
FIRE-5 – Construct and/or maintain 6 miles of fuel breaks<br />
FIRE-6 – Develop post-fire restoration manual<br />
STORM-1 – survey and line catch basins within <strong>watershed</strong><br />
STORM-2 – dry well insert installation and maintenance program<br />
STORM-3 – stormwater education and outreach program<br />
STORM-4 – upgrade existing urban runoff control structures<br />
STORM-5 – develop operation and maintenance guidelines for roads<br />
STORM-6 – develop and implement LID outreach program<br />
STREAM-1 – convert marginal grazing lands via CREP<br />
STREAM-2 –events/projects to educate about riparian buffers<br />
STREAM-3 – restore riparian areas within the <strong>watershed</strong><br />
STREAM-4 – policy language for County overlay district<br />
AQU-1 – remove illegal diversions<br />
Wai‘ula‘ula Watershed Management Plan DRAFT MK<strong>SWCD</strong><br />
12 13 14 15 16 17 18 19 20 21 22 23
AQU-2 – evaluate need for specific instream flow standards<br />
AQU-3 – determine effects of dams on ‘o‘opu habitat<br />
AQU-4 – invasive aquatic species control<br />
AQU-5 – protect priority instream perennial pools<br />
EDU-1 – develop/ adapt educational materials<br />
EDU-2 – provide on-the-ground service learning opportunities<br />
ADMIN-1 – Wai‘ula‘ula <strong>watershed</strong> coordinator<br />
MONIT-1 – implement monitoring program<br />
12 13 14 15 16 17 18 19 20 21 22 23<br />
172<br />
Wai‘ula‘ula Watershed Management Plan DRAFT MK<strong>SWCD</strong>
Chapter 6: Monitoring<br />
Monitoring is an essential part of <strong>watershed</strong> <strong>plan</strong>ning. Monitoring can identify emerging<br />
problems or document response to changes in land use or climate. Equally important,<br />
monitoring is needed to evaluate the effectiveness of implemented BMPs.<br />
This chapter addresses EPA's key element (i).<br />
Monitoring activities will be conducted by MK<strong>SWCD</strong> personnel, contractors, and trained citizen<br />
volunteers.<br />
6.1 Implementation Monitoring<br />
Implementation monitoring determines whether the <strong>management</strong> strategies outlined in the<br />
work <strong>plan</strong> are being implemented as written. Data gathered from this monitoring will help the<br />
District determine how well it is doing in implementing the work <strong>plan</strong>, as well as help the<br />
District modify the <strong>management</strong> strategies as needed to better protect water quality.<br />
Implementation monitoring involves:<br />
• documenting types, amounts and locations of <strong>management</strong> activities on a quarterly<br />
basis;<br />
• comparing results with interim milestones included in an implementation <strong>plan</strong>;<br />
• providing feedback to stakeholders; and<br />
• determining need for modifications.<br />
Agendas, minutes, activity and project status reports, and other records should be maintained<br />
so that important issues and decisions are well-documented.<br />
6.2 Land Use Monitoring<br />
Changes in land use have the potential to result in changes to water quality or integrity of<br />
riparian habitats. Such changes should be tracked and correlated with changes in baseline<br />
water quality (see section 6.3). Each year, the <strong>watershed</strong> coordinator will compile a list of land<br />
use changes occurring in the <strong>watershed</strong>, noting<br />
1) Planned developments that generate draft or final EIS;<br />
2) Rezoning;<br />
3) Actual construction of new developments, noting the proximity to stream channels or the<br />
ocean, and noting arrangements for wastewater;<br />
173<br />
Wai‘ula‘ula Watershed Management Plan MK<strong>SWCD</strong>
4) Changes to permitted diversions;<br />
5) If available, the actual amounts of water diverted by major users (e.g., DWS, Parker Ranch)<br />
should be documented and broken down by stream; and<br />
6) Other changed deemed worthy of note.<br />
6.3 Long-Term Routine Monitoring of Water Quality<br />
Long-term monitoring of water quality is needed to:<br />
1) Identify whether new disturbances or <strong>management</strong> activities (sections 6.1 and 6.2) are<br />
having a negative or positive impact on water quality.<br />
2) Measure whether there are progressive changes in water quality, either for better or for<br />
worse.<br />
3) Evaluate, when fires occur, whether there are downstream impacts.<br />
4) Evaluate year-to-year variability in order to more realistically evaluate pre- and postmonitoring<br />
of BMPs.<br />
There is no substitute for long-term monitoring, yet the cost of water quality monitoring is a<br />
significant barrier to its occurrence. A reasonably-priced baseflow monitoring program is,<br />
therefore, proposed as a realistic approach for routine monitoring. Also, to minimize costs, the<br />
parameters to be measured are restricted to those that are currently causing water quality<br />
impairments or do not have analytical lab costs (turbidity and oxygen).<br />
Several lessons were learned from the monitoring conducted during the development of this<br />
<strong>plan</strong>. For example, in order to isolate the effect of the Waimea urban area on the Wai’ula’ula<br />
stream, measurements must be taken both below and above town. The Sandalwood site was<br />
satisfactory for the site below town, but the Marine Dam site may be too far upstream from<br />
Waimea. It is, therefore, recommended to monitor only a short distance upstream from<br />
Waimea. Another lesson was that reliable source characterization requires simultaneous<br />
measurements at multiple sites.<br />
6.3.1 Recommendations for Long-term Baseflow Monitoring<br />
What will be monitored (fresh water):<br />
o Turbidity (streamside measurement)<br />
o TP (vial filled at streamside and frozen pending shipment to lab)<br />
o TN (filtered at streamside; vial and filters frozen pending shipment to lab)<br />
o Ammonia (mouth of <strong>watershed</strong> only; needed to see if marine ammonia<br />
impairment is from the stream or from submarine groundwater discharge.)<br />
o When safe, measurements will be depth- and cross-sectionally integrated.<br />
174<br />
Wai‘ula‘ula Watershed Management Plan MK<strong>SWCD</strong>
o DO (instream perennial pools only) (DO is expected to be impaired in the pool<br />
but not in the stream.)<br />
Note: Ideally, chlorophyll-a would be measured in the instream perennial pools,<br />
but there is no convenient, local facility for measurement, nor an inexpensive insitu<br />
probe. TP and TN can be analyzed at the University of Hawai‘i at Hilo<br />
analytical laboratory.<br />
Where monitoring will be conducted (fresh water):<br />
o Waikoloa stream immediately above Waimea (near DWS gate)**<br />
o Waikoloa stream immediately below Waimea (Sandalwood autosampler site)<br />
(Compare with data from site listed above to see urban influence)*<br />
o Waikoloa stream below Lālāmilo Farm Lots (compare with data from<br />
Sandalwood site to see influence of farms and landfill.)***<br />
o <strong>Kea</strong>nu‘i‘omanō stream below confluence with Lanikepu***<br />
o Immediately upstream of mouth of Wai‘ula‘ula stream (autsampler site)*<br />
o Several miles upstream of mouth of Wai‘ula‘ula stream (at Queen Ka‘ahumanu<br />
Highway) (Compare to data from autosampler site at mouth of Wai‘ula‘ula<br />
stream to see influence of oceanside urban/resort zone.)***<br />
o Instream perennial pools at various elevations within <strong>watershed</strong>*<br />
Note: Because funding levels are uncertain, sites are prioritized: * is highest priority,<br />
** is medium priority, and *** is lower priority.<br />
Frequency (fresh water):<br />
o Following dry periods, sampling will be conducted within one week of when<br />
stream begins to flow.<br />
o A subsequent sample will occur two weeks later (if stream is still flowing), and<br />
then 4 weeks after that (if stream is still flowing).<br />
o The instream perennial pool samples shall be taken at least quarterly, even if the<br />
streams are not flowing.<br />
o Samples shall be taken on the same day when feasible. (Simultaneous<br />
measurements at multiple sites.)<br />
Criteria for success (fresh water):<br />
o In any year, and at any sampling site, the geometric mean of measurements shall<br />
be less than water quality standards for the dry season.<br />
175<br />
Wai‘ula‘ula Watershed Management Plan MK<strong>SWCD</strong>
o In any year, and for every upstream/downstream sampling pair, the difference<br />
between upstream values and downstream values shall be indistinguishable<br />
from zero according to a paired t-test.<br />
Estimated costs are as follows:<br />
• First year cost of $1,600 for turbidimeter and oxygen meter.<br />
• Subsequent years’ annual cost of $600 for turbidimeter standards, replacement oxygen<br />
membranes/fluids, and replacement filter holders.<br />
• $35-40 per sample for field supplies and analytical costs. Depending on the number of<br />
sampling dates and sites, this cost will range from $600/yr to $1,500 yr.<br />
• Volunteer labor or commitments by MK<strong>SWCD</strong> personnel is assumed.<br />
• The recommended monitoring is for feedback into the <strong>watershed</strong> <strong>plan</strong>ning process. It is<br />
not intended to provide a basis for regulatory determination of compliance with water<br />
quality standards. Costs would rise substantially if additional measures (e.g. certified<br />
laboratory) were added so that data meet protocols at the regulatory level.<br />
6.3.2 Recommended Long-term Marine Monitoring<br />
Maintenance of water quality in the marine receiving waters is an important part of the<br />
rationale for managing nonpoint pollutants in the <strong>watershed</strong>. Recent measurements of the<br />
receiving waters indicate impairments of ammonia and algae. These parameters should be<br />
monitored in the future.<br />
What will be monitored (nearshore marine waters):<br />
o Ammonia<br />
o Chlorophyll-a<br />
Note: measurement protocols shall be consistent with DOH procedures for its<br />
routine monitoring of nearshore marine waters. Ammonia can be analyzed by<br />
the UH-Hilo analytical laboratory, but chlorophyll-a may need to be analyzed at a<br />
DOH facility.<br />
Where monitoring will be conducted (nearshore marine waters):<br />
o Kawaihae Bay at the same location(s) where DOH has previously taken<br />
measurements.<br />
176<br />
Wai‘ula‘ula Watershed Management Plan MK<strong>SWCD</strong>
Frequency (nearshore marine waters):<br />
o Ideally, on the same day that the streams are sampled, but in no case less than<br />
quarterly.<br />
Criteria for success (nearshore marine waters):<br />
o In any year, the geometric mean shall be less than water quality standards for<br />
the dry season.<br />
6.3.3 Recommendations for Stormflow Monitoring<br />
Characterization of annual loads in the <strong>watershed</strong> is incomplete. Water quality and nutrient<br />
loads vary with the weather, so a longer monitoring period means that a wider variety of<br />
conditions are sampled. While some load data have been collected, they do not span an entire<br />
year, nor do they fully represent the various sub-<strong>watershed</strong>s. If the goal is to use<br />
measurements to characterize pollutant sources, it is important to take simultaneous<br />
measurements at several locations (upper Waikoloa stream, Waikoloa stream below Waimea,<br />
<strong>watershed</strong> outlet, <strong>Kea</strong>nu‘i‘omanō stream) in order to evaluate the effects of anthropogenic and<br />
natural conditions on water quality.<br />
Unfortunately, annual load measurements require the installation of autosamplers. Costs are<br />
very high. For example, contracts with the USGS to provide data meeting regulatory protocols<br />
are on the order of $50,000 per year per site. The District owns one autosampler and in the<br />
past has borrowed three others from DOH. Using these autosamplers and having samples<br />
analyzed locally (and not necessarily at a certified lab) will help keep costs down.<br />
In the event that funding becomes available, there is no substitute for autosampler-based<br />
stormflow measurements of sediment and nutrient loads. In this case, the following<br />
measurement program is recommended.<br />
What will be monitored:<br />
o TN, TP, nitrate, TSS<br />
o Ammonia (at <strong>watershed</strong> mouth only)<br />
Where monitoring will be conducted: (these may need to be prioritized, given number of<br />
autosamplers available)<br />
o Waikoloa stream immediately above Waimea (near DWS gate)<br />
o Waikoloa stream immediately below Waimea (Sandalwood autosampler site)<br />
(Compare with data from the above site to see urban influence)<br />
o <strong>Kea</strong>nu‘i‘omanō stream below confluence with Lanikepu<br />
177<br />
Wai‘ula‘ula Watershed Management Plan MK<strong>SWCD</strong>
o Immediately upstream of mouth of Wai‘ula‘ula stream (reoccupy the previouslyused<br />
site)<br />
o Several miles upstream of mouth of Wai‘ula‘ula stream (at Queen Ka‘ahumanu<br />
Highway) (Compare to data from autosampler site at mouth of Wai‘ula‘ula<br />
stream to see influence of oceanside urban/resort zone.)<br />
o Immediately upstream of Pelekane Bay (at highway; former autosampler site).<br />
Frequency:<br />
o Every storm for at least one year.<br />
6.4 Monitoring of Watershed Condition<br />
The purpose of the <strong>watershed</strong> condition monitoring is to assess the status and trend of<br />
<strong>watershed</strong> attributes to help determine if Wai‘ula‘ula <strong>watershed</strong> <strong>management</strong> efforts are<br />
achieving goals of maintaining and restoring a healthy <strong>watershed</strong>. Recommended types of<br />
monitoring are described below.<br />
6.4.1. Vegetation Monitoring<br />
6.4.1.1. Stubble Height Monitoring<br />
In 2001, the Natural Resources Conservation Service (NRCS) established general guidelines for<br />
judging proper grazing use on grass pasture as part of its Standards and Specifications for<br />
Prescribed Grazing (528A). Regular stubble height monitoring can be used as a <strong>management</strong><br />
tool to determine when cattle should be rotated out of paddocks, based on the minimum<br />
heights established under NRCS’s standards and specifications, and as a monitoring tool to<br />
ensure that grasslands are being sufficiently grazed to reduce the fuel load but are not being<br />
over-grazed.<br />
What will be monitored:<br />
o Key forage grass species (e.g., kikuyu, buffel)<br />
Where monitoring will be conducted:<br />
o Sampling sites will be established in all paddocks used for cattle grazing within<br />
the <strong>watershed</strong>. Sampling sites will also be established in grasslands that are<br />
currently ungrazed, for comparative purposes.<br />
178<br />
Wai‘ula‘ula Watershed Management Plan MK<strong>SWCD</strong>
Frequency:<br />
o Semi-annually in each paddock.<br />
o For projects involving introduction of cattle to previously ungrazed areas, before<br />
introduction of cattle for baseline data, bi-weekly while cattle are present to<br />
document grazing efficiency and estimate removal date, regularly after cattle<br />
removal to track grass growth and estimate fuel loading.<br />
6.4.1.2. Fuel Loads<br />
Fine fuels created by non-native grasses are a land <strong>management</strong> problem in leeward Hawai‘i.<br />
These fuels facilitate the ignition of wildfires and promote their spread. By measuring<br />
representative fuel loads before and after fuels <strong>management</strong> projects are implemented, the<br />
amount of fuel loading reduced by each project can be calculated as a measure of success in<br />
mitigating wildfire risk.<br />
Transects will be established within areas of grass fuels at different elevations within the<br />
marginal, fire-prone <strong>watershed</strong> lands below the 2,500-ft. elevation. Permanent, 100 m transect<br />
lines will be established and marked with rebar or metal stakes at both ends, which will be<br />
GPSed for ease of finding the sites again. Plots will be established every 10 m along each<br />
transect with the first plot at 0 m and the last at 90 m. A total of 10 samples will be collected<br />
from each transect line. Daubenmire frames (20cm x 50cm) will be used to delineate each plot.<br />
All standing grass (biomass) at each plot will be clipped as close to the ground as possible and<br />
placed in zip-lock plastic bags labeled with the transect and plot numbers. Samples will be<br />
weighed within 12 hours from collection to obtain the wet weights. The clippings from each<br />
plot will then be transferred into paper bags for drying in a convection oven at 100º C. The<br />
samples will be checked for completeness of drying and will be considered totally dry if the dry<br />
weight of the samples does not change over two consecutive weighing sessions.<br />
Fuel loads will be extrapolated to a hectare. Fuel loads from sites where fuels <strong>management</strong><br />
practices have been implemented will be compared with baseline or ungrazed loads to<br />
determine the amount of fuel biomass that has been eliminated from the area, thereby<br />
reducing wildfire risk.<br />
Assessing fuel loads is a relatively low-cost undertaking, with negligible material and equipment<br />
costs. The costs associated with this monitoring are for field and laboratory personnel.<br />
What will be monitored:<br />
o Fuel biomass within ten 20cm x 50cm quadrats (or plots) along each 100m<br />
transect line<br />
179<br />
o There will be two 100m transect lines at each sampling site for a total of 20<br />
sampled plots per site<br />
Wai‘ula‘ula Watershed Management Plan MK<strong>SWCD</strong>
Where monitoring will be conducted:<br />
o 1-3 transects will be established in grassy areas that have not been grazed (i.e.,<br />
adjacent to streams where cattle are currently excluded) to determine a<br />
representative worse-case fuel loading (or baseline without grazing and fire).<br />
o Transects will be established in currently ungrazed and marginally-grazed areas<br />
where grazing will be established, grazing infrastructure improved, or other fuels<br />
<strong>management</strong> techniques implemented.<br />
Frequency:<br />
o Before the implementation of any fuels <strong>management</strong> project<br />
o Annually, at the end of the wet season and before the beginning of the dry<br />
season<br />
Criteria for Success:<br />
o Fuel loads averaging 1,500 lbs per acre for buffel grass.<br />
6.4.1.3. Vegetation Transects<br />
The purpose of vegetative cover monitoring is to determine percent and composition of<br />
groundcover in the <strong>watershed</strong>, as an indicator of <strong>watershed</strong> health. This is a common method<br />
to evaluate land degradation and recovery, and the success of restoration projects. While there<br />
are various methodologies to quantify vegetation cover and composition, a line-point intercept<br />
sampling method will be used in the Wai‘ula‘ula <strong>watershed</strong>. Monitoring will focus on<br />
vegetation cover.<br />
Using the sampling method described in Godinez-Alvarez et al. (2009), four parallel 70 m<br />
transects, separated by at least 10 m, will be established in a representative area of each<br />
monitoring site. End-points of transect lines will be marked with rebar or metal stakes, which<br />
will be GPSed for ease of finding the sites again. A 1-mm diameter pole will be dropped at<br />
every meter along each transect, for a total of 70 points per transect and 280 points per site. At<br />
each point, the simple presence or absence of vegetation will be noted. Vegetation cover will<br />
be estimated by dividing the total number of <strong>plan</strong>t intercepts by the total number of points per<br />
transect. On occasion, the <strong>plan</strong>t species contacted by the pole will also be recorded, in order to<br />
provide a general record of species composition.<br />
Assessing vegetation cover is a relatively low-cost undertaking, with negligible material and<br />
equipment costs. The costs associated with this monitoring are for field personnel.<br />
What will be monitored:<br />
o Presence or absence of vegetation at one-meter intervals along four 70m<br />
transects<br />
180<br />
Wai‘ula‘ula Watershed Management Plan MK<strong>SWCD</strong>
o On occasion, <strong>plan</strong>ts species will also be noted<br />
Where monitoring will be conducted:<br />
o Transects will be established at representative elevations within the marginal,<br />
fire-prone <strong>watershed</strong> lands below the 2,500-ft. elevation<br />
o Vegetation transects will be established in conjunction with erosion pin<br />
monitoring. We anticipate that, as vegetative cover at a project site increases,<br />
erosion rates will decrease.<br />
Frequency:<br />
o Before the implementation of any fuels <strong>management</strong> project<br />
o Annually, at the end of the wet season and before the beginning of the dry<br />
season<br />
Criteria for Success:<br />
o On bare land, a statistically-significant increase in vegetation cover<br />
o For vegetation transects associated with revegetation projects, a statisticallysignificant<br />
increase in vegetative cover and a statistically-significant reduction in<br />
erosion rates (see Section 6.4.3.2.)<br />
6.4.2. Stream Condition Assessment<br />
A first step to restoring riparian buffers is the development of a mechanism by which to identify<br />
environmental problems present within a stream system and along its riparian corridor and to<br />
provide sufficient information on each problem so that both the severity and correctability can<br />
be determined and restoration efforts can be prioritized. Maryland has developed survey<br />
protocols for a Stream Corridor Assessment to rapidly measure the general physical condition<br />
of a stream system and identify the locations of a variety of environmental problems within its<br />
stream corridors (Yetman 2001). These problems could include erosion sites, inadequate<br />
stream buffers, fish migration blockages, exposed or discharging pipes, channelized stream<br />
sections, trash dumping sites, in or near-stream construction, streambank instability, areas<br />
prone to flooding, areas of invasive <strong>plan</strong>t species, and any unusual conditions. Such a survey<br />
tool will be developed for the <strong>watershed</strong> (and applicable to all of Hawai‘i) to help determine<br />
specific areas in which to focus limited resources. Upon the completion of the survey tool,<br />
monitoring will be conducted.<br />
What will be monitored:<br />
o All stream corridors throughout the <strong>watershed</strong><br />
181<br />
Wai‘ula‘ula Watershed Management Plan MK<strong>SWCD</strong>
Where monitoring will be conducted:<br />
o The length of all stream corridors will be walked, with the exception of segments<br />
that cannot be accessed safely. Inaccessible reaches in the upper <strong>watershed</strong> will<br />
also be excluded.<br />
Frequency:<br />
o Bi-annually<br />
6.4.3. Erosion Monitoring<br />
6.4.3.1. Infiltration Rates<br />
A tension disc infiltrometer test conducted in the lower <strong>watershed</strong> in 2010 indicated a<br />
preliminary saturated hydraulic conductivity of 10 mm/hr. for silt-sized material. This means<br />
that once the surface becomes saturated, rainfall in excess of 10 mm/hr is likely to generate<br />
surface runoff, resulting in erosion of bare soil by rainsplash, sheetwash, and rill/channel<br />
incision.<br />
Determining infiltration rates throughout the <strong>watershed</strong> will help us to understand what<br />
intensity of rainfall will lead to surface runoff and associated erosion, and how this varies in<br />
different parts of the <strong>watershed</strong>. We can expect infiltration rates to increase with elevation<br />
(based on soil type, weathering, etc.) and with vegetative cover.<br />
What will be monitored:<br />
o Representative bare lands<br />
Where monitoring will be conducted:<br />
o At different elevations within the <strong>watershed</strong><br />
o In conjunction with erosion pin monitoring and revegetation/ restoration<br />
projects<br />
Frequency:<br />
o Every four years<br />
o Annually, in association with revegetation/ restoration projects<br />
182<br />
Wai‘ula‘ula Watershed Management Plan MK<strong>SWCD</strong>
6.4.3.2. Erosion Rates<br />
The least-expensive method to begin estimating erosion rates is called erosion pin monitoring.<br />
A network or array of long nails whose heads are driven flush with the ground will be installed<br />
in representative locations within the <strong>watershed</strong> and in association with specific projects. Data<br />
from a USGS project on Molokai demonstrated that erosion pin values closely approximate the<br />
value from other far more expensive techniques such as repeat ground-based LiDAR and<br />
suspended sediment yields (Stock 2010). In the Wai‘ula‘ula <strong>watershed</strong>, a network of pins will<br />
be installed on representative hillslopes suspected of providing fines to stream channels, on<br />
representative legacy fill terraces in stream channels, and on suspected eroding streambanks.<br />
Each erosion pin monitoring site on hillslopes and legacy fill terraces will consist of 50 pins<br />
installed in similar topography to provide representative values. Streambank monitoring sites<br />
will consist of 20 pins. Each line of pins should be parallel or normal to the local slope, with<br />
rebar or large stakes marking each end. The nails should be spaced at even increments so far as<br />
groundcover permits (e.g., every 0.5 m, every 1.0 m, etc.). The rebar or stakes should be GPSed<br />
to facilitate finding the monitoring site.<br />
At least once a year, trained volunteers or MK<strong>SWCD</strong> personnel will measure the amount of<br />
sediment lowering at each pin (in mm).<br />
Tipping bucket rain gages will be installed at representative elevations as part of this<br />
monitoring effort. One rain gage was installed in the lower <strong>watershed</strong> in 2011. Three to four<br />
additional rain gages will be installed at a range of elevations, at a cost of $500 per rain gage,<br />
plus $260 for a download shuttle. Rainfall data will be collected electronically on an hourly<br />
basis and downloaded every two months.<br />
Data from the erosion pins coupled with rainfall data will enable us to determine erosion rates<br />
for specific areas. In order to normalize erosion rates to account for the infrequent but highintensity<br />
rainfall that defines this leeward landscape, the average annual amount of lowering<br />
measures at each network on pins (in mm) will be divided by the amount of time (in hours) that<br />
rainfall, as measured by the nearest rain gage, exceeds the infiltration capacity of 10 mm/hr. (or<br />
infiltration rate determined for that specific location).<br />
What will be monitored:<br />
o Representative hillslopes, hydrologically-connected to a stream and suspected of<br />
providing fines to stream channels<br />
o Representative legacy fill terraces in stream channels<br />
o Suspected eroding streambanks at representative elevations<br />
Where monitoring will be conducted:<br />
o At different elevations within the <strong>watershed</strong><br />
183<br />
Wai‘ula‘ula Watershed Management Plan MK<strong>SWCD</strong>
o In conjunction with erosion pin monitoring and revegetation/ restoration<br />
projects<br />
Frequency:<br />
o Annually<br />
Criteria for Success:<br />
o Statistically-significant reduction in erosion rates over 67% of pins<br />
o For erosion monitoring associated with revegetation projects, a statisticallysignificant<br />
increase in vegetative cover (see Section 6.4.1.3.) and a statisticallysignificant<br />
reduction in erosion rates<br />
6.4.4. Biological Surveys of Aquatic Species<br />
Assessment of ecosystem health can be based either on water quality or on biological<br />
populations. A healthy ecosystem is diverse and contains native species. A number of<br />
biological surveys have been conducted in the Wai‘ula‘ula <strong>watershed</strong> since 1968. Survey data<br />
have been compiled by DLNR and indicate high biodiversity of native species found in the<br />
<strong>watershed</strong>. Regular stream surveys will be conducted to monitor changes in biological<br />
communities.<br />
What will be monitored:<br />
o Emphasis will be on native aquatic species<br />
o Other species will be noted, along with qualitative measures of ecosystem health<br />
(e.g., stagnant water, algae, etc.)<br />
Where monitoring will be conducted:<br />
o Freshwater streams, with an emphasis on sites previously monitored<br />
o Instream perennial pools, with an emphasis on sites previously monitored<br />
o Nearshore waters at the mouth of the <strong>watershed</strong><br />
Frequency:<br />
o Once every four years<br />
184<br />
Wai‘ula‘ula Watershed Management Plan MK<strong>SWCD</strong>
6.5 Monitoring Plan Implementation<br />
6.5.1. Sampling and Analysis Plan (SAP)<br />
A detailed sampling and analysis <strong>plan</strong> that outlines parameters to be monitored, sampling<br />
location and frequency, roles and responsibilities, documentation and records, quality control<br />
requirements, and chain of custody will be developed prior to implementation of <strong>management</strong><br />
projects.<br />
6.5.2. Data Management<br />
The <strong>watershed</strong> coordinator will maintain the SAP and be the point person for communications<br />
concerning any updates or changes to the SAP.<br />
Information and records to be included in the final data report package include:<br />
1. Field notes (photocopies).<br />
2. Laboratory results in ASCII or Excel format.<br />
3. Hard copy and Excel files of water quality and field data.<br />
4. Detection levels of analytical methods.<br />
5. Map and GPS coordinates showing location of sample sites.<br />
6. Photographs of field sites, especially for vegetation monitoring projects.<br />
7. Documentation of field procedures, sample collection, lab methods, and any special<br />
conditions or circumstances.<br />
8. Chain of custody forms.<br />
All original data, including field notes and laboratory analyses, will be archived by the <strong>Mauna</strong><br />
<strong>Kea</strong> Soil and Water Conservation District.<br />
6.5.3. Adaptive Management Approach<br />
The monitoring component of the Wai‘ula‘ula <strong>watershed</strong> <strong>management</strong> <strong>plan</strong> is a working<br />
document. It is expected that the implementation process will reveal new information,<br />
emerging technologies, and practical operational realities that can be used to improve or revise<br />
the monitoring strategies. An adaptive <strong>management</strong> approach is recommended, so that, as we<br />
learn from actions taken, future monitoring techniques and procedures can be altered as<br />
necessary in response.<br />
185<br />
Wai‘ula‘ula Watershed Management Plan MK<strong>SWCD</strong>
Chapter 7: Bibliography<br />
Allan, J.D. And M.M. Castillo. 2007. Stream Ecology: Structure and Function of Running Water,<br />
2 nd ed. Springer, Dordrecth, The Netherlands.<br />
Atkinson, I.A.E. 1977. A reassessment of factors, particularly Ruttus rattus L., that influenced<br />
the decline of endemic forest birds in the Hawaiian Islands. Pacific Science 31:109-133.<br />
Atwood, T., T. Wiegner; J. Turner, and R. MacKenzie. 2010. Potential Effects of an Invasive<br />
Nitrogen-Fixing Tree on a Hawaiian Stream Food Web. Pacific Science, 64(3):367-379.<br />
Bauer, Glen R. 2003. A Study of the Ground-Water Conditions in North and South Kona and<br />
South Kohala Districts, Island of Hawai‘i, 1991-2002. Prepared for the Hawai‘i<br />
Commission on Water Resources Management, PR-2003-01.<br />
Bergin, B. 2004. Loyal to the Land: The Legendary Parker Ranch, 750-1950. University of Hawai‘i<br />
Press, Honolulu.<br />
Char, W. P. 2002. Botanical Survey Lālāmilo Residential Lots and Commercial/Industrial Mixed<br />
Uses, Lālāmilo, Waimea, Hawai‘i. Prepared by Char & Associates for PBR Hawai‘i for<br />
DHHL’s proposed Lālāmilo Residential Homestead Lots.<br />
Chesapeake Bay Program. 2008. “Transportation.” Website:<br />
http://www.chesapeakebay.net/transportation.aspx?menuitem=14672<br />
Clark. 1981. An Archaeological Survey of the Proposed Lālāmilo Agricultural Park, South Kohala,<br />
Island of Hawai‘i, prepared for DOWALD, DLNR, State of Hawai‘i by the Department of<br />
Anthropology, B.P. Bishop Museum, Honolulu, Hawai‘i.<br />
Clark, J. T. and P.V. Kirch, Editors. 1983. Archaeological Investigations of the Mudlane-Waimea-<br />
Kawaihae Road Corridor, Island of Hawai‘i: An Interdisciplinary Study of an<br />
Environmental Transect. Report 83-1. Department of Anthropology, B.P. Bishop<br />
Museum, Honolulu, Hawai‘i.<br />
Clark, J.T. 1986. Waimea-Kawaihae: A Leeward Hawai‘i Settlement System. Thesis submitted in<br />
partial fulfillment of the requirements for a Ph.D. in Anthropology in the Graduate<br />
College of the University of Illinois at Urbana-Champaign.<br />
186<br />
Wai‘ula‘ula Watershed Management Plan MK<strong>SWCD</strong>
Cuddihy, L.W. and C.P. Stone. 1990. Alteration of Native Hawaiian Vegetation: Effects of<br />
Humans, their Activities and Introductions. Honolulu. University of Hawai‘i Press for<br />
University of Hawai‘i Press for University of Hawai‘i Cooperative National Park<br />
Resources Studies Unit, Honolulu, HI.<br />
Englund, R.A., A. Vorsino, and L.L. Englund. 2010. Aquatic Surveys for the ‘Ōuli 2 Project, Final<br />
Report. Prepared for Rana Biological Consulting, Inc.<br />
Englund, R.A., M.G. Wright, and D.A. Polhemus. 2007. Aquatic insect taxa as indicators of<br />
aquatic species richness, habitat disturbance, and invasive species impacts in Hawaiian<br />
streams. Biology of Hawaiian Streams and Estuaries in Bishop Museum Bulletin in<br />
Cultural and Environmental Studies 3: 207-232.<br />
Englund, R.A., D.J. Preston, and K. Arakaki. 2002. (HBS. 2002) Stream Survey of Waikoloa and<br />
<strong>Kea</strong>nu’i’omanō Streams, Hawai‘i Island. Prepared by Bishop Museum’s Hawai‘i Biological<br />
Survey for PBR Hawai‘i for DHHL’s proposed Lālāmilo Residential Homestead Lots.<br />
Fontaine, R. 2011. Telephone communication with Carolyn Stewart. February 18, 2011.<br />
Gaut, K. 2009. Application of the Nonpoint Source Pollution and Erosion Comparison Tool (N-<br />
SPECT) Model for Resource Management in the Wai‘ula‘ula Watershed, Island of<br />
Hawai‘i. Thesis in partial fulfillment of the requirements for the degree of Masters of<br />
Science, University of Hawai‘i.<br />
Geographic Decision Systems International (GDSI). 1994. State Definition and Delineation of<br />
Watersheds. Prepared for the Office of State Planning, Coastal Zone Management<br />
Program, State of Hawai‘i, Honolulu, Hawai‘i.<br />
Geographic Decision Systems International (GDSI). 1999. Refinement of Hawai‘i Watershed<br />
Delineations. Prepared for the Office of State Planning, Coastal Zone Management<br />
Program, State of Hawai‘i, Honolulu, Hawai‘i.<br />
Giambelluca, T.W., Nullet, M.A., and Schroeder, T.A. 1986. Rainfall Atlas of Hawai‘i. State of<br />
Hawai‘i, DLNR, Honolulu, Hawai‘i. Report R76.<br />
Giffen, J. 1977. Ecology of the feral pig on Hawai‘i Island. Elepaio 37: 140–142.<br />
Godinez-Alvarez, H., J.E. Herrick, M. Mattocks, D. Toledo, and J. Van Zee. 2009. Comparison of<br />
three vegetation monitoring methods: Their relative utility for ecological assessment<br />
and monitoring. Ecological Indicators 9: 1001-1008.<br />
Hawai‘i Commission on Water Resource Management (CWRM). 2008. Water Resource<br />
Protection Plan. Prepared for the State of Hawai‘i Commission on Water Resource<br />
Management by Wilson Okamoto Corporation.<br />
187<br />
Wai‘ula‘ula Watershed Management Plan MK<strong>SWCD</strong>
Hawai‘i Commission on Water Resource Management (CWRM). 2005. Surface-Water<br />
Hydrologic Units: A Management Tool for Instream Flow Standards. Prepared by CWRM,<br />
Dept. of Land and Natural Resources, State of Hawai‘i, June 2005. PR-2005-01.<br />
Hawai‘i Commission on Water Resource Management (CWRM). 1990. Hawai‘i Stream<br />
Assessment: A Preliminary Appraisal of Hawai‘i’s Stream Resources. Prepared for<br />
CWRM, Dept. of Land and Natural Resources, State of Hawai‘i by the Hawai‘i<br />
Cooperative Park Service Unit, National Parks Service, Honolulu, Hawai‘i. Report R84.<br />
Hawai‘i Conservation Alliance (HCA). 2009. Climate Change in the Hawaiian Islands.<br />
(http://hawaiiconservation.org/files/content/resources/publications/position_papers/2<br />
009_climate_change/hca_climatechange.pdf, accessed 9February2011)<br />
Hawai‘i County. 2001. Data Book.<br />
Hawai‘i County, Department of Water Supply (DWS). 2006. Hawai‘i County Water Use and<br />
Development Plan Update. Draft, dated December 2006, prepared by Fukunaga &<br />
Associates, Inc. for DWS.<br />
Hawai‘i County. 2005. Hawai‘i County General Plan, prepared by Hawai‘i County Planning<br />
Department, and adopted by the Hawai‘i County Council.<br />
Hawai‘i County. 2008. South Kohala Community Development Plan. Prepared by the South<br />
Kohala community with assistance from the Hawai‘i County Planning Department and<br />
Townscape, Inc.<br />
Hawai‘i Dept. of Agriculture (DOA). 2004. Agricultural Water Use and Development Plan.<br />
Prepared by Water Resource Associates in December 2003. Revised in December 2004.<br />
Hawai‘i Dept. of Hawaiian Homelands (DHHL). 2002. DHHL Lālāmilo Project, Lālāmilo, South<br />
Kohala, Island of Hawai‘i, Final Environmental Impact Statement. Prepared by PBR<br />
Hawai‘i.<br />
Hawai‘i Dept. of Health (DOH). 2002. Guidelines for the Treatment and Use of Recycled Water.<br />
Prepared by the DOH Wastewater Branch.<br />
Hawai‘i Dept. of Land and Natural Resources. 1973. Draft EIS, Pu‘ukapu Flood Control Project,<br />
Waimea, Hawai‘i.<br />
Hawai‘i Dept. of Land and Natural Resources (DLNR). 1989. Pu‘u o ‘Umi Natural Area Reserve<br />
Management Plan. Honolulu, November. 44 pp.<br />
188<br />
Wai‘ula‘ula Watershed Management Plan MK<strong>SWCD</strong>
Hawai‘i Dept. of Land and Natural Resources (DLNR). 2008. Atlas of Hawaiian Watersheds and<br />
Their Aquatic Resources. Prepared by J.E. Parham, G.R. Higashi, E.K. Lapp, D.G.K.<br />
Kuamo‘o, R.T. Nishimoto, S. Hau, J.M. Fitzsimons, D.A. Polhemus, and W.S. Devick.<br />
Hawai‘i Dept. of Transportation. 2005. Standard Specifications for Road and Bridge<br />
Construction.<br />
Hawai‘i Dept. of Transportation. 2006. Site Specific Best Management Practices (BMP) Plan<br />
Review Guidelines. State of Hawai‘i, Dept. of Transportation, Highways Division,<br />
Honolulu, Hawai‘i.<br />
Hawai‘i Dept. of Transportation. 2007. Storm Water Permanent Best Management Practices<br />
Manual. State of Hawai‘i, Dept. of Transportation, Highways Division, Honolulu, Hawai‘i.<br />
Holland, E.A, B.H. Braswell, F.J. Dentener, J.M. Sulzman, and M. James. 1999. Contemporary<br />
and pre-industrial global reactive nitrogen budgets. Biogeochemistry Vol.46: 7-43.<br />
Horsley Witten Group. 2006. Low Impact Development: A Practitioner's Guide for Hawai‘i. A<br />
publication of the Hawai‘i Office of Planning, Coastal Zone Management Program.<br />
Huebert, B., P. Vitousek, J. Sutton; T. Elias, J. Heath, S. Coeppicus, S. Howell, and B. Blomquist.<br />
1999. Volcano Fixes Nitrogen into Plant-Available Forms. Biogeochemistry 47:111-118.<br />
Huntington, T.G. 2006. Evidence for intensification of the hydrologic cycle. Journal of Hydrology<br />
319:83-95.<br />
Izuka, S.K., C.A. Senter, and A.G. Johnson. 2009. Reconnaissance Assessment of the Potential for<br />
Roadside Dry Wells to Affect Water Quality on the Island of Hawai‘i. USGS Scientific<br />
Investigations Report 2009-5249.<br />
Kohala Watershed Partnership (KWP). 2007. Kohala Mountain Watershed Management Plan.<br />
Kuba, G. 2005. New Development Management Measures for Urban Runoff in the County of<br />
Hawai‘i. Unpublished paper by Hawai‘i County Department of Public Works, dated<br />
8/29/05.<br />
Kuykendall, R.S. 1965. The Hawaiian Kingdom: Vol 1: 1778-1854. University of Hawai‘i Press,<br />
Honolulu, Hawai‘i.<br />
Larned, S. 1998. Nitrogen- versus phosphorus-limited growth and sources of nutrients for coral<br />
reef macroalgae. Marine Biology 132(3): 409-421.<br />
Larned, S. and S. Santos. Light- and nutrient-limited periphyton in low order streams of Oahu,<br />
Hawai‘i. 2000. Hydrobiologica 432(1-3): 101-111.<br />
189<br />
Wai‘ula‘ula Watershed Management Plan MK<strong>SWCD</strong>
Loope, L. 1998. Hawai‘i and the Pacific Islands. In Mac M.J., P.A. Opler, C.E. Puckett Haeker,<br />
and P.D. Doran, Status and Trend of the Nation’s Biological Resources, 2 vols, U.S.<br />
Department of the Interior, U.S. Geological Survey, Reston, VA.<br />
Macdonald, G.A., A.T. Abbott, F.L. Peterson. 1983. Volcanoes in the Sea: the Geology of Hawai‘i.<br />
Maly, K. and O. Maly. 2004. He Mo‘olelo ‘Āina: A Cultural Study of the Pu‘u o ‘Umi Natural Area<br />
Reserve and Kohala – Hāmākua Mountain Lands, Districts of Kohala and Hāmākua,<br />
Island of Hawai‘i. Prepared for Dept. of Land and Natural Resources Natural Area<br />
Reserves, Hilo, Hawai‘i.<br />
McEldowney, H. 1983. A description of major vegetation patterns in the Waimea-Kawaihae<br />
region during the early historic period. Report 16, pp. 407-449 in Clark, J.T. and P.V. Kirch<br />
(eds.) Archaeological Investigations of the Mudlane-Waimea-Kawaihae Road Corridor,<br />
Island of Hawai‘i. Dept. Anthro. B.P. Bishop Mus. Report 83-1, Departmental Report<br />
Series.<br />
McGuire K. and A.E. Haun. 2002. Cultural Impact Assessment of DHHL Residential Development<br />
at Lālāmilo, South Kohala District, Island of Hawai‘i. Prepared for PBR Hawai‘i for DHHL’s<br />
proposed Lālāmilo Residential Homestead Lots.<br />
Michaud, J. and T. Wiegner. 2011. Stream Nutrient Concentrations on the Windward Coast of<br />
Hawai‘i Island and Their Relationship to Watershed Characteristics, Pacific Science, in<br />
press.<br />
Nance, T. 2002. Water Supply, Wastewater and Drainage Assessment for DHHL’s proposed<br />
Lālāmilo Residential Homestead Lots.<br />
Oki, D. 2007. Flow Statistics for USGS Stream-Gaging Stations Operated in Hawai‘i from 1909-<br />
2005. Prepared by USGS in cooperation with the Hawai‘i Commission on Water<br />
Resource Management.<br />
Parham, J.E. and E.K. Lapp. 2006. Reach Classification for Hawaiian Streams. Standardized GIS<br />
methodology for determining reaches. Digital product.<br />
Ryder, M.H. and A. Fares. 2008. Evaluating Cover Crops (Sudex, Sunn Hemp, Oats) for Use as<br />
Vegetative Filters to Control Sediment and Nutrient Loading from Agricultural Runoff in<br />
a Hawaiian Watershed. Journal of the American Water Resources Association: 44(3).<br />
Schueler, T. 1995. Site Planning for Urban Stream Protection. Metropolitan Washington Council<br />
of Governments, Washington, DC.<br />
190<br />
Wai‘ula‘ula Watershed Management Plan MK<strong>SWCD</strong>
Shade, P. 1995. Water budget for the Kohala area, Island of Hawai‘i. U.S. Geological Survey,<br />
Water Resources investigations Report 95-4114.<br />
Smith, C.W. 1985. Impact of alien <strong>plan</strong>ts on Hawai‘i’s native biota. In: Stone, C.P. and J.M. Scott<br />
(eds.). Hawai‘i’s Terrestrial Ecosystems: Preservation and Management. Cooperative<br />
National Park Resources Studies Unit, University of Hawai‘i, Mānoa. Book Chapter. p.<br />
198.<br />
South Pacific Regional Environment Programme (SPREP). 2000. Invasive species in the Pacific: A<br />
technical review and draft regional strategy. Greg Sherley, technical editor, Apia, Samoa.<br />
Staples, G.W., and R.H. Cowie. 2001. Hawai‘i’s Invasive Species: A Hawai‘i Biological Survey<br />
Handbook. Bishop Museum Press, Honolulu. 116 pp.<br />
Stewart, M.C. 2009. Updated Management Measures for Hawai‘i’s Coastal Nonpoint Pollution<br />
Control Program. Prepared by MCS International for the Hawai‘i Department of Health,<br />
Polluted Runoff Control Program.<br />
Stock, J.D., M. Rosener, K.M. Schmidt, M.N. Hanshaw, B.A. Brooks, G. Tribble, J. Jacobi. 2010.<br />
Sediment budget for a polluted Hawaiian reef using hillslope monitoring and process<br />
mapping. Abstract #EP22A-01 for American Geophysical Union, Fall Meeting 2010.<br />
Stone, C.P. 1985. Feral Ungulates in Hawai‘i: Toward Controlling the Adverse Effects of<br />
Introduced Vertebrates. In: Stone, C.P. and J.M. Scott (eds.). Hawai‘i’s Terrestrial<br />
Ecosystems: Preservation and Management. Book Chapter.<br />
Tait, J.R. 2008. Variation of Sediment Trace Elements and Stream Nitrate Isotope Ratios with<br />
Land Use in the Wai‘ula‘ula and Hilo Bay Watersheds, Hawai‘i Island, Hawai‘i. Thesis in<br />
partial fulfillment of the requirements for the degree of Masters of Science, University<br />
of Hawai‘i.<br />
Timm, O. and H. F. Diaz. 2009. Synoptic-statistical approach to regional downscaling of IPCC<br />
21 st Century climate projections: seasonal rainfall over the Hawaiian Islands. J. Climate<br />
doi: 10.1175/2009JCLI2800.1<br />
Tomich, P. Quentin and Leslie W. Barclay. 1989. Potential for Protection and Revival of the<br />
Native Forest on the Southwest Slope of Kohala Mountain, Island of Hawai‘i. Paper<br />
prepared under the auspices of the Sierra Club and The Conservation Council for<br />
Hawai‘i.<br />
Tribble, G. 2008. Ground Water on Tropical Pacific Islands – Understanding a Vital Resource.<br />
U.S. Geological Survey Circular 1312, 35 pp.<br />
University of Hawai‘i. 2000. <strong>Mauna</strong> <strong>Kea</strong> Science Reserve Master Plan.<br />
191<br />
Wai‘ula‘ula Watershed Management Plan MK<strong>SWCD</strong>
University of Hawai‘i, Land Use Bureau. 1965. Detailed Land Classification – Island of Hawai‘i.<br />
Honolulu: Land Study Bureau, University of Hawai‘i. 758 pp.<br />
US Army, Hawai‘i and 25 th Infantry Division (Light). March 2000. Wildland Fire Management<br />
Plan: Pōhakuloa and Oahu Training Areas.<br />
USDA. 1973. Soil Survey of the Island of Hawai‘i, State of Hawai‘i.<br />
USDA, Natural Resources Conservation Service (NRCS). 2004. Engineering Report for the<br />
Waimea Nature (Ulu La`au) Park. Prepared by Dudley Kubo and Katina Henderson,<br />
NRCS, October 2004.<br />
USDA, Natural Resources Conservation Service (NRCS). 2007. Pacific Island Area eFOTG Section<br />
1 Cost Data for Conservation Planning Activities. www.nrcs.usda.gov/technical/efotg/<br />
US Environmental Protection Agency (EPA). 1993. Guidance Specifying Management Measures<br />
for Sources of Nonpoint Pollution in Coastal Waters. EPA-840-B-92-002.<br />
US Environmental Protection Agency (EPA). 2003. Protecting Water Quality from Urban Runoff.<br />
EPA 841-F-03-003.<br />
US Environmental Protection Agency (EPA). 2005. Handbook for Developing Watershed Plans<br />
to Restore and Protect Our Waters. EPA 841-B-05-005.<br />
US Environmental Protection Agency (EPA). 2007. Reducing Stormwater Costs through Low<br />
Impact Development (LID) Strategies and Practices. EPA 841-F-07-006.<br />
U.S. Fish and Wildlife Service. 1999. Draft Revised Recovery Plan for Hawaiian Waterbirds,<br />
Second Revision, Portland, Oregon.<br />
US Geological Survey, Hawaiian Volcano Obsevatory (USGS). 2009. Website:<br />
http://hvo.wr.usgs.gov/volcanoes/kohala/).<br />
Welsch, D. J. 2007. Riparian Forest Buffers: Function and Design for Protection and<br />
Enhancement of Water Resources. US Dept. of Agriculture, Forest Service, NA-PR-07-91.<br />
http://www.na.fs.fed.us/spfo/pubs/n_resource/riparianforests/index.htm<br />
Yetman, K.T. 2001. Stream Corridor Assessment Survey (SCA): Survey Protocols. Prepared for<br />
the Watershed Restoration Division, Chesapeake & Coastal Watershed Services,<br />
Maryland Dept. of Natural Resources.<br />
192<br />
Wai‘ula‘ula Watershed Management Plan MK<strong>SWCD</strong>