A Transportation Plan for the Greenleaf Terrace Neighborhood
A Transportation Plan for the Greenleaf Terrace Neighborhood
A Transportation Plan for the Greenleaf Terrace Neighborhood

Create successful ePaper yourself
Turn your PDF publications into a flip-book with our unique Google optimized e-Paper software.
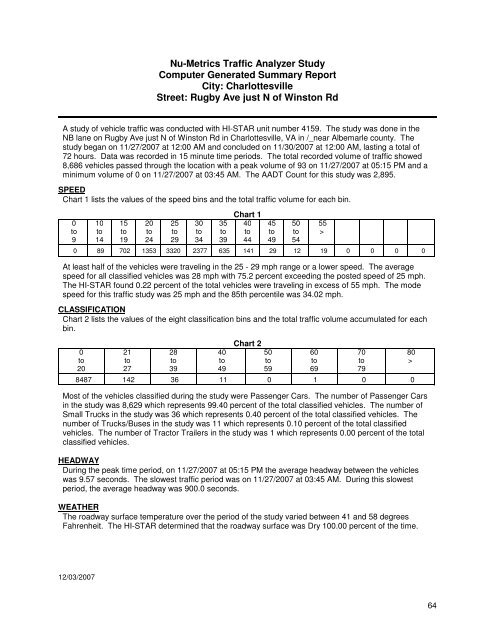
Nu-Metrics Traffic Analyzer Study<br />
Computer Generated Summary Report<br />
City: Charlottesville<br />
Street: Rugby Ave just N of Winston Rd<br />
A study of vehicle traffic was conducted with HI-STAR unit number 4159. The study was done in <strong>the</strong><br />
NB lane on Rugby Ave just N of Winston Rd in Charlottesville, VA in /_near Albemarle county. The<br />
study began on 11/27/2007 at 12:00 AM and concluded on 11/30/2007 at 12:00 AM, lasting a total of<br />
72 hours. Data was recorded in 15 minute time periods. The total recorded volume of traffic showed<br />
8,686 vehicles passed through <strong>the</strong> location with a peak volume of 93 on 11/27/2007 at 05:15 PM and a<br />
minimum volume of 0 on 11/27/2007 at 03:45 AM. The AADT Count <strong>for</strong> this study was 2,895.<br />
SPEED<br />
Chart 1 lists <strong>the</strong> values of <strong>the</strong> speed bins and <strong>the</strong> total traffic volume <strong>for</strong> each bin.<br />
0<br />
to<br />
9<br />
10<br />
to<br />
14<br />
15<br />
to<br />
19<br />
20<br />
to<br />
24<br />
25<br />
to<br />
29<br />
30<br />
to<br />
34<br />
35<br />
to<br />
39<br />
Chart 1<br />
40<br />
to<br />
44<br />
0 89 702 1353 3320 2377 635 141 29 12 19 0 0 0 0<br />
At least half of <strong>the</strong> vehicles were traveling in <strong>the</strong> 25 - 29 mph range or a lower speed. The average<br />
speed <strong>for</strong> all classified vehicles was 28 mph with 75.2 percent exceeding <strong>the</strong> posted speed of 25 mph.<br />
The HI-STAR found 0.22 percent of <strong>the</strong> total vehicles were traveling in excess of 55 mph. The mode<br />
speed <strong>for</strong> this traffic study was 25 mph and <strong>the</strong> 85th percentile was 34.02 mph.<br />
CLASSIFICATION<br />
Chart 2 lists <strong>the</strong> values of <strong>the</strong> eight classification bins and <strong>the</strong> total traffic volume accumulated <strong>for</strong> each<br />
bin.<br />
45<br />
to<br />
49<br />
50<br />
to<br />
54<br />
55<br />
><br />
0<br />
to<br />
20<br />
8487<br />
21<br />
to<br />
27<br />
142<br />
28<br />
to<br />
39<br />
40<br />
to<br />
49<br />
Chart 2<br />
50<br />
to<br />
59<br />
36 11 0 1 0 0<br />
60<br />
to<br />
69<br />
70<br />
to<br />
79<br />
80<br />
><br />
Most of <strong>the</strong> vehicles classified during <strong>the</strong> study were Passenger Cars. The number of Passenger Cars<br />
in <strong>the</strong> study was 8,629 which represents 99.40 percent of <strong>the</strong> total classified vehicles. The number of<br />
Small Trucks in <strong>the</strong> study was 36 which represents 0.40 percent of <strong>the</strong> total classified vehicles. The<br />
number of Trucks/Buses in <strong>the</strong> study was 11 which represents 0.10 percent of <strong>the</strong> total classified<br />
vehicles. The number of Tractor Trailers in <strong>the</strong> study was 1 which represents 0.00 percent of <strong>the</strong> total<br />
classified vehicles.<br />
HEADWAY<br />
During <strong>the</strong> peak time period, on 11/27/2007 at 05:15 PM <strong>the</strong> average headway between <strong>the</strong> vehicles<br />
was 9.57 seconds. The slowest traffic period was on 11/27/2007 at 03:45 AM. During this slowest<br />
period, <strong>the</strong> average headway was 900.0 seconds.<br />
WEATHER<br />
The roadway surface temperature over <strong>the</strong> period of <strong>the</strong> study varied between 41 and 58 degrees<br />
Fahrenheit. The HI-STAR determined that <strong>the</strong> roadway surface was Dry 100.00 percent of <strong>the</strong> time.<br />
12/03/2007<br />
Page:<br />
1