A Transportation Plan for the Greenleaf Terrace Neighborhood
A Transportation Plan for the Greenleaf Terrace Neighborhood
A Transportation Plan for the Greenleaf Terrace Neighborhood

You also want an ePaper? Increase the reach of your titles
YUMPU automatically turns print PDFs into web optimized ePapers that Google loves.
A <strong>Transportation</strong> <strong>Plan</strong><br />
<strong>for</strong> <strong>the</strong><br />
<strong>Greenleaf</strong> <strong>Terrace</strong> <strong>Neighborhood</strong><br />
Prepared <strong>for</strong> <strong>the</strong><br />
<strong>Greenleaf</strong> <strong>Terrace</strong> <strong>Neighborhood</strong> Association<br />
with assistance from<br />
The City of Charlottesville, Virginia<br />
Randy Selleck<br />
May 2008<br />
Virginia Commonwealth University<br />
L. Douglas Wilder School of Government and Public Affairs<br />
Department of Urban Studies and <strong>Plan</strong>ning<br />
Master of Urban and Regional <strong>Plan</strong>ning
Table of Contents<br />
Introduction..................................................................................................... 1<br />
Existing Conditions......................................................................................... 3<br />
General <strong>Neighborhood</strong> Characteristics........................................................................... 3<br />
<strong>Neighborhood</strong> Demographic Data .................................................................................. 4<br />
Existing Road Infrastructure........................................................................................... 7<br />
Existing Signalization and Signage .............................................................................. 10<br />
Existing Bicycle & Pedestrian Infrastructure ............................................................... 12<br />
Existing Public <strong>Transportation</strong> Routes ......................................................................... 14<br />
Current Vehicular Traffic Statistics.............................................................................. 16<br />
<strong>Greenleaf</strong> <strong>Terrace</strong> in Existing <strong>Transportation</strong> <strong>Plan</strong>s..................................................... 23<br />
Existing Conditions: Conclusions................................................................................. 26<br />
<strong>Neighborhood</strong> Assets & Liabilities .............................................................. 27<br />
Vision, Goals and Objectives........................................................................ 28<br />
Vision Statement........................................................................................................... 28<br />
Goals and Objectives .................................................................................................... 28<br />
<strong>Transportation</strong> <strong>Plan</strong>....................................................................................... 30<br />
Goal 1............................................................................................................................ 30<br />
Goal 2............................................................................................................................ 38<br />
Goal 3............................................................................................................................ 42<br />
Goal 4............................................................................................................................ 47<br />
Implementation Matrix ................................................................................. 50<br />
Appendices.................................................................................................... 52
Introduction<br />
The following document is a plan proposal developed to fulfill <strong>the</strong> spring 2008 Studio II<br />
requirement <strong>for</strong> <strong>the</strong> Master of Urban and Regional <strong>Plan</strong>ning (MURP) degree in <strong>the</strong> L.<br />
Douglas Wilder School of Government and Public Affairs at Virginia Commonwealth<br />
University. The plan was developed with <strong>the</strong> assistance of <strong>the</strong> City of Charlottesville,<br />
Virginia <strong>for</strong> <strong>the</strong> <strong>Greenleaf</strong> <strong>Terrace</strong> neighborhood in Charlottesville.<br />
The Studio II panel <strong>for</strong> <strong>the</strong> plan was composed of <strong>the</strong> following persons:<br />
Panel Chair: Dr. Xueming “Jimmy” Chen, Associate Professor, Wilder School<br />
Studio II Instructor: Dr. Morton Gulak, Associate Professor, Wilder School<br />
<strong>Plan</strong> Client: Robert Winstead, President of <strong>Greenleaf</strong> <strong>Terrace</strong> <strong>Neighborhood</strong> Association<br />
City of Charlottesville Representative: Jeanie Alexander, Traffic Engineer<br />
In <strong>the</strong> fall of 2007, Nick Rogers, a neighborhood planner <strong>for</strong> <strong>the</strong> City of Charlottesville,<br />
contacted <strong>the</strong> students in <strong>the</strong> MURP program at VCU with an opportunity to pose a<br />
comprehensive solution to <strong>the</strong> transportation-related problems being experienced by <strong>the</strong><br />
<strong>Greenleaf</strong> <strong>Terrace</strong> neighborhood. <strong>Neighborhood</strong> residents were complaining of elevated<br />
levels of cut-through traffic accompanied by high vehicle speeds, and pedestrian safety<br />
was of major concern. The challenge of creating a transportation plan <strong>for</strong> <strong>the</strong><br />
neighborhood was accepted and <strong>the</strong> plan process was initiated.<br />
An initial meeting with residents was held and existing conditions data was collected<br />
including traffic volumes, existing pedestrian and bicycle amenities and existing traffic<br />
control devices. A brief survey was also conducted among a small group of<br />
neighborhood residents to determine transportation mode usage. Existing conditions data<br />
was <strong>the</strong>n analyzed and significant transportation issues within <strong>the</strong> neighborhood were<br />
identified.<br />
A vision <strong>for</strong> <strong>the</strong> future of <strong>Greenleaf</strong> <strong>Terrace</strong> was <strong>for</strong>med, along with a set of goals and<br />
objectives designed to reach <strong>the</strong> envisioned future state. The goals and objectives were<br />
circulated among neighborhood residents <strong>for</strong> feedback; this feedback was taken into<br />
account while developing <strong>the</strong> final set of goals and objectives and creating <strong>the</strong> body of<br />
<strong>the</strong> plan.
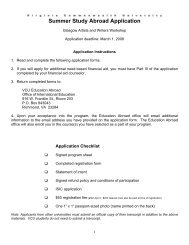
Map 1: <strong>Greenleaf</strong> <strong>Terrace</strong> Study Area<br />
250 BYPASS<br />
HOLIDAY DR<br />
250 BYPASS<br />
US HWY 250<br />
ST ANNES RD<br />
WARREN LN<br />
Meadowcreek Park<br />
MEADOWBROOK RD<br />
Legend<br />
Study Area<br />
HILLTOP RD<br />
DAIRY RD<br />
GENTRY LN<br />
US HWY 250<br />
GROVE RD<br />
BLUE RIDGE RD<br />
OAKLEAF LN<br />
DEL MAR DR<br />
McIntire Park<br />
GREENLEAF LN<br />
CAMBRIDGE CIR<br />
BRUCE AVE<br />
RUGBY RD<br />
250 BYPASS<br />
MASON LN<br />
HERNDON RD<br />
WELLFORD ST<br />
RUGBY AVE<br />
WESTWOOD RD<br />
OXFORD PL<br />
OXFORD RD<br />
RUTLEDGE AVE<br />
ROSE HILL DR<br />
<strong>Greenleaf</strong> Park<br />
PLYMOUTH RD<br />
SHERWOOD RD<br />
RAMP<br />
RAMP<br />
RAMP<br />
KENSINGTON AVE<br />
PRESTON AVE<br />
CABELL AVE<br />
HARDWOOD AVE<br />
MADISON AVE<br />
GREENWAY RD<br />
Feet<br />
0 180 360 720 1,080 1,440<br />
AUGUSTA ST<br />
AMHERST ST<br />
WESTWOOD CIR<br />
BIRDWOOD CT<br />
Source: City of Charlottesville GIS
Existing Conditions<br />
General <strong>Neighborhood</strong> Characteristics<br />
The <strong>Greenleaf</strong> <strong>Terrace</strong> neighborhood lies within <strong>the</strong> Charlottesville corporate limits and<br />
approximately one mile to <strong>the</strong> north and west of <strong>the</strong> downtown pedestrian mall. The<br />
neighborhood covers an area of approximately 204 acres and exhibits hilly terrain, with<br />
elevations ranging between 400 and 600 feet above sea level. The rolling topography is a<br />
potential barrier to cycling and walking.<br />
<strong>Greenleaf</strong> <strong>Terrace</strong> is<br />
bordered by <strong>the</strong> Route 250<br />
Bypass to <strong>the</strong> east and<br />
north, by Rugby Avenue to<br />
<strong>the</strong> south and by Barracks,<br />
Rugby and Dairy Roads to<br />
<strong>the</strong> west. Analysis of GIS<br />
data obtained from <strong>the</strong> City<br />
of Charlottesville 1 reveals<br />
that <strong>the</strong> study area contains<br />
438 residences, seven<br />
school-related structures<br />
and one church-owned<br />
structure. According to <strong>the</strong><br />
2006 Barracks/Rugby<br />
neighborhood plan, about<br />
1% of <strong>the</strong> housing in <strong>the</strong> neighborhood is two-family and one structure is designated as<br />
multi-family. The 135 acres of residential property in <strong>Greenleaf</strong> <strong>Terrace</strong> has a building<br />
density of 2.5 houses per acre. Much of <strong>the</strong> eastern portion of <strong>the</strong> neighborhood is<br />
occupied by <strong>the</strong> 13 acre <strong>Greenleaf</strong> Park that contains hiking trails, a playground and o<strong>the</strong>r<br />
recreation facilities. The abundance of mature trees in <strong>the</strong> neighborhood, coupled with<br />
<strong>the</strong> winding roads and hilly terrain give much of <strong>the</strong> neighborhood a park-like feeling.<br />
1 2008 City of Charlottesville <strong>Neighborhood</strong> Development Services
<strong>Neighborhood</strong> Demographic Data<br />
According to <strong>the</strong> US Census, <strong>the</strong> 2000 2 population <strong>for</strong> <strong>the</strong> study area was 1001<br />
individuals. The median age in <strong>Greenleaf</strong> <strong>Terrace</strong> was 38.1, as compared to 35.7 <strong>for</strong><br />
Virginia as a whole. Table 1 shows <strong>the</strong> percentages of individuals in selected age groups<br />
in 2000:<br />
Table 1: <strong>Greenleaf</strong> Age Distribution<br />
Age<br />
Under 5 years 71 7.1%<br />
5 to 17 years 143 14.3%<br />
18 to 24 years 38 3.8%<br />
25 to 39 years 300 30.0%<br />
40 to 64 years 326 32.6%<br />
65 to 84 years 109 10.9%<br />
85 years and over 14 1.4%<br />
1001 100.0%<br />
Source: 2000 Census Summary File 1<br />
As is evidenced by Table 1, about 14% of <strong>the</strong> neighborhood population was school age<br />
(5-17 years of age), a factor that raises significant traffic safety issues. 34% of <strong>the</strong><br />
population was in <strong>the</strong> typically more physically active age range of 18 to 39 years, while<br />
11% of <strong>the</strong> population was between 65 and 84 years of age and likely more dependant<br />
upon transportation alternatives to <strong>the</strong> automobile.<br />
To aid in <strong>the</strong> preparation of this plan, an in<strong>for</strong>mal survey was conducted of neighborhood<br />
residents. The following three questions were asked of <strong>the</strong> residents:<br />
1) Do you have access to an automobile?<br />
2) Do you cycle regularly?<br />
3) Do you walk regularly?<br />
4) Do you ride <strong>the</strong> bus regularly?<br />
Table 2 shows <strong>the</strong> results of <strong>the</strong> survey below:<br />
Table 2: <strong>Greenleaf</strong> Resident Survey Results<br />
Yes<br />
Question<br />
Response<br />
Access to<br />
Automobile 100%<br />
Regularly Cycle 34%<br />
Regularly Walk 91%<br />
Regularly Ride Bus 16%<br />
Source: 2008 <strong>Greenleaf</strong> <strong>Neighborhood</strong> Survey<br />
2 2000 US Census Bureau, Summary File 1
The table indicates that, while all respondents in <strong>the</strong> survey have access to an auto, and<br />
most walk with some frequency, bicycle ridership is significantly lower and bus ridership<br />
is lower yet. 2000 Census data <strong>for</strong> <strong>the</strong> neighborhood seems to confirm <strong>the</strong> high level of<br />
automobile access, indicating that less that 3% of neighborhood residents do not have<br />
such access.<br />
The following chart, based on 2000 Census 3 data, indicates how individuals make <strong>the</strong>ir<br />
way to work in <strong>the</strong> <strong>Greenleaf</strong> <strong>Terrace</strong> neighborhood:<br />
Chart 1: <strong>Transportation</strong> to Work<br />
100.0%<br />
90.0%<br />
86.8%<br />
80.0%<br />
70.0%<br />
60.0%<br />
50.0%<br />
40.0%<br />
30.0%<br />
20.0%<br />
10.0%<br />
0.0%<br />
Car, truck or<br />
van<br />
0.0%<br />
Public<br />
transportation<br />
3.7% 4.1% 5.4%<br />
Bicycle Walked Worked at<br />
home<br />
Source: 2000 Census, Summary File 3<br />
Although some individuals choose to bike or walk to work, <strong>the</strong> vast majority choose <strong>the</strong><br />
automobile as <strong>the</strong>ir preferred mode of transportation to work. It is also interesting to note<br />
that <strong>the</strong> use of public transportation seems completely absent. After speaking with<br />
citizens, <strong>the</strong> number is certainly greater than zero, although still ra<strong>the</strong>r small. It should be<br />
noted that <strong>the</strong> figures above were derived from US Census 2000 Summary File III data,<br />
and as such are not 100 percent data, resulting in more error especially in small<br />
geographic areas.<br />
A fur<strong>the</strong>r investigation of 2000 Census data reveals that nearly 83% of workers in <strong>the</strong><br />
neighborhood that do not work at home have a commute time of less than 20 minutes,<br />
indicating that <strong>the</strong> lack of alternative transportation modes is not due to a lengthy<br />
commute time.<br />
3 2000 US Census Bureau, Summary File 3
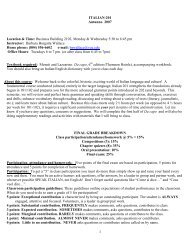
Map 2: Road Classification Hierarchy<br />
HOLIDAY DR<br />
250 BYPASS<br />
250 BYPASS<br />
Road Classification<br />
Principal Arterial<br />
Minor Arterial<br />
MEADOWBROOK RD<br />
Collector<br />
Local Street<br />
HILLTOP RD<br />
BRANDYWINE DR<br />
US HWY 250<br />
KEITH VALLEY RD<br />
DAIRY RD<br />
GENTRY LN<br />
ST ANNES RD<br />
US HWY 250<br />
WARREN LN<br />
GROVE RD<br />
YORKTOWN DR<br />
BLUE RIDGE RD<br />
RUGBY RD<br />
BRUCE AVE<br />
DEL MAR DR<br />
GREENLEAF LN<br />
ROSE HILL DR<br />
CAMBRIDGE CIR<br />
MASON LN<br />
KENSINGTON AVE<br />
HERNDON RD<br />
WELLFORD ST<br />
OXFORD PL<br />
OXFORD RD<br />
RUTLEDGE AVE<br />
RUGBY AVE<br />
PLYMOUTH RD<br />
SHERWOOD RD<br />
250 BYPASS<br />
RAMP<br />
RAMP<br />
RAMP<br />
PRESTON AVE<br />
WESTWOOD RD<br />
HARDWOOD AVE<br />
Feet<br />
0 190 380 760 1,140 1,520<br />
AUGUSTA ST<br />
AMHERST ST<br />
Source: City of Charlottesville GIS, 2007 Charlottesville Comprehensive <strong>Plan</strong>
Existing Road Infrastructure<br />
Map 2, adapted from <strong>the</strong> Charlottesville 2007 Comprehensive <strong>Plan</strong> 4 , clearly shows that<br />
<strong>the</strong> <strong>Greenleaf</strong> <strong>Terrace</strong> neighborhood is connected to surrounding areas by one principal<br />
arterial road (Route 250 Bypass), four minor arterials (Rugby Avenue east, Rose Hill<br />
Drive, Preston Avenue and<br />
Barracks Road) and three<br />
collector roads (Rugby<br />
Avenue west, Rugby Road<br />
and Dairy Road.)<br />
According to <strong>the</strong> 2007<br />
Charlottesville<br />
Comprehensive <strong>Plan</strong>,<br />
principal arterial roads carry<br />
<strong>the</strong> majority of traffic in an<br />
area, including most<br />
through traffic, and minor<br />
arterial roads supplement<br />
<strong>the</strong> principal arterial<br />
network while providing<br />
more access to collector and<br />
Rugby Avenue<br />
local roads. Collector streets<br />
ensure neighborhood access and mobility, while local streets provide access to individual<br />
properties and are not intended <strong>for</strong> through service.<br />
Principal Arterial<br />
Route 250 is a 4 lane divided highway with a speed limit of 35 miles per hour. Access to<br />
Route 250 from <strong>Greenleaf</strong> <strong>Terrace</strong> is provided at <strong>the</strong> sou<strong>the</strong>rn end of <strong>the</strong> neighborhood by<br />
ramps at <strong>the</strong> eastern end of Rugby Avenue, and at <strong>the</strong> nor<strong>the</strong>rn end of <strong>the</strong> neighborhood<br />
via Gentry lane and Meadowbrook Heights Road.<br />
Minor Arterial<br />
The four minor arterials (Rugby Avenue east, Rose Hill Drive, Preston Avenue and<br />
Barracks Road) that surround and connect <strong>Greenleaf</strong> terrace to surrounding<br />
neighborhoods are all two lane non-divided striped roads with posted speed limits of 25<br />
miles per hour. The portion of Rugby Avenue east of Rose Hill Drive is <strong>the</strong> only one of<br />
<strong>the</strong>se four sections of roadway that has sufficient width and allows <strong>for</strong> on-street parking.<br />
It is also noteworthy that <strong>the</strong> same section of road is striped do designate <strong>the</strong> separation<br />
between parking and travel lanes. All of <strong>the</strong> intersections involving <strong>the</strong>se minor arterial<br />
roads and connector roads are fully signalized.<br />
4 2007 City of Charlottesville Comprehensive <strong>Plan</strong>
Collectors<br />
The three collector roads (Rugby Avenue west, Rugby Road and Dairy Road.) that<br />
surround <strong>Greenleaf</strong> <strong>Terrace</strong> are, like <strong>the</strong>ir minor arterial counterparts, two lane nondivided<br />
striped roads with 25 mile per hour speed limits. As mentioned above, Rugby<br />
Avenue is <strong>the</strong> sole road in this category with on-street parking. The intersection between<br />
Rugby and Dairy Roads is a four-way stop.<br />
Local Streets<br />
The local streets within <strong>Greenleaf</strong> <strong>Terrace</strong> are predominantly two lane non-striped<br />
roadways. Notable exceptions include a section of Gentry Lane near Walker Elementary<br />
School, <strong>the</strong> intersection of Del Mar Drive and Oakleaf and <strong>Greenleaf</strong> Lanes, <strong>the</strong> full<br />
length of Rose Hill Drive. The streets vary in width from as narrow as approximately 10<br />
feet on sections of Ox<strong>for</strong>d Road to as wide as 45 feet on Rose Hill Drive. Posted speed<br />
limits are 25 miles per hour with <strong>the</strong> exception of a 15 mile per hour limit on Gentry Lane<br />
during school drop off and pick up times.
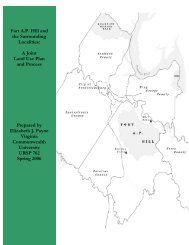
Map 3: Traffic Signals and Signs<br />
250 BYPASS<br />
HOLIDAY DR<br />
250 BYPASS<br />
US HWY 250<br />
ST ANNES RD<br />
MEADOWBROOK HEIGHTS RD<br />
WARREN LN<br />
MEADOWBROOK RD<br />
Traffic Signal/Sign Type<br />
Signal<br />
Stop<br />
HILLTOP RD<br />
DAIRY RD<br />
GENTRY LN<br />
US HWY 250<br />
GROVE RD<br />
CONCORD DR<br />
DEL MAR DR<br />
OAKLEAF LN<br />
BLUE RIDGE RD<br />
GREENLEAF LN<br />
CAMBRIDGE CIR<br />
BRUCE AVE<br />
RUGBY RD<br />
MASON LN<br />
KENSINGTON AVE<br />
HERNDON RD<br />
WELLFORD ST<br />
RUGBY AVE<br />
WESTWOOD RD<br />
OXFORD PL<br />
OXFORD RD<br />
RUTLEDGE AVE<br />
ROSE HILL DR<br />
PLYMOUTH RD<br />
SHERWOOD RD<br />
250 BYPASS<br />
RAMP<br />
RAMP<br />
RAMP<br />
PRESTON AVE<br />
CABELL AVE<br />
HARDWOOD AVE<br />
AUGUSTA ST<br />
Feet<br />
0 180 360 720 1,080 1,440<br />
AMHERST ST<br />
Source: City of Charlottesville GIS
Existing Signalization and Signage<br />
Map 3 shows <strong>the</strong> placement of traffic signals and stop signs throughout <strong>the</strong> <strong>Greenleaf</strong><br />
<strong>Terrace</strong> neighborhood. No intersections internal to <strong>the</strong> neighborhood are currently<br />
signalized, and all intersections<br />
contain at least one stop sign.<br />
Traffic signals exist at <strong>the</strong><br />
intersection of Rugby Avenue and<br />
Rose Hill Drive, Rugby Avenue<br />
and Rugby Road and Rugby Road<br />
and Barracks Road. The latter<br />
four-way intersection is <strong>the</strong> most<br />
complex due to <strong>the</strong> angle of <strong>the</strong><br />
Rugby Road/Barracks Road<br />
connection, <strong>the</strong> high volume of<br />
traffic handled and multiple<br />
turning lanes.<br />
Intersection of Rugby and Barracks Roads
Map 4: Bicycle &Pedestrian Accommodations<br />
250 BYPASS<br />
HOLIDAY DR<br />
250 BYPASS<br />
US HWY 250<br />
ST ANNES RD<br />
WARREN LN<br />
Accomodations<br />
MEADOWBROOK RD<br />
Bike Lane<br />
Crosswalk<br />
Sidewalk<br />
Hiking Trails<br />
HILLTOP RD<br />
DAIRY RD<br />
GENTRY LN<br />
US HWY 250<br />
GROVE RD<br />
BLUE RIDGE RD<br />
OAKLEAF LN<br />
DEL MAR DR<br />
GREENLEAF LN<br />
CAMBRIDGE CIR<br />
BRUCE AVE<br />
RUGBY RD<br />
OXFORD PL<br />
250 BYPASS<br />
MASON LN<br />
HERNDON RD<br />
WELLFORD ST<br />
RUGBY AVE<br />
WESTWOOD RD<br />
OXFORD RD<br />
RUTLEDGE AVE<br />
ROSE HILL DR<br />
PLYMOUTH RD<br />
SHERWOOD RD<br />
RAMP<br />
RAMP<br />
RAMP<br />
KENSINGTON AVE<br />
PRESTON AVE<br />
CABELL AVE<br />
HARDWOOD AVE<br />
MADISON AVE<br />
GREENWAY RD<br />
Feet<br />
0 180 360 720 1,080 1,440<br />
AUGUSTA ST<br />
AMHERST ST<br />
WESTWOOD CIR<br />
BIRDWOOD CT<br />
Source: City of Charlottesville GIS
Existing Bicycle & Pedestrian Infrastructure<br />
Bicycle Infrastructure<br />
Map 4 illustrates <strong>the</strong> location of bike lanes, sidewalks and crosswalks throughout<br />
<strong>Greenleaf</strong> <strong>Terrace</strong>. There are currently no roads with designated bike lanes ei<strong>the</strong>r in <strong>the</strong><br />
neighborhood or on any of <strong>the</strong> collector or minor arterial streets that <strong>for</strong>m its perimeter.<br />
The closest existing bike lane is on Rose Hill Drive and terminates at <strong>the</strong> intersection of<br />
Rose Hill Drive and Rugby Avenue.<br />
Pedestrian Infrastructure<br />
The vast majority of streets that do feature sidewalks have <strong>the</strong>m on one side only;<br />
exceptions to this rule include a small section of Rugby Road, portions of Rugby Avenue,<br />
parts of Rutledge Avenue and a short length of Gentry Lane. Little sidewalk connectivity<br />
exists within <strong>the</strong> neighborhood, with Rose Hill Drive, Rugby/Dairy Road and Gentry<br />
Lane having <strong>the</strong> only uninterrupted stretches of sidewalk.<br />
While most intersections that ring <strong>Greenleaf</strong> <strong>Terrace</strong> do have designated pedestrian<br />
crosswalks, <strong>the</strong> intersections of Rose Hill Drive and Ox<strong>for</strong>d Road and Gentry Lane just<br />
north of its intersection with Del Mar Drive are <strong>the</strong> only locations within <strong>the</strong><br />
neighborhood that feature crosswalks. Most of <strong>the</strong> crosswalks at major intersections have<br />
striping in conjunction with a brick or brick-like paving material to designate <strong>the</strong>ir<br />
location, while <strong>the</strong> remaining crosswalks are striped only.<br />
Both <strong>Greenleaf</strong> Park and McIntire Park (east of Rt. 250) have numerous walking paths<br />
<strong>for</strong> use by <strong>the</strong> public. However, <strong>the</strong> paths in <strong>Greenleaf</strong> Park do not have a direct link to<br />
neighborhood sidewalks, and no direct link between trails in <strong>the</strong> two parks.
Map 5: Public Transit Service<br />
HOLIDAY DR<br />
250 BYPASS<br />
250 BYPASS<br />
BRANDYWINE DR<br />
US HWY 250<br />
KEITH VALLEY RD<br />
ST ANNES RD<br />
WARREN LN<br />
YORKTOWN DR<br />
Route 3B<br />
GROVE RD<br />
GENTRY LN<br />
US HWY 250<br />
MEADOWBROOK RD<br />
Route<br />
Stop<br />
HILLTOP RD<br />
DAIRY RD<br />
RUGBY RD<br />
DEL MAR DR<br />
ROSE HILL DR<br />
BLUE RIDGE RD<br />
GREENLEAF LN<br />
CAMBRIDGE CIR<br />
BRUCE AVE<br />
MASON LN<br />
KENSINGTON AVE<br />
HERNDON RD<br />
WELLFORD ST<br />
OXFORD PL<br />
OXFORD RD<br />
RUTLEDGE AVE<br />
RUGBY AVE<br />
PLYMOUTH RD<br />
SHERWOOD RD<br />
250 BYPASS<br />
RAMP<br />
RAMP<br />
RAMP<br />
PRESTON AVE<br />
WESTWOOD RD<br />
HARDWOOD AVE<br />
Feet<br />
0 190 380 760 1,140 1,520<br />
AUGUSTA ST<br />
AMHERST ST<br />
Source: City of Charlottesville GIS
Existing Public <strong>Transportation</strong> Routes<br />
Map 5 shows <strong>the</strong> current Charlottesville Transit Service (CTS) route that serves <strong>the</strong><br />
<strong>Greenleaf</strong> <strong>Terrace</strong> neighborhood. CTS operates both <strong>the</strong> city bus service and <strong>the</strong> school<br />
bus service in Charlottesville. Route 3B of <strong>the</strong> city bus service enters <strong>the</strong> neighborhood<br />
traveling north via Rose Hill Drive to Del Mar Drive, <strong>the</strong>n turning on <strong>Greenleaf</strong> Lane and<br />
proceeding south on Well<strong>for</strong>d Street. The route <strong>the</strong>n heads east on Rugby Avenue and<br />
completes its circuit through <strong>the</strong> neighborhood, continuing south on Rose Hill Drive to<br />
downtown. Official transit stops in <strong>the</strong> neighborhood are also shown on <strong>the</strong><br />
transportation map. Stops<br />
are marked by<br />
corresponding signs.<br />
Route 3B is a “paired”<br />
route 5 with route 3A that<br />
serves a portion of<br />
Charlottesville south of <strong>the</strong><br />
downtown area. This<br />
pairing means that <strong>the</strong><br />
routes share busses and<br />
essentially operate as one<br />
route. Busses currently<br />
make <strong>the</strong> complete paired<br />
route circuit once every<br />
hour. The route is served Source: City of Charlottesville<br />
by one of <strong>the</strong> City’s 30<br />
foot busses. According to a 2004 Charlottesville transit study 6 , route 3 as a whole has<br />
about 200 boardings per day, making up approximately 6% of <strong>the</strong> CTS total ridership.<br />
According To Bill Watterson, Charlottesville Transit Service Manager, Charlottesville<br />
City Council may approve <strong>the</strong> addition of a new “Route 9” <strong>for</strong> fiscal year 2009. The new<br />
route would replace <strong>the</strong> existing route 3B that now serves <strong>Greenleaf</strong> <strong>Terrace</strong> and, while<br />
frequency of service would remain at once an hour, service to <strong>the</strong> UVA campus would be<br />
resumed.<br />
5 February 4 th , 2008 phone conversation with Bill Waterson, Charlottesville Transit Service Manager<br />
6 2004 Charlottesville Transit Improvement Study – Final Report, City of Charlottesville
Map 6: Average Daily Traffic Volume Counts<br />
RAMP<br />
US HWY 250<br />
RAMP<br />
HOLIDAY DR<br />
MEADOWBROOK RD<br />
Traffic Counts<br />
250 BYPASS<br />
BRANDYWINE DR<br />
250 BYPASS<br />
US HWY 250<br />
KEITH VALLEY RD<br />
KEITH VALLEY RD<br />
2300<br />
ST ANNES RD<br />
US HWY 250<br />
WARREN LN<br />
GROVE RD<br />
YORKTOWN DR<br />
CONCORD DR<br />
BLUE RIDGE RD<br />
Count Locations<br />
DAIRY RD<br />
GENTRY LN<br />
1000<br />
DEL MAR DR<br />
620<br />
18000<br />
HILLTOP RD<br />
BLUE RIDGE RD<br />
21000<br />
22000<br />
2000<br />
420<br />
MASON LN<br />
100<br />
RUGBY RD<br />
PARKER PL<br />
HERNDON RD<br />
CAMBRIDGE CIR<br />
340<br />
WELLFORD ST<br />
BRUCE AVE<br />
390<br />
2400<br />
140<br />
OXFORD PL<br />
RUGBY AVE<br />
600<br />
330<br />
1100<br />
OXFORD RD<br />
GREENLEAF LN<br />
ROSE HILL DR<br />
1700<br />
RUTLEDGE AVE<br />
7900<br />
PLYMOUTH RD<br />
SHERWOOD RD<br />
47000<br />
RAMP<br />
RAMP<br />
RAMP<br />
KENSINGTON AVE<br />
PRESTON AVE<br />
WESTWOOD RD<br />
6600<br />
CABELL AVE<br />
BARBOUR DR<br />
MADISON AVE<br />
HARDWOOD AVE<br />
Feet<br />
0 190 380 760 1,140 1,520<br />
GREENWAY RD<br />
AUGUSTA ST<br />
AMHERST ST<br />
WESTWOOD CIR<br />
BIRDWOOD CT<br />
Source: City of Charlottesville GIS, VDOT & City of Charlottesville Traffic Counts
Current Vehicular Traffic Statistics<br />
Traffic Volume Counts<br />
The traffic count data shown on Map 6 is taken out of necessity from a number of<br />
different sources, including <strong>the</strong> official 2006 VDOT traffic count publication 7 (green<br />
figures), and individual VDOT field observations between 2000 and 2006, a 2004<br />
Barracks/Rugby <strong>Neighborhood</strong> Traffic Calming study 8 and 2008 traffic counts by <strong>the</strong><br />
City of Charlottesville within <strong>Greenleaf</strong> <strong>Terrace</strong> itself (blue figures).<br />
An examination of <strong>the</strong> traffic count map confirms <strong>the</strong> roles of <strong>the</strong> roads surrounding<br />
<strong>Greenleaf</strong> <strong>Terrace</strong> shown on <strong>the</strong> Road Classification Map. The combined-direction<br />
figures obtained from <strong>the</strong> 2006 VDOT publication reveal that <strong>the</strong> heaviest weekday<br />
volume of 47,000 vehicles is carried by <strong>the</strong> Route 250 Bypass. Second heaviest in<br />
volume is <strong>the</strong> small section of Rugby Road from Preston Avenue north to Barracks Roadthis<br />
section carries 22,000 vehicles per weekday on average. The third heaviest volume<br />
is found on Barracks Road, a major connection to Route 29 (McIntire Road). O<strong>the</strong>r<br />
heavily traveled roads include Rugby Avenue from Rose Hill Drive east to <strong>the</strong> Route 250<br />
Bypass ramps (about 7900 vehicles per day) and Rose Hill Drive south to Preston<br />
Avenue (6600 vehicles per day).<br />
All of <strong>the</strong> above roads are classified as ei<strong>the</strong>r principal or minor arterial with <strong>the</strong><br />
exception of <strong>the</strong> previously mentioned section of Rugby road, which is classified as a<br />
collector. The remaining roads that <strong>for</strong>m <strong>the</strong> perimeter of <strong>Greenleaf</strong> <strong>Terrace</strong> are all<br />
designated as collector streets and all have weekday average volumes of between 2000<br />
and 3000 vehicles per day.<br />
Average weekday volumes within <strong>the</strong> neighborhood vary greatly, from 100 vehicles per<br />
day to nearly 200 vehicles per day. Streets that provide <strong>the</strong> most direct routes through <strong>the</strong><br />
neighborhood seem to exhibit <strong>the</strong> highest volumes of traffic; <strong>the</strong>se include Rose Hill<br />
Drive, Gentry Lane, Ox<strong>for</strong>d and Well<strong>for</strong>d Streets, Oakleaf and <strong>Greenleaf</strong> Lanes and Del<br />
Mar Drive.<br />
Both <strong>the</strong> individual VDOT volume counts and <strong>the</strong> counts done by <strong>the</strong> City of<br />
Charlottesville include a directional component which enables a more detailed analysis of<br />
traffic movement around and through <strong>the</strong> neighborhood. Combining both <strong>the</strong> directional<br />
and temporal components of <strong>the</strong> traffic data reveals a general pattern of northward traffic<br />
flow in <strong>the</strong> morning (7:00-8:00 am) and a southward flow in mid afternoon (2:30-4:00<br />
pm) that may coincide with school pick up/drop off times.<br />
7 2006 Virginia Department of <strong>Transportation</strong> Daily Traffic Volume Estimates Including Vehicle<br />
Classification Estimates, Special Locality Report 104, City of Charlottesville<br />
8 2004-2007 City of Charlottesville CIP Projects Summary Sheet, Barracks/Rugby <strong>Neighborhood</strong> Traffic<br />
Calming
A close examination of directional counts shows significant differences in directional<br />
flow <strong>for</strong> several locations in <strong>the</strong> neighborhood, especially on and near Well<strong>for</strong>d Street. It<br />
would appear, from comparing <strong>the</strong> two measurement locations on Well<strong>for</strong>d Street that<br />
most of <strong>the</strong> vehicular traffic entering <strong>the</strong> neighborhood from Rugby Avenue onto<br />
Well<strong>for</strong>d Road traveling north utilizes <strong>the</strong> entire length of Well<strong>for</strong>d, while traffic<br />
traveling south may enter Well<strong>for</strong>d below Bruce Avenue, perhaps at Ox<strong>for</strong>d Road. This<br />
situation may be <strong>the</strong> result of traffic turning off of Rugby Road at Ox<strong>for</strong>d Road and<br />
proceeding east until turning south on Well<strong>for</strong>d Road in an attempt to avoid <strong>the</strong> traffic<br />
signals at Barracks and Rugby Roads and Rugby Road at Rugby Avenue.<br />
Gentry Lane carries almost double <strong>the</strong> flow northward in <strong>the</strong> morning that is does in <strong>the</strong><br />
afternoon, perhaps indicating heavier use of Well<strong>for</strong>d Street and Rose Hill Drive <strong>for</strong><br />
afternoon traffic exiting <strong>the</strong> <strong>Greenleaf</strong> <strong>Terrace</strong>, although southbound volumes on both of<br />
<strong>the</strong>se streets does not show consistently heavier southbound flow.<br />
Ox<strong>for</strong>d Road between Well<strong>for</strong>d Street and Rugby Road exhibits a little less than double<br />
<strong>the</strong> traffic flow from east to west that in <strong>the</strong> opposite direction at <strong>the</strong> measurement<br />
location closest to Well<strong>for</strong>d Street. At <strong>the</strong> measurement location closest to Rugby<br />
Avenue, however, <strong>the</strong> directional difference is negligible.<br />
According to <strong>the</strong> 2000 City of Charlottesville Traffic Calming Device Implementation<br />
Guidebook, streets internal to <strong>Greenleaf</strong> <strong>Terrace</strong> do not qualify <strong>for</strong> traffic calming<br />
devices based on two-way traffic volumes during peak hours. The highest combined<br />
peak-hour volume within <strong>the</strong> neighborhood was 184 vehicles on Rose Hill Drive, while<br />
<strong>the</strong> chart <strong>for</strong> determining “severity of through traffic problems 9 ” does not include overall<br />
peak volumes less than 250 vehicles per hour.<br />
9 2000 City of Charlottesville Traffic Calming Device Implementation Guidebook
Map 7: Observed 85th PercentileTraffic Speeds<br />
RAMP<br />
US HWY 250<br />
RAMP<br />
HOLIDAY DR<br />
MEADOWBROOK RD<br />
Traffic Speeds<br />
250 BYPASS<br />
BRANDYWINE DR<br />
250 BYPASS<br />
US HWY 250<br />
KEITH VALLEY RD<br />
KEITH VALLEY RD<br />
30.60<br />
GENTRY LN<br />
ST ANNES RD<br />
US HWY 250<br />
WARREN LN<br />
GROVE RD<br />
YORKTOWN DR<br />
CONCORD DR<br />
Measurements<br />
BLUE RIDGE RD<br />
DAIRY RD<br />
29.30<br />
OAKLEAF LN<br />
32<br />
HILLTOP RD<br />
BLUE RIDGE RD<br />
RUGBY RD<br />
CAMBRIDGE CIR<br />
BRUCE AVE<br />
30.70<br />
DEL MAR DR<br />
28<br />
30.70<br />
33.89<br />
GREENLEAF LN<br />
BARRACKS RD<br />
31.60<br />
OXFORD PL<br />
MASON LN<br />
KENSINGTON AVE<br />
PARKER PL<br />
HERNDON RD<br />
WELLFORD ST<br />
34.70<br />
RUGBY AVE<br />
34.60<br />
WESTWOOD RD<br />
OXFORD RD<br />
RUTLEDGE AVE<br />
ROSE HILL DR<br />
29.45<br />
PLYMOUTH RD<br />
SHERWOOD RD<br />
RAMP<br />
RAMP<br />
RAMP<br />
PRESTON AVE<br />
CABELL AVE<br />
BARBOUR DR<br />
MADISON AVE<br />
HARDWOOD AVE<br />
Feet<br />
0 190 380 760 1,140 1,520<br />
GREENWAY RD<br />
AUGUSTA ST<br />
AMHERST ST<br />
WESTWOOD CIR<br />
BIRDWOOD CT<br />
Source: City of Charlottesville GIS, VDOT & City of Charlottesville Traffic Counts
Traffic Speeds<br />
All roads within <strong>the</strong> <strong>Greenleaf</strong> <strong>Terrace</strong> neighborhood currently have a posted speed of 25<br />
miles per hour. A notable exception is <strong>the</strong> privately-owned portion of Gentry Lane near<br />
Walker Elementary School which has a 15 mile per hour limit during School pick-up and<br />
drop-off times.<br />
All traffic volume data collected by <strong>the</strong> City of Charlottesville included <strong>the</strong> 85 th<br />
percentile speed and percentage of vehicles exceeding 55 miles per hour <strong>for</strong> each traffic<br />
flow direction. Two of <strong>the</strong> locations <strong>for</strong> which raw data was available from VDOT<br />
included raw speed in<strong>for</strong>mation which was <strong>the</strong>n used to calculate an overall 85 th<br />
percentile speed.<br />
Map 7 displays <strong>the</strong> higher of <strong>the</strong> two directional 85 th percentile speeds <strong>for</strong> each location<br />
sampled. 85 th percentile speeds exceeded posted speed limits at all observation points.<br />
Based on <strong>the</strong> Charlottesville Traffic Calming Device Implementation Guidebook, local<br />
streets that have posted speed limits of 25 MPH and 85 th percentile speeds that are<br />
between 25 and 35 MPH have a moderate speeding problem. Streets with 85 th percentile<br />
speeds above 35 MPH are considered to have a serious speeding issue. Map 7 clearly<br />
shows <strong>the</strong> presence of a moderate speeding problem throughout <strong>the</strong> neighborhood, and<br />
eight observed speeds that are above 30 miles per hour, including three that are just<br />
below <strong>the</strong> 35 mile per hour “serious” threshold.
Map 8: Reported Accidents 2006-2007<br />
250 BYPASS<br />
US HWY 250<br />
GROVE RD<br />
GENTRY LN<br />
MEADOWBROOK RD<br />
US HWY 250<br />
Accidents<br />
Accident Locations<br />
HILLTOP RD<br />
DAIRY RD<br />
OAKLEAF LN<br />
BLUE RIDGE RD<br />
DEL MAR DR<br />
GREENLEAF LN<br />
CAMBRIDGE CIR<br />
BRUCE AVE<br />
RUGBY RD<br />
250 BYPASS<br />
OXFORD PL<br />
MASON LN<br />
KENSINGTON AVE<br />
PARKER PL<br />
HERNDON RD<br />
WELLFORD ST<br />
RUGBY AVE<br />
WESTWOOD RD<br />
OXFORD RD<br />
RUTLEDGE AVE<br />
ROSE HILL DR<br />
PLYMOUTH RD<br />
RAMP<br />
SHERWOOD RD<br />
PRESTON AVE<br />
CABELL AVE<br />
HARDWOOD AVE<br />
AUGUSTA ST<br />
Feet<br />
0 170 340 680 1,020 1,360<br />
AMHERST ST<br />
Source: City of Charlottesville GIS, Charlottesville Police Department
Accident Statistics<br />
Traffic accident reports <strong>for</strong> <strong>the</strong> <strong>Greenleaf</strong> <strong>Terrace</strong> neighborhood were obtained from <strong>the</strong><br />
Virginia Department of Motor Vehicles through <strong>the</strong> City of Charlottesville and statistics<br />
were compiled from <strong>the</strong>se reports. In 2006 and 2007, <strong>the</strong>re were 26 reported traffic<br />
accidents in <strong>Greenleaf</strong> <strong>Terrace</strong> or on one of <strong>the</strong> roads that <strong>for</strong>m its perimeter. Map 8<br />
shows <strong>the</strong> locations of <strong>the</strong>se accidents- it should be noted that several intersections have<br />
multiple accidents that may overlap to appear as one incident.<br />
In an attempt to simplify analysis, accidents were placed in one of <strong>the</strong> six following<br />
categories:<br />
Parked- at least one of <strong>the</strong> vehicles involved was parked at <strong>the</strong> time of <strong>the</strong> collision<br />
Lost Control- Single-vehicle accident involving loss of driver control<br />
Angle- two-vehicle accidents in which collision occurs at an angle- most common at<br />
intersections<br />
Rear- two-vehicle accident in which one vehicle rear-ends ano<strong>the</strong>r<br />
Combo- multi-vehicle accident involving multiple collision types<br />
Hit Animal- accident in which animal is struck.<br />
The following table shows <strong>the</strong> percentage of each type of accident recorded in <strong>the</strong><br />
neighborhood:<br />
Table 3: Accident Types<br />
Accident<br />
Type Frequency Percent<br />
Parked 5 19.2%<br />
Lost Control 5 19.2%<br />
Angle 11 42.3%<br />
Rear 3 11.5%<br />
Combo 1 3.8%<br />
Hit Animal 1 3.8%<br />
Total 26 100.0%<br />
Source: City of Charlottesville<br />
By far, <strong>the</strong> most common accidents in <strong>Greenleaf</strong> <strong>Terrace</strong> were “angle” type collisions.<br />
The majority of <strong>the</strong>se types of accidents occurred at <strong>the</strong> high-volume intersections of<br />
Rose Hill Drive and Rugby Avenue, Rugby Road and Rugby Avenue, Preston Avenue<br />
and Rugby Avenue and Barracks Road at Rugby Road. All accidents of this type<br />
occurred at an intersection.
About 19% of <strong>the</strong> reported accidents involved parked vehicles; <strong>the</strong>se accidents typically<br />
occurred away from intersections and <strong>the</strong> majority on local ra<strong>the</strong>r than collector or<br />
arterial roads. A fur<strong>the</strong>r 19% of accidents were single-vehicle accidents involving driver<br />
loss of control. The 12% of accidents that were classified as “rear-end” were evenly<br />
distributed through type of road and volume level. The remaining accidents were single<br />
occurrences, both of which happened on Rugby Avenue.<br />
Looking at <strong>the</strong> general distribution of accidents throughout <strong>the</strong> neighborhood, some<br />
patterns become evident. There appear to be three “clusters” of accidents; one in <strong>the</strong><br />
lower sou<strong>the</strong>ast corner of <strong>the</strong> neighborhood, one in <strong>the</strong> lower southwest corner and one in<br />
<strong>the</strong> upper north portion of <strong>the</strong> neighborhood. All seem to coincide with higher traffic<br />
volume levels. The cluster in <strong>the</strong> sou<strong>the</strong>ast corner is in close proximity to <strong>the</strong> ramps <strong>for</strong><br />
<strong>the</strong> Route 250 Bypass and <strong>the</strong> Rose Hill Drive/Rugby Avenue intersection. The cluster in<br />
<strong>the</strong> southwest corner includes many of <strong>the</strong> busiest intersections in <strong>the</strong> neighborhood.<br />
Likewise, <strong>the</strong> cluster of accidents in <strong>the</strong> nor<strong>the</strong>rn middle of <strong>the</strong> neighborhood<br />
encompasses <strong>the</strong> Rose Hill Drive and Oakleaf Lane/<strong>Greenleaf</strong> Lane/Del Mar Drive<br />
intersections, all of which have <strong>the</strong> highest daily traffic volumes internal to <strong>the</strong><br />
neighborhood.
<strong>Greenleaf</strong> <strong>Terrace</strong> in Existing <strong>Transportation</strong> <strong>Plan</strong>s<br />
While <strong>Greenleaf</strong> <strong>Terrace</strong> is not mentioned specifically in <strong>the</strong> 2003 Charlottesville Bicycle<br />
& Pedestrian Facilities Master <strong>Plan</strong>, <strong>the</strong> larger Barracks/Rugby neighborhood of which it<br />
is a part is indeed included. Moreover, <strong>the</strong> issues identified and recommendations made<br />
in regard to <strong>the</strong> Barracks/Rugby neighborhood at large will undoubtedly affect <strong>Greenleaf</strong><br />
<strong>Terrace</strong>.<br />
According to <strong>the</strong> 2003 Charlottesville Bicycle & Pedestrian Facilities Master <strong>Plan</strong> 10 , onstreet<br />
bicycle facilities in <strong>the</strong> <strong>for</strong>m of bike lanes are recommended <strong>for</strong> Rugby Road,<br />
Rugby Avenue and Dairy Road. The plan suggests <strong>the</strong> widening and realignment of<br />
Rugby Road to accommodate bike lanes, while it observes that Rugby Avenue already<br />
possesses adequate width <strong>for</strong> <strong>the</strong> addition of bike lanes. The plan also recommends<br />
adding “Share <strong>the</strong> Road” signage <strong>for</strong> increased driver awareness of cyclists on Rose Hill<br />
Drive from Rugby Avenue north to <strong>the</strong> entrance to <strong>Greenleaf</strong> Park, as well as <strong>the</strong> addition<br />
of a pedestrian/cyclist underpass under <strong>the</strong> Route 250 Bypass linking <strong>Greenleaf</strong> and<br />
McIntire Parks. The facilities on Rugby and Dairy Roads are considered high priority by<br />
<strong>the</strong> plan, while <strong>the</strong> improvements on Rugby Avenue are considered medium priority and<br />
those on Rose Hill Drive are low priority. The Route 250 underpass is considered a<br />
medium priority off-road improvement.<br />
One of <strong>the</strong> 2006 Barracks/Rugby <strong>Neighborhood</strong> plan 11 ’s guiding principles of<br />
connectivity stresses <strong>the</strong> importance of “safe public transportation, alternative modes of<br />
transportation and interconnected pedestrian and bicycle access” <strong>for</strong> <strong>the</strong> residents of <strong>the</strong><br />
neighborhood. An accompanying map shows <strong>the</strong> use of Rugby Road, Avenue and Dairy<br />
Road as bike routes, a designation that matches <strong>the</strong> proposed addition of bike lanes<br />
recommended by <strong>the</strong> 2003 Charlottesville Bicycle & Pedestrian Facilities Master <strong>Plan</strong>.<br />
Residents of <strong>the</strong> Barracks/Rugby neighborhood list a number of transportation-related<br />
priorities pertinent to <strong>the</strong> <strong>Greenleaf</strong> <strong>Terrace</strong> neighborhood, including <strong>the</strong> following:<br />
• “Decrease traffic and increase safety on Rugby Road by improving <strong>the</strong> bike lanes,<br />
ensuring pedestrian safety and en<strong>for</strong>cing speed limits.<br />
• In regards to traffic calming, <strong>the</strong> residents desire a comprehensive professional<br />
study to look at safe alternatives.<br />
• The neighborhood wants a balance of different modes of transportation (multimodal).<br />
• Create sidewalks only on streets that neighbors want <strong>the</strong>m.<br />
10 2003 City of Charlottesville Bicycle & Pedestrian Facilities Master <strong>Plan</strong><br />
11 2006 City of Charlottesville Barracks/Rugby <strong>Neighborhood</strong> <strong>Plan</strong>
• If <strong>the</strong> city is not pursuing sidewalk construction, a paint stripe along <strong>the</strong> roadside<br />
to narrow <strong>the</strong> vehicular roadway and provide a designated area to walk would be a<br />
cheaper alternative.<br />
• Speeding is an issue that compromises pedestrian safety. Correlate speed limit<br />
with <strong>the</strong> presence of sidewalks to increase walkability and bikeability.<br />
• Rose Hill Drive needs new crosswalk<br />
• Indicate crosswalks with paint or surface texture. In general <strong>the</strong>re is a need <strong>for</strong><br />
better maintenance of crosswalks. Use reflective paint to make lines more visible.<br />
• Re-evaluate speed limits. O<strong>the</strong>r potential traffic calming measures include speed<br />
humps and one-way streets.<br />
• Create pedestrian and bicycle connections to McIntire Park in general and from<br />
<strong>Greenleaf</strong> Park following <strong>the</strong> stream corridor.<br />
• Connect <strong>Greenleaf</strong> Park to McIntire Park through a possible pedestrian bridge<br />
over 250.<br />
• Downsize Dairy Road and install a better traffic calming design.<br />
• Improve <strong>the</strong> bus system by coordinating <strong>the</strong> University buses and CTS, placing a<br />
bench at each bus stop, combining <strong>the</strong> School bus and CTS stops and using<br />
smaller buses that make more frequent trips and run longer hours.” 12<br />
The 2007 Comprehensive plan identifies a number of general issues city-wide that apply<br />
to <strong>Greenleaf</strong> <strong>Terrace</strong>, including:<br />
• “The capacity of <strong>the</strong> arterial roadway network is stressed by high usage, resulting<br />
in congestion and increased traffic on local streets.<br />
• Vehicles are traveling at high speeds on local streets and cutting through<br />
neighborhoods ra<strong>the</strong>r than using <strong>the</strong> arterial and collector roadway network in<br />
place <strong>for</strong> this type of travel.<br />
• The majority of <strong>the</strong> roadway network within <strong>the</strong> City was designed to<br />
accommodate vehicular travel and does not adequately address safety and user<br />
com<strong>for</strong>t <strong>for</strong> pedestrians, bicyclists or citizens with disabilities.<br />
• Many residents live within a reasonable walking or biking distance to retail and<br />
commercial destinations within <strong>the</strong> City. However, residents choose to drive<br />
12 2006 City of Charlottesville Barracks/Rugby <strong>Neighborhood</strong> <strong>Plan</strong>
a<strong>the</strong>r than bike or walk due to a lack of trails, paths, sidewalks and bike lanes<br />
connecting <strong>the</strong> residential and commercial areas” 13 .<br />
In order to deal with <strong>the</strong> a<strong>for</strong>ementioned issues, <strong>the</strong> Comprehensive <strong>Plan</strong> identifies <strong>the</strong><br />
following local goals:<br />
• “Efficiently manage <strong>the</strong> capacity of <strong>the</strong> arterial roadway network, relieving<br />
congestion and increased traffic on local streets.<br />
• Reduce <strong>the</strong> high vehicle speeds and limit cut-through traffic on local streets as<br />
this type of travel is intended <strong>for</strong> arterial and collector roadway networks.<br />
• Increase safer accommodations <strong>for</strong> pedestrians, bicyclists and citizens with<br />
disabilities while within existing roadway network.<br />
• Establish connectivity between residences and commercial destinations that are<br />
located in close proximity to one ano<strong>the</strong>r to promote <strong>the</strong> option of walking and<br />
biking ra<strong>the</strong>r than driving” 14 .<br />
The 2006 Charlottesville Transit Development <strong>Plan</strong> 15 recommends changes to<br />
Charlottesville Transit Service bus route 3B, <strong>the</strong> route that serves <strong>Greenleaf</strong> <strong>Terrace</strong>. The<br />
proposed changes include bringing <strong>the</strong> western reach of <strong>the</strong> route in from <strong>the</strong> portion of<br />
Rugby Road near <strong>the</strong> University of Virginia campus to 10 th street, approximately 9 city<br />
blocks fur<strong>the</strong>r east. The change is recommended in part to eliminate duplication in<br />
service between CTS and <strong>the</strong> UVA bus service. This change effectively eliminates Route<br />
3 service to <strong>the</strong> UVA campus, requiring a route transfer. The recommended alteration to<br />
<strong>the</strong> route was implemented in 2007.<br />
13 2007 City of Charlottesville Comprehensive <strong>Plan</strong><br />
14 2007 City of Charlottesville Comprehensive <strong>Plan</strong><br />
15 2006 City of Charlottesville Transit Development <strong>Plan</strong>
Existing Conditions: Conclusions<br />
The data above presents a picture of a neighborhood that, while not suffering from acute<br />
traffic issues, is certainly in need of basic traffic-calming measures, as well as a<br />
coordinated, cohesive ef<strong>for</strong>t to improve access to and connections between pedestrian,<br />
biking and public transportation modes.<br />
The neighborhood survey provides a useful albeit somewhat limited view of<br />
transportation mode use in <strong>Greenleaf</strong> <strong>Terrace</strong>. The high level of vehicle access certainly<br />
discourages some use of o<strong>the</strong>r transportation modes, although <strong>the</strong> census data would<br />
suggest that <strong>the</strong> vast majority of biking and walking that takes place in <strong>the</strong> neighborhood<br />
is recreational in nature. Several of <strong>the</strong> residents fur<strong>the</strong>r explained that <strong>the</strong>y felt unsafe<br />
biking in <strong>the</strong> neighborhood, a perception that may be largely responsible <strong>for</strong> <strong>the</strong> low<br />
percentage of bikers. Likewise, a number of residents fur<strong>the</strong>r explained <strong>the</strong>ir lack of<br />
public transportation patronage, citing infrequent service and a lack of service to <strong>the</strong><br />
locations <strong>the</strong>y need to travel as major factors.<br />
Although an origin-destination study was not feasible given <strong>the</strong> time constraints of <strong>the</strong><br />
study, traffic volume measurements throughout <strong>Greenleaf</strong> <strong>Terrace</strong> suggest that cutthrough<br />
traffic from surrounding collector and arterial roads is occurring. The volumes<br />
on Well<strong>for</strong>d and Ox<strong>for</strong>d Roads indicate, as mentioned previously, that Well<strong>for</strong>d and<br />
Ox<strong>for</strong>d Roads may be serving as a route to avoid <strong>the</strong> busy intersections of Barracks and<br />
Rugby Roads and Rugby Road at Rugby Avenue. It would also appear (pending receipt<br />
of fur<strong>the</strong>r traffic counts on Rose Hill Drive and Gentry Lane) that Rose Hill Drive is<br />
heavily used in conjunction with <strong>Greenleaf</strong> and Oakleaf Lanes, Del Mar Drive and<br />
Gentry Lane to provide access through <strong>the</strong> neighborhood, most likely <strong>for</strong> vehicles going<br />
to and from Walker Elementary School.<br />
The speed data acquired in <strong>Greenleaf</strong> <strong>Terrace</strong> supports <strong>the</strong> implementation of traffic<br />
calming measures to reduce vehicle speeds to a level more appropriate <strong>for</strong> a residential<br />
neighborhood in which vehicles may easily come into conflict with pedestrian and<br />
bicycle traffic. The speeds observed also support <strong>the</strong> need <strong>for</strong> improved pedestrian and<br />
bicycle accommodations to ensure walking and biking safety.<br />
A review of accident data does not reveal any major issues. Accidents are most<br />
predominant at intersections in areas of high traffic volumes, as one would expect.<br />
However, <strong>the</strong> cluster of accidents along <strong>the</strong> Rose Hill Drive corridor are troublesome and<br />
may indicate high traffic volume in an area directly adjacent to <strong>Greenleaf</strong> Park and thus<br />
to an area of increased pedestrian traffic.
<strong>Neighborhood</strong> Assets & Liabilities<br />
Assets:<br />
• Park-like suburban atmosphere<br />
• Recreational amenities af<strong>for</strong>ded by <strong>Greenleaf</strong> Park<br />
• Close proximity to downtown pedestrian mall<br />
• Convenience of Walker Elementary<br />
• Ease of access to Route 250 Bypass, Route 29<br />
• Public transit service<br />
• Crow Recreation Center<br />
Liabilities:<br />
• Traffic generated by Walker Elementary<br />
• Traffic speeding through neighborhood<br />
• Lack of complete pedestrian amenities<br />
• Lack of bicycle amenities<br />
• Inconvenience of current CTS route<br />
• Lack of neighborhood identity to outsiders
Vision, Goals and Objectives<br />
Vision Statement<br />
<strong>Greenleaf</strong> <strong>Terrace</strong> is a safe, vibrant residential neighborhood with a variety of<br />
transportation modes available to its residents. Traffic calming measures ensure that<br />
vehicular traffic traveling through <strong>the</strong> neighborhood maintains a safe speed and excessive<br />
through-traffic is discouraged from utilizing local streets within <strong>the</strong> neighborhood.<br />
Bicycle and pedestrian-oriented improvements allow safe movement of cyclists and<br />
walkers throughout <strong>the</strong> neighborhood. Public transit stops are clearly marked and<br />
provide a friendly atmosphere <strong>for</strong> waiting riders. Bicycle, pedestrian and public<br />
transportation are linked to allow <strong>for</strong> easy multi-modal travel.<br />
Goals and Objectives<br />
Goal 1: Pedestrian safety is ensured throughout <strong>Greenleaf</strong> <strong>Terrace</strong>.<br />
• Objective 1.1: Create a more complete neighborhood sidewalk network<br />
• Objective 1.2: Install crosswalks at locations of high vehicle/pedestrian<br />
interaction<br />
• Objective 1.3: Install curb bulb-outs in conjunction with crosswalks<br />
• Objective 1.4: Add pedestrian signals at Rugby Ave/Rose Hill Drive intersection<br />
• Objective 1.5: Create park gateway to increase entrance visibility and enhance<br />
pedestrian safety<br />
Goal 2: <strong>Greenleaf</strong> <strong>Terrace</strong> provides a safe and friendly atmosphere <strong>for</strong><br />
cycling<br />
• Objective 2.1: Incorporate previous plan recommendations of bike lanes on<br />
Rugby Avenue<br />
• Objective 2.2: Extend bike lanes on Rose Hill Drive north to Crow Recreation<br />
Center<br />
• Objective 2.3: Install bike route signs on Ox<strong>for</strong>d Road, Del Mar Drive and Gentry<br />
Lane (from Del Mar to Rugby Road)<br />
• Objective 2.4: Provide bicycle racks within <strong>Greenleaf</strong> Park
Goal 3: Vehicles in <strong>Greenleaf</strong> <strong>Terrace</strong> travel at posted speed limits and cutthrough<br />
traffic is discouraged.<br />
• Objective 3.1: Install speed humps at strategic locations to help slow vehicular<br />
traffic<br />
• Objective 3.2: Install traffic circles at <strong>the</strong> intersections of Del Mar Drive &<br />
<strong>Greenleaf</strong> Lane, Del Mar Drive and Oakleaf Lane, Ox<strong>for</strong>d Road & Rose Hill<br />
Drive and Dairy Road/Gentry Lane/Rugby Road to help slow and better manage<br />
vehicular traffic<br />
• Objective 3.3: Create neighborhood gateways at Rose Hill Drive & Rugby<br />
Avenue, Ox<strong>for</strong>d Road & Rugby Road and Gentry Lane & Rugby Road<br />
Goal 4: Public transit is a convenient and efficient transportation alternative<br />
<strong>for</strong> neighborhood residents and is linked to pedestrian and bicycle routes.<br />
• Objective 4.1: Modify current route 3B to include service to UVA campus<br />
• Objective 4.2: Increase frequency of bus route navigation from every one to<br />
every one-half hour during peak travel times<br />
• Objective 4.3: Ensure that CTS stops are linked to major pedestrian routes and<br />
that stops provide a welcoming environment <strong>for</strong> waiting riders
<strong>Transportation</strong> <strong>Plan</strong><br />
Goal 1: Pedestrian safety is ensured throughout <strong>Greenleaf</strong> <strong>Terrace</strong>.<br />
Initial meetings and subsequent correspondence with residents of <strong>Greenleaf</strong> <strong>Terrace</strong><br />
confirm that pedestrian safety is of paramount importance to most in <strong>the</strong> neighborhood.<br />
The presence of Walker Elementary school within <strong>the</strong> neighborhood lends fur<strong>the</strong>r<br />
credence to concerns <strong>for</strong> <strong>the</strong> safe movement of pedestrians.<br />
Objective 1.1: Create a more complete neighborhood sidewalk network<br />
The creation of a complete and connected network of sidewalks throughout <strong>Greenleaf</strong><br />
<strong>Terrace</strong> is a key step toward improving pedestrian safety. The existing neighborhood<br />
system of sidewalks is sporadic. While <strong>the</strong> perimeter of <strong>the</strong> neighborhood is served by<br />
sidewalks on Rugby Road, Rugby Avenue and Rose Hill Drive, east-west pedestrian<br />
movement through <strong>the</strong> neighborhood requires potentially dangerous travel on roadways.<br />
North-south movement through <strong>the</strong> neighborhood is better facilitated by <strong>the</strong> sidewalk on<br />
Rose Hill drive; however, a link to Gentry Lane is needed to completely eliminate<br />
pedestrian road use when moving in this direction. The second main north-south route<br />
through <strong>the</strong> neighborhood, Well<strong>for</strong>d Road, also lacks a complete sidewalk.<br />
Map 9 shows <strong>the</strong> recommended sidewalk improvements that are needed to remedy <strong>the</strong><br />
current deficiency of pedestrian thoroughfares through <strong>Greenleaf</strong> <strong>Terrace</strong>. All streets in<br />
<strong>the</strong> neighborhood should have a sidewalk on at last one side of <strong>the</strong> roadway.<br />
A phased approach to <strong>the</strong> completion of sidewalk installation is recommended, giving<br />
priority to streets on which interactions between vehicular and pedestrian traffic are most<br />
likely; <strong>Greenleaf</strong> Lane is one such road. Not only is a sidewalk on <strong>Greenleaf</strong> Lane<br />
essential <strong>for</strong> <strong>the</strong> safe north-south flow of pedestrian traffic through <strong>the</strong> neighborhood; it<br />
also <strong>for</strong>ms a portion of a safe route to <strong>Greenleaf</strong> Park from <strong>the</strong> western half of <strong>the</strong><br />
neighborhood. The section of <strong>Greenleaf</strong> Lane from Rose Hill Drive to Del Mar Drive is<br />
of sufficient width to install a sidewalk on <strong>the</strong> north side of <strong>the</strong> road if parking is<br />
eliminated on one side of <strong>the</strong> street. If residents are unwilling to give up street parking,<br />
sufficient right-of-way exists to facilitate sidewalk installation. A small section of<br />
sidewalk already exists on <strong>the</strong> west side of <strong>the</strong> section of Del Mar Drive from Oakleaf<br />
Lane to Gentry Lane. This section should be extended south around <strong>the</strong> corner to <strong>the</strong><br />
intersection with Oakleaf Lane using existing right-of-way. A sidewalk should also be<br />
added to <strong>the</strong> north side of Oakleaf Lane to allow safe pedestrian access to <strong>the</strong> Crow<br />
Recreation Center at <strong>the</strong> top of Rose Hill Drive.<br />
Ox<strong>for</strong>d Road is ano<strong>the</strong>r high priority sidewalk corridor that is necessary to provide a safe<br />
and direct east-west pedestrian route through <strong>the</strong> lower half of <strong>Greenleaf</strong> <strong>Terrace</strong>. Ox<strong>for</strong>d<br />
Road varies in width from 30 feet near its intersection with Rose Hill Drive to about 17<br />
feet closer to Rugby Road. The majority of <strong>the</strong> road is around 20 feet in width, making<br />
<strong>the</strong> use of existing right-of-way adjacent to <strong>the</strong> road edge <strong>the</strong> most attractive option <strong>for</strong>
sidewalk installation. Installation is recommended on <strong>the</strong> north side of Ox<strong>for</strong>d Road due<br />
to a more consistently-wide right-of-way.
Map 9: Proposed Pedestrian Accommodations<br />
RAMP<br />
HOLIDAY DR<br />
250 BYPASS<br />
US HWY 250<br />
ST ANNES RD<br />
WARREN LN<br />
Meadowcreek Park<br />
GENTRY LN<br />
US HWY 250<br />
GROVE RD<br />
MEADOWBROOK RD<br />
Accommodations<br />
Crosswalk<br />
Existinig Crosswalk<br />
Existing Sidewalk<br />
HILLTOP RD<br />
DAIRY RD<br />
BLUE RIDGE RD<br />
Sidewalk<br />
RUGBY RD<br />
DEL MAR DR<br />
GREENLEAF LN<br />
OAKLEAF LN<br />
ROSE HILL DR<br />
McIntire Park<br />
CAMBRIDGE CIR<br />
BRUCE AVE<br />
250 BYPASS<br />
MASON LN<br />
PARKER PL<br />
HERNDON RD<br />
WELLFORD ST<br />
RUGBY AVE<br />
OXFORD PL<br />
OXFORD RD<br />
RUTLEDGE AVE<br />
<strong>Greenleaf</strong> Park<br />
PLYMOUTH RD<br />
RAMP<br />
SHERWOOD RD<br />
KENSINGTON AVE<br />
ROBINSON WOODS<br />
PRESTON AVE<br />
WESTWOOD RD<br />
Feet<br />
0 165 330 660 990 1,320<br />
HARDWOOD AVE<br />
AUGUSTA ST<br />
Source: City of Charlottesville GIS
The third and final high priority pedestrian link is Well<strong>for</strong>d Street from Rugby Avenue to<br />
<strong>Greenleaf</strong> lane. The installation of sidewalk along Well<strong>for</strong>d Street will complete <strong>the</strong><br />
pedestrian connection of <strong>the</strong> western portion of <strong>the</strong> neighborhood to <strong>Greenleaf</strong> Park.<br />
Because of <strong>the</strong> relatively low traffic volumes experienced on Well<strong>for</strong>d street and 30 foot<br />
road width, it is recommended that <strong>the</strong> roadway be used to accommodate sidewalk<br />
installation on <strong>the</strong> west side of <strong>the</strong> street in conjunction with parking restrictions.<br />
Objective Implementation:<br />
The City of Charlottesville should initiate installation of sidewalks with required resident<br />
approval. Several options are available <strong>for</strong> sidewalk installation depending or road width<br />
and <strong>the</strong> desires of adjacent residents.<br />
1. On streets with sufficient width, a portion of <strong>the</strong> asphalt may be removed and a<br />
new sidewalk and curbing installed, reducing <strong>the</strong> overall width of <strong>the</strong> road. This<br />
method may also be used in conjunction with <strong>the</strong> elimination of parking on one<br />
side of <strong>the</strong> street if <strong>the</strong> road width will o<strong>the</strong>rwise be too restrictive <strong>for</strong> vehicular<br />
traffic.<br />
2. Existing right-of-way can be used to install new sidewalks without reducing<br />
current road widths. The existing right-of-way varies depending upon <strong>the</strong> street<br />
in question.<br />
Objective 1.2: Install crosswalks at locations of high vehicle/pedestrian interaction<br />
To ensure pedestrian safety in <strong>Greenleaf</strong> <strong>Terrace</strong>, it is necessary to compliment <strong>the</strong><br />
installation of a complete sidewalk network with carefully placed crosswalks at<br />
intersections that pose a hazard to pedestrians due to high traffic volume, <strong>the</strong> presence of<br />
major pedestrian routes or poor driver visibility. Only one intersection within <strong>the</strong><br />
neighborhood, Rose Hill Drive and Ox<strong>for</strong>d Road, currently has a crosswalk; <strong>the</strong> only<br />
o<strong>the</strong>r existing crosswalks excluding those on Rugby Road and Rugby Avenue are <strong>the</strong><br />
three on Gentry Lane specifically<br />
to accommodate pedestrian traffic<br />
from Walker Elementary School.<br />
Map 9 depicts <strong>the</strong> recommended<br />
locations of additional crosswalks<br />
throughout <strong>Greenleaf</strong> <strong>Terrace</strong> to<br />
create safer street crossings <strong>for</strong><br />
pedestrians. All street crossings<br />
located on <strong>the</strong> high priority<br />
pedestrian routes mentioned in <strong>the</strong><br />
previous section should feature<br />
crosswalks; however, <strong>the</strong> type of<br />
crosswalk should be determined<br />
by <strong>the</strong> amount of vehicular traffic<br />
Figure 1: Crosswalk with bulb-out<br />
Source: Nick Rogers
present. Intersections that do not fall under <strong>the</strong> “high volume” category should, at<br />
minimum, include road striping to delimit <strong>the</strong> crosswalk location <strong>for</strong> both pedestrians and<br />
motorists. It is preferred that all crosswalks include wheelchair ramps to ensure ease of<br />
use <strong>for</strong> physically challenged residents.<br />
Increased signage is ano<strong>the</strong>r measure that should be employed to warn drivers of<br />
approaching crosswalks. This is especially important in cases where a driver’s view of<br />
<strong>the</strong> crosswalk may be obstructed, whe<strong>the</strong>r by a curve in <strong>the</strong> road or by changes in<br />
elevation.<br />
Objective Implementation:<br />
The City of Charlottesville should initiate <strong>the</strong> construction or improvement of crosswalks<br />
first at <strong>the</strong> following “high volume” intersections:<br />
• Rugby Road, Dairy Road and Gentry Lane<br />
• Del Mar Drive and Gentry Lane<br />
• <strong>Greenleaf</strong> Lane and Rose Hill Drive<br />
• Ox<strong>for</strong>d Road and Rose Hill Drive (improvement)<br />
The City should next focus its attention on <strong>the</strong> installation of crosswalks at all remaining<br />
intersections along <strong>the</strong> major pedestrian routes along Rose Hill Drive, Ox<strong>for</strong>d Road,<br />
Well<strong>for</strong>d Street and <strong>Greenleaf</strong> Lane.<br />
At intersections that present a particular risk to pedestrians, <strong>the</strong> City should investigate<br />
<strong>the</strong> use of devices such as rumble strips to help slow vehicles and warn drivers of <strong>the</strong><br />
approaching crosswalks. Noise generated from items such as rumble strips must be taken<br />
into consideration when installation is in a residential area such as <strong>Greenleaf</strong> <strong>Terrace</strong>.<br />
Objective 1.3: Install curb bulb-outs in conjunction with crosswalks<br />
Crosswalks at high-volume or low-visibility intersections should incorporate design<br />
features that increase <strong>the</strong> awareness of drivers that <strong>the</strong>y are approaching an area of<br />
possible pedestrian interaction. Whenever possible, <strong>the</strong>se types of crosswalks should be<br />
used in conjunction with curb bulb-outs which will create a narrowing of <strong>the</strong> roadway.<br />
Reducing roadway width will not only shorten <strong>the</strong> length of crossing <strong>for</strong> pedestrians; it<br />
will likewise serve as a mechanism to slow vehicles approaching <strong>the</strong> intersection.<br />
Narrower road widths typically lead to slower vehicle speeds, which in turn increases<br />
safety <strong>for</strong> pedestrians and cyclists alike.<br />
Curb bulb-outs also provide an additional aes<strong>the</strong>tic benefit; <strong>the</strong>y provide an additional<br />
area <strong>for</strong> landscaping, <strong>the</strong>reby adding color and interest to an o<strong>the</strong>rwise nondescript and<br />
mostly-paved location. <strong>Plan</strong>tings in <strong>the</strong> bulb-outs can be coordinated with plantings at<br />
neighborhood gateways to provide a consistent <strong>the</strong>me throughout <strong>the</strong> neighborhood.
Objective Implementation:<br />
The City of Charlottesville should, in conjunction with neighborhood residents,<br />
determine <strong>the</strong> best locations <strong>for</strong> curb bulb-out use depending upon crosswalk presence,<br />
existing road width and resident parking preferences. Bulb-outs should not be installed in<br />
locations where existing resident driveways will make vehicle entrance/egress difficult.<br />
Objective 1.4: Add pedestrian signals at Rugby Ave/Rose Hill Drive intersection<br />
The traffic volume analysis of <strong>Greenleaf</strong> <strong>Terrace</strong> reveals that as many as 7900 vehicles<br />
pass through <strong>the</strong> intersection of Rugby Avenue and Rose Hill Drive each weekday. Data<br />
analysis also reveals that <strong>the</strong> same intersection is currently <strong>the</strong> only signalized<br />
intersection on <strong>the</strong> perimeter of <strong>the</strong> neighborhood that does not have dedicated signals <strong>for</strong><br />
pedestrian or cyclist crossings.<br />
While <strong>the</strong> intersection of Rose Hill does not<br />
carry <strong>the</strong> traffic volumes experienced by <strong>the</strong><br />
intersections at Rugby Road and Rugby Avenue<br />
or Rugby Road and Barracks Road, it still<br />
carries enough traffic to pose a threat to<br />
pedestrians attempting to cross Rugby Avenue.<br />
The intersection doe currently feature<br />
crosswalks, but is lacking <strong>the</strong> pedestrian<br />
signalization found at <strong>the</strong> o<strong>the</strong>r two previously<br />
mentioned intersections.<br />
Objective Implementation:<br />
Figure 2: Countdown signal<br />
Source: precisionsolarcontrols.com<br />
The City of Charlottesville should install a pedestrian signal utilizing “countdown”<br />
signals that in<strong>for</strong>m pedestrians of crossing time remaining. Signal crossing time should<br />
be of a sufficient length to allow <strong>for</strong> <strong>the</strong> safe crossing of both cyclists and pedestrians,<br />
with consideration given to <strong>the</strong> needs of <strong>the</strong> disabled.<br />
Objective 1.5: Create park gateway to increase entrance visibility and enhance<br />
pedestrian safety<br />
<strong>Greenleaf</strong> Park is an outstanding neighborhood amenity that is enjoyed throughout <strong>the</strong><br />
year by <strong>the</strong> residents of <strong>Greenleaf</strong> <strong>Terrace</strong>. The existing humble entrance, however,<br />
belies <strong>the</strong> variety of recreation possibilities that await residents. <strong>Greenleaf</strong> Park deserves<br />
an entrance more fitting of its important position in <strong>the</strong> life of <strong>the</strong> neighborhood.<br />
The lack of a highly-visible park entrance also creates a potential hazard <strong>for</strong> pedestrians<br />
and cyclists alike as <strong>the</strong>y enter or leave <strong>the</strong> park from Rose Hill Drive. Motorists do not<br />
readily see <strong>the</strong> entrance and may not be expecting to encounter pedestrians or bikers in<br />
<strong>the</strong>ir path. It is recommended that a new, highly visible entrance be built <strong>for</strong> <strong>Greenleaf</strong><br />
Park. The new park entrance should utilize <strong>the</strong> extra area af<strong>for</strong>ded by <strong>the</strong> bulb-out to add
low landscaping that will help to visible connect <strong>the</strong> park to <strong>the</strong> rest of <strong>the</strong> neighborhood<br />
while at <strong>the</strong> same time providing a safer and more welcoming street crossing <strong>for</strong><br />
pedestrians.<br />
Objective Implementation:<br />
The City of Charlottesville, in consultation with residents adjacent to <strong>the</strong> park entrance<br />
should construct a new entrance <strong>for</strong> <strong>Greenleaf</strong> Park that incorporates a crosswalk with<br />
curb bulb-outs across Rose Hill Drive on <strong>the</strong> north side of <strong>the</strong> park entrance to coincide<br />
with <strong>the</strong> proposed walkway into <strong>the</strong> park. The crosswalk will also coincide with <strong>the</strong><br />
sidewalk proposed under Objective 1.1 <strong>for</strong> <strong>the</strong> north side of <strong>Greenleaf</strong> Lane.
Map 10: Proposed Bicycle Accommodations<br />
RAMP<br />
HOLIDAY DR<br />
Meadowcreek Park<br />
MEADOWBROOK RD<br />
250 BYPASS<br />
Accommodations<br />
Bike Route Signs<br />
New Bike Lane<br />
Existing Bike Lane<br />
HILLTOP RD<br />
US HWY 250<br />
DAIRY RD<br />
KEITH VALLEY RD<br />
GENTRY LN<br />
ST ANNES RD<br />
MEADOWBROOK HEIGHTS RD<br />
US HWY 250<br />
WARREN LN<br />
GROVE RD<br />
YORKTOWN DR<br />
CONCORD DR<br />
DEL MAR DR<br />
OAKLEAF LN<br />
RUGBY RD<br />
McIntire Park<br />
GREENLEAF LN<br />
CAMBRIDGE CIR<br />
BLUE RIDGE RD<br />
BRUCE AVE<br />
OXFORD PL<br />
<strong>Greenleaf</strong> Park<br />
250 BYPASS<br />
MASON LN<br />
KENSINGTON AVE<br />
HERNDON RD<br />
WELLFORD ST<br />
RUGBY AVE<br />
WESTWOOD RD<br />
OXFORD RD<br />
RUTLEDGE AVE<br />
ROSE HILL DR<br />
PLYMOUTH RD<br />
RAMP<br />
SHERWOOD RD<br />
RAMP<br />
RAMP<br />
PRESTON AVE<br />
ROBINSON WOODS<br />
HARDWOOD AVE<br />
Feet<br />
0 180 360 720 1,080 1,440<br />
AUGUSTA ST<br />
Source: City of Charlottesville GIS<br />
AMHERST ST
Goal 2: <strong>Greenleaf</strong> <strong>Terrace</strong> provides a safe and friendly atmosphere <strong>for</strong><br />
cycling.<br />
According to <strong>the</strong> results of <strong>the</strong> neighborhood survey conducted, over one-third of those<br />
surveyed cycle regularly. If <strong>the</strong> survey is representative of <strong>the</strong> average resident in <strong>the</strong><br />
neighborhood, as many as 300 of <strong>the</strong> 1000 residents 16 in <strong>Greenleaf</strong> <strong>Terrace</strong> will<br />
potentially cycle within <strong>the</strong> neighborhood. The establishment of safe cycling routes<br />
within <strong>Greenleaf</strong> <strong>Terrace</strong> is clearly an important step toward increasing <strong>the</strong> number of<br />
transportation and recreation alternatives <strong>for</strong> neighborhood residents. However, <strong>the</strong><br />
importance of establishing bicycle route within <strong>the</strong> neighborhood is equally relevant to<br />
<strong>the</strong> fur<strong>the</strong>r expansion of Charlottesville’s existing bicycle lane and path system and <strong>the</strong><br />
fulfillment of <strong>the</strong> current Charlottesville Comprehensive plan.<br />
Objective 2.1: Incorporate previous plan recommendations of bike lanes on Rugby<br />
Avenue<br />
The Charlottesville Bicycle and Pedestrian <strong>Plan</strong> 17 recommends <strong>the</strong> addition of bike lanes<br />
to Rugby Avenue. These lanes will provide an important link to <strong>the</strong> bike lanes on Rugby<br />
Road that are also proposed under <strong>the</strong> same plan, although adding bike lanes to Rugby<br />
Road will require major modification to <strong>the</strong> roadway, making near-term implementation<br />
unlikely. Cycling lanes on Rugby Avenue will also create a much-needed connection <strong>for</strong><br />
bicycle traffic from <strong>the</strong> sou<strong>the</strong>rn end of <strong>Greenleaf</strong> <strong>Terrace</strong> to McIntire Park.<br />
Bicycle lanes on Rugby Avenue should be designated by pavement striping at a<br />
minimum and <strong>the</strong> City should also investigate <strong>the</strong> use of pavement reflectors not only to<br />
aid visibility in poor wea<strong>the</strong>r and low lighting, but also to provide an auditory warning<br />
when vehicles begin to encroach on cyclists. Clear signage should also accompany <strong>the</strong><br />
addition of bicycle lanes to notify motorists that <strong>the</strong>y may encounter high levels of<br />
bicycle traffic.<br />
Objective Implementation:<br />
The City of Charlottesville should use <strong>the</strong> 5’ minimum width <strong>for</strong> <strong>the</strong> installation of<br />
bicycle lanes on Rugby Avenue and restrict parking to one side of <strong>the</strong> street if necessary<br />
after resident consultation. Applied striping materials should be used ra<strong>the</strong>r than painted<br />
stripes to ensure marking longevity. Reflectors should be installed in conjunction with<br />
<strong>the</strong> striping within 50 feet of intersections at minimum. Signage should be installed in<br />
accordance with location shown on Map 10 and should be located as near <strong>the</strong> roadway as<br />
possible in an area free from obstructions.<br />
16 2000 US Census Bureau, Summary File 1<br />
17 2003 City of Charlottesville Bicycle & Pedestrian Facilities Master <strong>Plan</strong>
Objective 2.2: Extend bike lanes on Rose Hill Drive north to Crow Recreation Center<br />
The Charlottesville Bicycle and Pedestrian <strong>Plan</strong> recommends adding signage to Rose Hill<br />
Drive to warn drivers of <strong>the</strong> presence of cyclists 18 . It is recommended that bicycle lanes<br />
be designated using pavement markings in addition to <strong>the</strong> planned additional signage.<br />
The lanes on Rose Hill Drive will facilitate a connection to <strong>the</strong> Crow Recreation Center<br />
adjacent to Walker Elementary and provide a safer route <strong>for</strong> cyclists in <strong>Greenleaf</strong> <strong>Terrace</strong><br />
traveling to or from <strong>the</strong> downtown area to <strong>the</strong> south.<br />
In a similar fashion to <strong>the</strong> lanes recommended <strong>for</strong> Rugby Avenue, bicycle lanes on Rose<br />
Hill Drive should be marked clearly using pavement striping, signage and, if possible,<br />
reflectors <strong>for</strong> poor-visibility situations. Installation of lanes may require removal of some<br />
parking after resident consultation.<br />
Objective Implementation:<br />
See implementation instruction <strong>for</strong> Objective 2.2<br />
Objective 2.3: Install bike route signs on Ox<strong>for</strong>d Road, Del Mar Drive and Gentry Lane<br />
(from Del Mar to Rugby Road)<br />
Many motorists pay little attention to cyclists and pedestrians, a situation that can lead to<br />
hazardous emergency maneuvers that threaten <strong>the</strong> safety of both <strong>the</strong> driver and <strong>the</strong><br />
cyclist/pedestrian. Cyclists are under additional risk relative to pedestrians because in<br />
most cases, <strong>the</strong>y are <strong>for</strong>ced to continuously share <strong>the</strong> road with vehicular traffic.<br />
Installing signage is a relatively easy method to ensure that motorists are aware of <strong>the</strong><br />
possibility of interacting with bicycle traffic.<br />
Due to existing road widths and anticipated lower levels of cyclists, Ox<strong>for</strong>d Road, Del<br />
Mar Drive and Gentry Lane (from Del Mar to Rugby Road) are not appropriate <strong>for</strong><br />
pavement-designated bicycle lanes without ei<strong>the</strong>r <strong>the</strong> elimination of parking on at least<br />
one side of <strong>the</strong> road or road widening. These streets should instead incorporate <strong>the</strong> use of<br />
“bike route” and “share <strong>the</strong> road” signage as described above.<br />
Objective Implementation:<br />
The City of Charlottesville should erect signage <strong>for</strong> <strong>the</strong> proposed bicycle routes in<br />
accordance with Map 10. Signs should clearly mark <strong>the</strong> roads as a “bike route” and<br />
should be accompanied by a “share <strong>the</strong> road” sign emphasizing <strong>the</strong> importance of driver<br />
awareness and additional courtesy required when dealing with cyclists.<br />
18 2003 City of Charlottesville Bicycle & Pedestrian Facilities Master <strong>Plan</strong>
Objective 2.4: Provide bicycle racks within <strong>Greenleaf</strong> Park<br />
A key component to <strong>the</strong> fulfillment of Goal 2 is providing not only a safer but a<br />
“friendlier” atmosphere <strong>for</strong> cyclists in <strong>Greenleaf</strong> <strong>Terrace</strong>. Creating this atmosphere<br />
requires supplying cyclists with amenities that make it easier <strong>for</strong> <strong>the</strong>m to take full<br />
advantage of <strong>the</strong> recreational possibilities that exist within <strong>the</strong> neighborhood.<br />
Source: moma.org<br />
of <strong>the</strong> many facilities that are available at <strong>the</strong> park.<br />
<strong>Greenleaf</strong> Park is a<br />
recreational amenity that is<br />
available to neighborhood<br />
residents via multiple modes<br />
of transportation. Limited<br />
vehicle spaces currently exist<br />
within <strong>Greenleaf</strong> Park <strong>for</strong><br />
those who choose to drive,<br />
and pedestrians don’t require<br />
a place to store a vehicle<br />
while visiting. Currently, no<br />
secure space exists <strong>for</strong> <strong>the</strong><br />
temporary storage of bicycles<br />
while cyclists are making use<br />
The installation of a bicycle rack in <strong>Greenleaf</strong> Park is recommended to provide a safe and<br />
secure location <strong>for</strong> cyclists to stow bicycles while <strong>the</strong>y enjoy park amenities. The rack<br />
should be installed in an area with a clear line of sight to <strong>the</strong> park entrance, both <strong>for</strong><br />
safety purposes and to ensure <strong>the</strong> rack is easily spotted by entering cyclists.<br />
Objective Implementation:<br />
The City of Charlottesville should, through a cyclist usage survey, determine <strong>the</strong><br />
appropriate size <strong>for</strong> <strong>the</strong> rack/racks. Through <strong>the</strong> use of <strong>the</strong> same survey, <strong>the</strong> best<br />
placement of <strong>the</strong> rack/racks can be determined (adjacent to restrooms, drinking fountain,<br />
etc.). The design of <strong>the</strong> rack should be unobtrusive and should compliment ra<strong>the</strong>r than<br />
detract from <strong>the</strong> appearance of <strong>the</strong> park.
Map 11: Proposed Traffic Calming Measures<br />
RAMP<br />
HOLIDAY DR<br />
Meadowcreek Park<br />
MEADOWBROOK RD<br />
250 BYPASS<br />
Traffic Calming<br />
<strong>Neighborhood</strong> Gateway<br />
Speed Hump<br />
Traffic Circle<br />
HILLTOP RD<br />
US HWY 250<br />
DAIRY RD<br />
KEITH VALLEY RD<br />
GENTRY LN<br />
ST ANNES RD<br />
MEADOWBROOK HEIGHTS RD<br />
US HWY 250<br />
WARREN LN<br />
GROVE RD<br />
YORKTOWN DR<br />
CONCORD DR<br />
DEL MAR DR<br />
OAKLEAF LN<br />
RUGBY RD<br />
McIntire Park<br />
GREENLEAF LN<br />
CAMBRIDGE CIR<br />
BLUE RIDGE RD<br />
BRUCE AVE<br />
OXFORD PL<br />
<strong>Greenleaf</strong> Park<br />
250 BYPASS<br />
MASON LN<br />
KENSINGTON AVE<br />
HERNDON RD<br />
WELLFORD ST<br />
RUGBY AVE<br />
WESTWOOD RD<br />
OXFORD RD<br />
RUTLEDGE AVE<br />
ROSE HILL DR<br />
PLYMOUTH RD<br />
RAMP<br />
SHERWOOD RD<br />
RAMP<br />
RAMP<br />
PRESTON AVE<br />
ROBINSON WOODS<br />
HARDWOOD AVE<br />
Feet<br />
0 180 360 720 1,080 1,440<br />
AUGUSTA ST<br />
Source: City of Charlottesville GIS<br />
AMHERST ST
Goal 3: Vehicles in <strong>Greenleaf</strong> <strong>Terrace</strong> travel at posted speed limits and cutthrough<br />
traffic is discouraged.<br />
Pedestrian safety is clearly <strong>the</strong> <strong>for</strong>emost concern of many <strong>Greenleaf</strong> <strong>Terrace</strong> residents.<br />
The root cause of <strong>the</strong> concern <strong>for</strong> safety undoubtedly stems from <strong>the</strong> perception shared by<br />
many residents of a vehicular speeding problem within <strong>the</strong> neighborhood. The vehicular<br />
speed data ga<strong>the</strong>red by <strong>the</strong> City of Charlottesville substantiates <strong>the</strong> perception of a<br />
speeding problem within <strong>Greenleaf</strong> <strong>Terrace</strong>. A lack of traffic control is clearly not <strong>the</strong><br />
issue; all major intersections surrounding <strong>the</strong> neighborhood are signalized and all internal<br />
intersections utilize stop signs. Vehicles reaching speeds above <strong>the</strong> posted limits<br />
primarily at “mid-block” locations, a situation that is amplified in <strong>Greenleaf</strong> terrace due<br />
to its meandering network of streets and relatively long distances on many streets<br />
between intersections. However, more can be done at some intersections to slow traffic<br />
as well. Residents complain of vehicles “tapping” <strong>the</strong>ir brakes at stop signs while<br />
continuing to roll through <strong>the</strong>m- a potentially hazardous situation. Traffic calming<br />
solutions can be applied both at and in between intersections that will help significantly<br />
to slow traffic in <strong>the</strong> neighborhood.<br />
Cut-through traffic originating from outside <strong>Greenleaf</strong> <strong>Terrace</strong> also factors into <strong>the</strong><br />
equation of pedestrian safety. An analysis of traffic volumes throughout <strong>the</strong><br />
neighborhood (shown on Map 6, p. 15) indicate that some vehicles may be choosing to<br />
pass through <strong>the</strong> neighborhood ra<strong>the</strong>r than wait <strong>for</strong> signals at <strong>the</strong> busy intersections on<br />
Rugby Road. It is also apparent from traffic count data that Walker Elementary is a<br />
major generator of trips through <strong>the</strong> neighborhood. The use of traffic calming devices<br />
will not only aid in reducing traffic speed through <strong>the</strong> neighborhood, but will help make<br />
<strong>the</strong> local streets of <strong>Greenleaf</strong> <strong>Terrace</strong> less attractive and convenient to traffic from outside<br />
destinations.<br />
Objective 3.1: Install speed humps at strategic locations to help slow vehicular traffic<br />
Figure 3: Speed hump<br />
Source: ci.muscatine.ia.us<br />
Speed bumps have been utilized <strong>for</strong><br />
many years in <strong>the</strong> reduction of vehicle<br />
speeds. While <strong>the</strong>y can be effective in<br />
reducing vehicle speeds, speed bumps<br />
are also designed <strong>for</strong> very low speed<br />
traffic and are usually found in parking<br />
lots ra<strong>the</strong>r than on local streets.<br />
Typically, “speed humps” are used on<br />
local streets to slow traffic; <strong>the</strong>y are less<br />
abrupt and <strong>the</strong>re<strong>for</strong>e allow slightly<br />
faster crossing speeds and less noise<br />
that created by a speed bump (See Fig.<br />
2). According to <strong>the</strong> Charlottesville
Traffic Calming Device Implementation Guidebook, when a vehicle traverses speed<br />
humps or “speed tables,” “a rocking motion is created that results in most vehicles<br />
slowing to 15 miles per hour or less.” 19<br />
All speed humps should include signs warning drivers of <strong>the</strong>ir presence and should span<br />
<strong>the</strong> entire width of <strong>the</strong> travel lanes to discourage drivers from maneuvering around <strong>the</strong><br />
devices.<br />
According to analysis of collected speed data within <strong>Greenleaf</strong> <strong>Terrace</strong> (Map 7, p. 18), all<br />
collection points showed 85 th percentile speeds above <strong>the</strong> posted speed limit of 25 miles<br />
per hour. All roads where speeds were measured exhibit a moderate to serious speeding<br />
problem, according to <strong>the</strong> definitions provided by <strong>the</strong> City of Charlottesville. 20<br />
Both Rose Hill Drive and Ox<strong>for</strong>d Road include relatively long stretches of road between<br />
intersections. Rose Hill Drive between Ox<strong>for</strong>d Road and <strong>Greenleaf</strong> Lane measures<br />
approximately 1000 feet between intersections; <strong>the</strong> stretch of Ox<strong>for</strong>d Road between<br />
Rugby Road and Well<strong>for</strong>d Street measures an even longer 1600 feet. These long sections<br />
of uninterrupted roadway allow vehicles to reach speeds well in excess of <strong>the</strong> posted limit<br />
be<strong>for</strong>e encountering any obstacles. Because of this potential <strong>for</strong> reaching high speeds,<br />
both of <strong>the</strong> a<strong>for</strong>ementioned sections of roadway should be given <strong>the</strong> highest priority <strong>for</strong><br />
speed hump installation.<br />
O<strong>the</strong>r well traveled sections of road that would benefit from speed humps include <strong>the</strong><br />
entire length of Gentry Lane, <strong>the</strong> entire length of Well<strong>for</strong>d Street and <strong>the</strong> remaining<br />
length of Rose Hill Drive.<br />
Objective Implementation:<br />
The city of Charlottesville should install speed humps in a manner that will render <strong>the</strong>m<br />
most effective <strong>for</strong> <strong>the</strong> reduction of vehicle speeds. Recommended locations <strong>for</strong> <strong>the</strong> speed<br />
humps are shown on Map 11. Long stretches of roadway may require a series of speed<br />
humps placed 300-600 feet apart to see <strong>the</strong> most benefit in speed reduction. 21 Speed<br />
humps may be constructed from a variety of different materials and with a varying degree<br />
of permanence. Speed humps/tables may be constructed of asphalt or <strong>the</strong>y may be<br />
composed of a dense rubber or plastic material that is affixed to <strong>the</strong> roadway. Currently,<br />
a “moderate” speeding condition is required to install speed tables, while <strong>the</strong> utilization<br />
of speed humps requires a “serious” condition. 22 It is recommended that this discrepancy<br />
in <strong>the</strong> Charlottesville Traffic Calming Guidelines be changed to allow <strong>the</strong> installation of<br />
lower-cost speed humps in moderate speed situations.<br />
Objective 3.2: Install traffic circles at <strong>the</strong> intersections of Del Mar Drive & <strong>Greenleaf</strong><br />
Lane, Del Mar Drive and Oakleaf Lane, Ox<strong>for</strong>d Road & Rose Hill Drive and Dairy<br />
Road/Gentry Lane/Rugby Road to help slow and better manage vehicular traffic<br />
19 2000 City of Charlottesville Traffic Calming Device Implementation Guidebook<br />
20 2000 City of Charlottesville Traffic Calming Device Implementation Guidebook<br />
21 2000 City of Charlottesville Traffic Calming Device Implementation Guidebook<br />
22 2000 City of Charlottesville Traffic Calming Device Implementation Guidebook
Many people have a mental image of traffic circles that can create serious challenges to<br />
<strong>the</strong>ir implementation. Several misconceptions exist regarding <strong>the</strong> safety of both vehicles<br />
and pedestrians negotiating traffic circles and <strong>the</strong>ir larger <strong>for</strong>m, known as “roundabouts.”<br />
In reality, properly designed traffic circles have been shown to significantly reduce <strong>the</strong><br />
number of vehicular accidents at<br />
intersections. 23 Traffic circles in<br />
<strong>Greenleaf</strong> <strong>Terrace</strong> will not only help<br />
reduce <strong>the</strong> speed of traffic in and<br />
around intersections; <strong>the</strong>y will also<br />
help to improve vehicular and<br />
pedestrian safety. An additional side<br />
benefit will be <strong>the</strong> elimination of <strong>the</strong><br />
confusion that can accompany<br />
intersections with multi-way stop<br />
signs.<br />
The traffic circles recommended <strong>for</strong><br />
all of <strong>the</strong> above intersections should<br />
be designed with mountable or semimountable<br />
center islands to allow<br />
negotiation by emergency and road<br />
maintenance vehicles. Center islands<br />
can incorporate landscaping and<br />
decorative materials such as brick or<br />
Figure 4: Traffic Circle<br />
Source: Cityoflansingmi.com<br />
stone and <strong>the</strong>reby also provide an aes<strong>the</strong>tic benefit to <strong>the</strong> neighborhood in addition to<br />
traffic-calming benefits.<br />
Objective Implementation:<br />
The City of Charlottesville should install traffic circles in <strong>Greenleaf</strong> <strong>Terrace</strong> in<br />
accordance with <strong>the</strong> design considerations included in <strong>the</strong> Charlottesville Traffic Calming<br />
Guidebook. The design of <strong>the</strong> circles should be consistent with that shown in Figure 3<br />
and should include “splitter bars” to help direct traffic into <strong>the</strong> circle and slow its<br />
approach.<br />
The traffic circles at Del Mar Drive and Oakleaf and <strong>Greenleaf</strong> Lanes will be connected<br />
by an island because of <strong>the</strong>ir proximity to one ano<strong>the</strong>r. Each road entering <strong>the</strong> traffic<br />
circle will feature a pedestrian crosswalk that will utilize <strong>the</strong> splitter bar as a mid-point of<br />
<strong>the</strong> crossing. The remainder of <strong>the</strong> traffic circles will follow a design similar to that in<br />
figure 4.<br />
Clear signage should be included on all roads entering each circle to warn motorists of its<br />
presence, especially in cases where visibility of <strong>the</strong> intersection is limited. Pedestrian-<br />
23 2000 City of Charlottesville Traffic Calming Device Implementation Guidebook
scale lighting should also be used in and adjacent to <strong>the</strong> traffic circles to ensure safety at<br />
night.<br />
Objective 3.3: Create neighborhood gateways at Rose Hill Drive & Rugby Avenue,<br />
Ox<strong>for</strong>d Road & Rugby Road and Gentry Lane & Rugby Road<br />
The concept of creating neighborhood gateways is relatively simple and has several<br />
benefits. <strong>Neighborhood</strong> gateways assist in creating a unique identity <strong>for</strong> a neighborhood<br />
and bolster community pride; it can also let those unfamiliar with <strong>the</strong> area know that <strong>the</strong>y<br />
are leaving one area and entering ano<strong>the</strong>r. From a traffic standpoint, gateways in<strong>for</strong>m<br />
drivers that <strong>the</strong>y are entering a residential neighborhood and <strong>the</strong>re<strong>for</strong>e should expect<br />
lower speed limits, narrower streets and increased levels of pedestrian traffic. Gateways<br />
also provide an opportunity to add landscaping and visual interest to what may be an<br />
o<strong>the</strong>rwise bland intersection.<br />
The intersection of Rose Hill<br />
Drive and Rugby Avenue<br />
was selected as a gateway<br />
location because of its high<br />
daily traffic volumes as well<br />
as its prominence as a<br />
neighborhood entrance. This<br />
gateway should receive <strong>the</strong><br />
most attention and should be<br />
prioritized over <strong>the</strong> o<strong>the</strong>r two<br />
intersections. The remaining<br />
intersections were chosen as<br />
gateways partly due to traffic<br />
volumes, but largely because<br />
Source: nowland.org<br />
<strong>the</strong>y both represent an abrupt<br />
transition from a relatively<br />
busy collector road into an area with a very quiet, residential character. The entrance to<br />
Ox<strong>for</strong>d Road at Rugby Road already has low walls- it would be possible to improve <strong>the</strong><br />
gateway, perhaps with a placard and landscaping <strong>for</strong> a minimum cost. Placing gateways<br />
at each of <strong>the</strong>se locations will alert motorists to this change and prompt <strong>the</strong>m to adjust<br />
<strong>the</strong>ir driving speed and style accordingly.<br />
Objective Implementation:<br />
The City of Charlottesville should work closely with <strong>Greenleaf</strong> <strong>Terrace</strong> Residents to<br />
ensure that <strong>the</strong> installed neighborhood gateways reflect <strong>the</strong> proper “neighborhood image”<br />
The city should establish, through <strong>the</strong> <strong>Greenleaf</strong> <strong>Terrace</strong> <strong>Neighborhood</strong> Association, a<br />
group of residents that are willing to donate time toward <strong>the</strong> maintenance of any<br />
landscaping that accompanies <strong>the</strong> gateways. An example of a simple gateway treatment<br />
would be an unobtrusive sign naming <strong>Greenleaf</strong> <strong>Terrace</strong> accompanied by attractive
landscaping at each corner. A more complex alternative would utilize stone or brick<br />
columns at each corner attached to a low wall to which would be affixed <strong>the</strong><br />
neighborhood name. The final design should reflect <strong>the</strong> input and character of <strong>the</strong><br />
neighborhood and its residents.
Goal 4: Public transit is a convenient and efficient transportation alternative<br />
<strong>for</strong> neighborhood residents and is linked to pedestrian and bicycle routes.<br />
Public transportation is an important component of urban life; just like walking and<br />
biking, it provides an alternative means of transportation to <strong>the</strong> automobile, especially <strong>for</strong><br />
those that ei<strong>the</strong>r do not have access to or are unable to utilize o<strong>the</strong>r modes. While survey<br />
results indicate that a small percentage of <strong>Greenleaf</strong> <strong>Terrace</strong> residents currently take<br />
advantage of <strong>the</strong> Charlottesville Transit Service (CTS) bus route that serves <strong>the</strong><br />
neighborhood, many surveyed residents indicated that <strong>the</strong>y might use <strong>the</strong> service more<br />
frequently if it were made more convenient. The same residents also cited <strong>the</strong> current<br />
lack of service to <strong>the</strong> University of Virginia campus as a major disincentive toward bus<br />
usage.<br />
Because of <strong>the</strong> nature of public mass transit, <strong>the</strong> bus can not reasonably visit every street<br />
in <strong>the</strong> neighborhood as it circulates on its route. The current route through <strong>the</strong><br />
neighborhood serves most residents well, although <strong>the</strong> majority of <strong>the</strong>m may have to<br />
walk 1 to 2 city blocks to reach a bus stop. This is not a issue as long as <strong>the</strong> walk or bike<br />
ride to <strong>the</strong> bus stop is made safely on sidewalks and with safe street crossings. Many of<br />
<strong>the</strong> improvements under Goal 1 are <strong>the</strong>re<strong>for</strong>e strongly tied to making public transit<br />
service more accessible to <strong>Greenleaf</strong> <strong>Terrace</strong> residents.<br />
Objective 4.1: Modify current route 3B to include service to UVA campus<br />
The 2007 alteration to CTS route 3B that resulted in <strong>the</strong> drop of direct service to <strong>the</strong><br />
UVA campus is consistently cited as a reason <strong>for</strong> discontinuing bus patronage by<br />
<strong>Greenleaf</strong> <strong>Terrace</strong> residents. UVA is a major employer in Charlottesville as well as<br />
attracting many thousands of students a year to its campus. Resuming direct service to<br />
<strong>the</strong> UVA campus can only increase <strong>the</strong> use of this currently underutilized community<br />
service. There<strong>for</strong>e it is recommended that service to <strong>the</strong> UVA campus be added to <strong>the</strong><br />
existing route 3B to enable more residents in <strong>the</strong> neighborhood to use mass transit as a<br />
means to travel to work or school.<br />
Objective Implementation:<br />
The City of Charlottesville, through <strong>the</strong> Charlottesville Transit Service (CTS) should<br />
implement <strong>the</strong> creation of Route 9 as proposed <strong>for</strong> <strong>the</strong> 2009 city budget. This new route<br />
would replace <strong>the</strong> existing route 3B and would resume service to <strong>the</strong> UVA campus while<br />
also extending service north of <strong>the</strong> neighborhood to Grove Road.<br />
Objective 4.2: Increase frequency of bus route navigation from every one to every onehalf<br />
hour during peak travel times<br />
Relatively frequent bus service is an important factor in <strong>the</strong> ability <strong>for</strong> riders to<br />
conveniently utilize a mass transit system. Many areas in Charlottesville do not have <strong>the</strong><br />
levels of ridership to support 15 minute or even half-hour. Un<strong>for</strong>tunately, <strong>the</strong> need to
most efficiently use busses requires sacrificing <strong>the</strong> frequency of service, which in turn<br />
makes it more difficult <strong>for</strong> riders to utilize <strong>the</strong> system. A compromise between<br />
maximizing bus use and providing a more useful level of service would seen to be one<br />
solution to <strong>the</strong> situation that would not require a significant increase in resources.<br />
To help improve <strong>the</strong> usability of <strong>the</strong> CTS bus service <strong>for</strong> <strong>Greenleaf</strong> <strong>Terrace</strong> residents and<br />
o<strong>the</strong>r riders using <strong>the</strong> same route, it is recommended that service frequency be increased<br />
to every half hour during peak morning and evening travel times. This will effectively<br />
make bus usage more convenient <strong>for</strong> riders, yet will allow CTS to still operate <strong>the</strong> route<br />
within its budgetary constraints.<br />
Objective Implementation:<br />
The City of Charlottesville, through CTS, should determine <strong>the</strong> best method <strong>for</strong><br />
implementation of this objective. If <strong>the</strong> implementation of <strong>the</strong> proposed Route 9 results<br />
in a significant increase in ridership, it may be warranted to devote a second full-size bus<br />
to <strong>the</strong> route during peak hours to increase service frequency. If ridership does not<br />
increase, it may be easier to use a smaller bus or oversize van to increase service<br />
frequency when needed.<br />
Objective 4.3: Ensure that CTS stops are linked to major pedestrian routes and that<br />
stops provide a welcoming environment <strong>for</strong> waiting riders<br />
The linkage between alternative transportation modes in <strong>Greenleaf</strong> <strong>Terrace</strong> is of<br />
paramount importance to <strong>the</strong>ir ease of use <strong>for</strong> neighborhood residents. Residents are less<br />
likely to utilize <strong>the</strong> CTS bus services if <strong>the</strong>ir walk to a stop is impeded in some manner.<br />
To achieve this modal linkage, it is essential that <strong>the</strong> high-priority sidewalks identified<br />
under Objective 1.1 be installed. This will help to ensure <strong>the</strong> safety and com<strong>for</strong>t of those<br />
making <strong>the</strong>ir way to one of <strong>the</strong> CTS stops.<br />
Public transit can sometimes be <strong>the</strong> only<br />
means of transportation available to <strong>the</strong> elderly<br />
or physically disabled. For physically<br />
challenged residents, <strong>the</strong> walk to a bus stop<br />
itself can be an arduous journey, and upon<br />
arrival at <strong>the</strong> stop, it may be necessary to rest<br />
while waiting <strong>for</strong> <strong>the</strong> arrival of a bus. While a<br />
few CTS stops in <strong>the</strong> neighborhood currently<br />
possess benches, most stops do not have such<br />
an amenity available. Benches should be<br />
installed at all CTS stops within <strong>Greenleaf</strong><br />
<strong>Terrace</strong> to ensure <strong>the</strong> com<strong>for</strong>t of waiting riders.<br />
While access to <strong>the</strong> internet and “online”<br />
in<strong>for</strong>mation regarding a host of public services<br />
has become available to a large portion of <strong>the</strong><br />
Source: nwpr.bc.ca
population, many <strong>Greenleaf</strong> <strong>Terrace</strong> residents may not enjoy easy access to such<br />
in<strong>for</strong>mation. A decision to ride a bus may also be made on <strong>the</strong> “spur of <strong>the</strong> moment,”<br />
ra<strong>the</strong>r than being planned in advance. In both of <strong>the</strong> preceding situations, it is essential to<br />
have route and schedule in<strong>for</strong>mation available to potential riders in a <strong>for</strong>m that can be<br />
easily accessed and understood. A CTS route map and schedule should be posted<br />
prominently at each stop within <strong>Greenleaf</strong> <strong>Terrace</strong>.<br />
Objective Implementation:<br />
The City of Charlottesville should implement sidewalk improvements as proposed under<br />
Objective 1.1, <strong>the</strong>reby ensuring that CTS stops and major pedestrian routes coincide. The<br />
city should utilize benches that are in character with <strong>the</strong> suburban residential feeling<br />
found throughout <strong>Greenleaf</strong> <strong>Terrace</strong>. Benches should be large enough to com<strong>for</strong>tably<br />
accommodate three adults and should be permanently affixed to avoid possible <strong>the</strong>ft or<br />
vandalism. Route and schedule in<strong>for</strong>mation should ei<strong>the</strong>r be printed on wea<strong>the</strong>rproof<br />
material or should be protected from <strong>the</strong> elements by some <strong>for</strong>m of covering material.<br />
Route and schedule in<strong>for</strong>mation should be regularly checked to see if replacement is<br />
needed due to damage or route changes. A telephone number should accompany <strong>the</strong><br />
in<strong>for</strong>mation where riders can receive assistance with route and schedule in<strong>for</strong>mation if<br />
needed.
Implementation Matrix<br />
The implementation matrix below lists <strong>the</strong> recommended improvement and a time frame<br />
<strong>for</strong> implementation. All improvements will be <strong>the</strong> responsibility of <strong>the</strong> City of<br />
Charlottesville in coordination with neighborhood residents. While <strong>the</strong> City will be<br />
responsible <strong>for</strong> <strong>the</strong> installation of <strong>the</strong> devices listed below, residents may be required to<br />
assist in <strong>the</strong> maintenance of neighborhood signs and associated landscaping.<br />
Action<br />
Pedestrian<br />
Install sidewalk on <strong>Greenleaf</strong> Ln.<br />
and Oakleaf Ln.<br />
Install sidewalk on Well<strong>for</strong>d St.<br />
Install sidewalk on Ox<strong>for</strong>d Road<br />
Complete sidewalk network<br />
Install crosswalk at Rugby Rd. &<br />
Dairy Rd.<br />
Install crosswalk at Del Mar Rd. &<br />
Gentry Ln.<br />
Install crosswalk at <strong>Greenleaf</strong> Ln.<br />
&Rose Hill Dr.<br />
Install crosswalk at Ox<strong>for</strong>d Rd. &<br />
Rose Hill Dr.<br />
Install crosswalks along Well<strong>for</strong>d<br />
St.<br />
Install crosswalks along Ox<strong>for</strong>d<br />
Rd.<br />
Add pedestrian signal at Rose Hill<br />
Dr. & Rugby Ave.<br />
Bicycling<br />
Create bike lanes on Rugby Av.<br />
Create bike lanes on Rose Hill Dr.<br />
Install bike route signs<br />
Install bicycle rack<br />
Speeding<br />
Install speed humps on Rose Hill<br />
Dr.<br />
Install speed humps on Ox<strong>for</strong>d Rd.<br />
Install speed humps on <strong>Greenleaf</strong><br />
Ln. & Gentry Ln.<br />
Install speed humps through<br />
remainder of neighborhood<br />
Short Term<br />
1-3 years<br />
X<br />
X<br />
X<br />
X<br />
X<br />
X<br />
X<br />
X<br />
X<br />
X<br />
X<br />
X<br />
Middle Tern<br />
3-5 years<br />
X<br />
X<br />
X<br />
X<br />
X<br />
X<br />
Long Term<br />
5-8 years<br />
X
Action<br />
Install traffic circle at Del Mar Dr.<br />
& <strong>Greenleaf</strong> Ln.<br />
Install traffic circle at Del Mar Dr.<br />
& Oakleaf Ln.<br />
Install traffic circle at Ox<strong>for</strong>d Rd.<br />
& Rose Hill Dr.<br />
Install traffic circle at Rugby Rd. &<br />
Dairy Rd.<br />
Create neighborhood gateway at<br />
Rose Hill Dr. & Rugby Ave.<br />
Improve neighborhood gateway at<br />
Ox<strong>for</strong>d Rd. & Rugby Rd.<br />
Create neighborhood gateway at<br />
Gentry Ln. & Rugby Rd.<br />
Public Transit<br />
Modify route to include UVA<br />
Increase frequency of service<br />
Install benches<br />
Post route/schedule<br />
Short Term<br />
1-3 years<br />
X<br />
X<br />
X<br />
Middle Tern<br />
3-5 years<br />
X<br />
X<br />
X<br />
X<br />
X<br />
Long Term<br />
5-8 years<br />
X<br />
X<br />
X
Appendices
Appendix A<br />
Traffic Count Data Sheets<br />
City of Charlottesville, 2008
Nu-Metrics Traffic Analyzer Study<br />
Computer Generated Summary Report<br />
City: Charlottesville<br />
Street: Gentry Ln @ 1443<br />
A study of vehicle traffic was conducted with HI-STAR unit number 2878. The study was done in <strong>the</strong><br />
NB lane on Gentry Ln @ 1443 in Charlottesville, VA in /_near Albemarle county. The study began on<br />
02/26/2008 at 12:00 AM and concluded on 02/29/2008 at 12:00 AM, lasting a total of 72 hours. Data<br />
was recorded in 15 minute time periods. The total recorded volume of traffic showed 1,971 vehicles<br />
passed through <strong>the</strong> location with a peak volume of 37 on 02/28/2008 at 07:45 AM and a minimum<br />
volume of 0 on 02/26/2008 at 12:00 AM. The AADT Count <strong>for</strong> this study was 657.<br />
SPEED<br />
Chart 1 lists <strong>the</strong> values of <strong>the</strong> speed bins and <strong>the</strong> total traffic volume <strong>for</strong> each bin.<br />
0<br />
to<br />
9<br />
10<br />
to<br />
14<br />
15<br />
to<br />
19<br />
20<br />
to<br />
24<br />
25<br />
to<br />
29<br />
30<br />
to<br />
34<br />
35<br />
to<br />
39<br />
Chart 1<br />
40<br />
to<br />
44<br />
0 41 490 1050 293 52 15 10 1 1 10 0 0 0 0<br />
At least half of <strong>the</strong> vehicles were traveling in <strong>the</strong> 20 - 24 mph range or a lower speed. The average<br />
speed <strong>for</strong> all classified vehicles was 22 mph with 19.4 percent exceeding <strong>the</strong> posted speed of 25 mph.<br />
The HI-STAR found 0.51 percent of <strong>the</strong> total vehicles were traveling in excess of 55 mph. The mode<br />
speed <strong>for</strong> this traffic study was 20 mph and <strong>the</strong> 85th percentile was 26.49 mph.<br />
CLASSIFICATION<br />
Chart 2 lists <strong>the</strong> values of <strong>the</strong> eight classification bins and <strong>the</strong> total traffic volume accumulated <strong>for</strong> each<br />
bin.<br />
45<br />
to<br />
49<br />
50<br />
to<br />
54<br />
55<br />
><br />
0<br />
to<br />
20<br />
1865<br />
21<br />
to<br />
27<br />
45<br />
28<br />
to<br />
39<br />
40<br />
to<br />
49<br />
Chart 2<br />
50<br />
to<br />
59<br />
45 6 2 0 0 0<br />
60<br />
to<br />
69<br />
70<br />
to<br />
79<br />
80<br />
><br />
Most of <strong>the</strong> vehicles classified during <strong>the</strong> study were Passenger Cars. The number of Passenger Cars<br />
in <strong>the</strong> study was 1,910 which represents 97.30 percent of <strong>the</strong> total classified vehicles. The number of<br />
Small Trucks in <strong>the</strong> study was 45 which represents 2.30 percent of <strong>the</strong> total classified vehicles. The<br />
number of Trucks/Buses in <strong>the</strong> study was 6 which represents 0.30 percent of <strong>the</strong> total classified<br />
vehicles. The number of Tractor Trailers in <strong>the</strong> study was 2 which represents 0.10 percent of <strong>the</strong> total<br />
classified vehicles.<br />
HEADWAY<br />
During <strong>the</strong> peak time period, on 02/28/2008 at 07:45 AM <strong>the</strong> average headway between <strong>the</strong> vehicles<br />
was 23.68 seconds. The slowest traffic period was on 02/26/2008 at 12:00 AM. During this slowest<br />
period, <strong>the</strong> average headway was 900.0 seconds.<br />
WEATHER<br />
The roadway surface temperature over <strong>the</strong> period of <strong>the</strong> study varied between 29 and 64 degrees<br />
Fahrenheit. The HI-STAR determined that <strong>the</strong> roadway surface was Dry 100.00 percent of <strong>the</strong> time.<br />
03/03/2008<br />
Page:<br />
1
Nu-Metrics Traffic Analyzer Study<br />
Computer Generated Summary Report<br />
City: Charlottesville<br />
Street: Gentry Ln @ 1443<br />
A study of vehicle traffic was conducted with HI-STAR unit number 2891. The study was done in <strong>the</strong><br />
SB lane on Gentry Ln @ 1443 in Charlottesville, VA in /_near Albemarle county. The study began on<br />
02/26/2008 at 12:00 AM and concluded on 02/29/2008 at 12:00 AM, lasting a total of 72 hours. Data<br />
was recorded in 15 minute time periods. The total recorded volume of traffic showed 1,172 vehicles<br />
passed through <strong>the</strong> location with a peak volume of 29 on 02/26/2008 at 03:30 PM and a minimum<br />
volume of 0 on 02/26/2008 at 12:00 AM. The AADT Count <strong>for</strong> this study was 391.<br />
SPEED<br />
Chart 1 lists <strong>the</strong> values of <strong>the</strong> speed bins and <strong>the</strong> total traffic volume <strong>for</strong> each bin.<br />
0<br />
to<br />
9<br />
10<br />
to<br />
14<br />
15<br />
to<br />
19<br />
20<br />
to<br />
24<br />
25<br />
to<br />
29<br />
30<br />
to<br />
34<br />
35<br />
to<br />
39<br />
Chart 1<br />
40<br />
to<br />
44<br />
0 41 220 524 238 59 32 12 11 4 21 0 0 0 0<br />
At least half of <strong>the</strong> vehicles were traveling in <strong>the</strong> 20 - 24 mph range or a lower speed. The average<br />
speed <strong>for</strong> all classified vehicles was 24 mph with 32.4 percent exceeding <strong>the</strong> posted speed of 25 mph.<br />
The HI-STAR found 1.81 percent of <strong>the</strong> total vehicles were traveling in excess of 55 mph. The mode<br />
speed <strong>for</strong> this traffic study was 20 mph and <strong>the</strong> 85th percentile was 29.26 mph.<br />
CLASSIFICATION<br />
Chart 2 lists <strong>the</strong> values of <strong>the</strong> eight classification bins and <strong>the</strong> total traffic volume accumulated <strong>for</strong> each<br />
bin.<br />
45<br />
to<br />
49<br />
50<br />
to<br />
54<br />
55<br />
><br />
0<br />
to<br />
20<br />
1095<br />
21<br />
to<br />
27<br />
46<br />
28<br />
to<br />
39<br />
40<br />
to<br />
49<br />
Chart 2<br />
50<br />
to<br />
59<br />
17 2 1 1 0 0<br />
60<br />
to<br />
69<br />
70<br />
to<br />
79<br />
80<br />
><br />
Most of <strong>the</strong> vehicles classified during <strong>the</strong> study were Passenger Cars. The number of Passenger Cars<br />
in <strong>the</strong> study was 1,141 which represents 98.20 percent of <strong>the</strong> total classified vehicles. The number of<br />
Small Trucks in <strong>the</strong> study was 17 which represents 1.50 percent of <strong>the</strong> total classified vehicles. The<br />
number of Trucks/Buses in <strong>the</strong> study was 2 which represents 0.20 percent of <strong>the</strong> total classified<br />
vehicles. The number of Tractor Trailers in <strong>the</strong> study was 2 which represents 0.20 percent of <strong>the</strong> total<br />
classified vehicles.<br />
HEADWAY<br />
During <strong>the</strong> peak time period, on 02/26/2008 at 03:30 PM <strong>the</strong> average headway between <strong>the</strong> vehicles<br />
was 30.0 seconds. The slowest traffic period was on 02/26/2008 at 12:00 AM. During this slowest<br />
period, <strong>the</strong> average headway was 900.0 seconds.<br />
WEATHER<br />
The roadway surface temperature over <strong>the</strong> period of <strong>the</strong> study varied between 29 and 68 degrees<br />
Fahrenheit. The HI-STAR determined that <strong>the</strong> roadway surface was Dry 95.83 percent of <strong>the</strong> time.<br />
03/03/2008<br />
Page:<br />
1
Nu-Metrics Traffic Analyzer Study<br />
Computer Generated Summary Report<br />
City: Charlottesville<br />
Street: <strong>Greenleaf</strong> Ln @ 1611<br />
A study of vehicle traffic was conducted with HI-STAR unit number 4427. The study was done in <strong>the</strong><br />
EB lane on <strong>Greenleaf</strong> Ln @ 1611 in Charlottesville, VA in /_near Albemarle county. The study began<br />
on 02/12/2008 at 12:00 AM and concluded on 02/15/2008 at 12:00 AM, lasting a total of 72 hours.<br />
Data was recorded in 15 minute time periods. The total recorded volume of traffic showed 807<br />
vehicles passed through <strong>the</strong> location with a peak volume of 28 on 02/12/2008 at 06:00 PM and a<br />
minimum volume of 0 on 02/12/2008 at 12:00 AM. The AADT Count <strong>for</strong> this study was 269.<br />
SPEED<br />
Chart 1 lists <strong>the</strong> values of <strong>the</strong> speed bins and <strong>the</strong> total traffic volume <strong>for</strong> each bin.<br />
0<br />
to<br />
9<br />
10<br />
to<br />
14<br />
15<br />
to<br />
19<br />
20<br />
to<br />
24<br />
25<br />
to<br />
29<br />
30<br />
to<br />
34<br />
35<br />
to<br />
39<br />
Chart 1<br />
40<br />
to<br />
44<br />
0 38 304 316 74 27 15 7 7 1 9 0 0 0 0<br />
At least half of <strong>the</strong> vehicles were traveling in <strong>the</strong> 20 - 24 mph range or a lower speed. The average<br />
speed <strong>for</strong> all classified vehicles was 22 mph with 17.5 percent exceeding <strong>the</strong> posted speed of 25 mph.<br />
The HI-STAR found 1.13 percent of <strong>the</strong> total vehicles were traveling in excess of 55 mph. The mode<br />
speed <strong>for</strong> this traffic study was 20 mph and <strong>the</strong> 85th percentile was 26.37 mph.<br />
CLASSIFICATION<br />
Chart 2 lists <strong>the</strong> values of <strong>the</strong> eight classification bins and <strong>the</strong> total traffic volume accumulated <strong>for</strong> each<br />
bin.<br />
45<br />
to<br />
49<br />
50<br />
to<br />
54<br />
55<br />
><br />
0<br />
to<br />
20<br />
727<br />
21<br />
to<br />
27<br />
47<br />
28<br />
to<br />
39<br />
40<br />
to<br />
49<br />
Chart 2<br />
50<br />
to<br />
59<br />
24 0 0 0 0 0<br />
60<br />
to<br />
69<br />
70<br />
to<br />
79<br />
80<br />
><br />
Most of <strong>the</strong> vehicles classified during <strong>the</strong> study were Passenger Cars. The number of Passenger Cars<br />
in <strong>the</strong> study was 774 which represents 97.00 percent of <strong>the</strong> total classified vehicles. The number of<br />
Small Trucks in <strong>the</strong> study was 24 which represents 3.00 percent of <strong>the</strong> total classified vehicles. The<br />
number of Trucks/Buses in <strong>the</strong> study was 0 which represents 0.00 percent of <strong>the</strong> total classified<br />
vehicles. The number of Tractor Trailers in <strong>the</strong> study was 0 which represents 0.00 percent of <strong>the</strong> total<br />
classified vehicles.<br />
HEADWAY<br />
During <strong>the</strong> peak time period, on 02/12/2008 at 06:00 PM <strong>the</strong> average headway between <strong>the</strong> vehicles<br />
was 31.03 seconds. The slowest traffic period was on 02/12/2008 at 12:00 AM. During this slowest<br />
period, <strong>the</strong> average headway was 900.0 seconds.<br />
WEATHER<br />
The roadway surface temperature over <strong>the</strong> period of <strong>the</strong> study varied between 29 and 52 degrees<br />
Fahrenheit. The HI-STAR determined that <strong>the</strong> roadway surface was Dry 99.31 percent of <strong>the</strong> time.<br />
02/15/2008<br />
Page:<br />
1
Nu-Metrics Traffic Analyzer Study<br />
Computer Generated Summary Report<br />
City: Charlottesville<br />
Street: <strong>Greenleaf</strong> Ln @ 1611<br />
A study of vehicle traffic was conducted with HI-STAR unit number 4159. The study was done in <strong>the</strong><br />
WB lane on <strong>Greenleaf</strong> Ln @ 1611 in Charlottesville, VA in /_near Albemarle county. The study began<br />
on 02/12/2008 at 12:00 AM and concluded on 02/15/2008 at 12:00 AM, lasting a total of 72 hours.<br />
Data was recorded in 15 minute time periods. The total recorded volume of traffic showed 182<br />
vehicles passed through <strong>the</strong> location with a peak volume of 7 on 02/13/2008 at 04:15 PM and a<br />
minimum volume of 0 on 02/12/2008 at 12:00 AM. The AADT Count <strong>for</strong> this study was 61.<br />
SPEED<br />
Chart 1 lists <strong>the</strong> values of <strong>the</strong> speed bins and <strong>the</strong> total traffic volume <strong>for</strong> each bin.<br />
0<br />
to<br />
9<br />
10<br />
to<br />
14<br />
15<br />
to<br />
19<br />
20<br />
to<br />
24<br />
25<br />
to<br />
29<br />
30<br />
to<br />
34<br />
35<br />
to<br />
39<br />
Chart 1<br />
40<br />
to<br />
44<br />
0 20 48 50 31 11 2 6 3 3 3 0 0 0 0<br />
At least half of <strong>the</strong> vehicles were traveling in <strong>the</strong> 20 - 24 mph range or a lower speed. The average<br />
speed <strong>for</strong> all classified vehicles was 23 mph with 33.3 percent exceeding <strong>the</strong> posted speed of 25 mph.<br />
The HI-STAR found 1.69 percent of <strong>the</strong> total vehicles were traveling in excess of 55 mph. The mode<br />
speed <strong>for</strong> this traffic study was 20 mph and <strong>the</strong> 85th percentile was 30.66 mph.<br />
CLASSIFICATION<br />
Chart 2 lists <strong>the</strong> values of <strong>the</strong> eight classification bins and <strong>the</strong> total traffic volume accumulated <strong>for</strong> each<br />
bin.<br />
45<br />
to<br />
49<br />
50<br />
to<br />
54<br />
55<br />
><br />
0<br />
to<br />
20<br />
163<br />
21<br />
to<br />
27<br />
10<br />
28<br />
to<br />
39<br />
40<br />
to<br />
49<br />
Chart 2<br />
50<br />
to<br />
59<br />
3 0 1 0 0 0<br />
60<br />
to<br />
69<br />
70<br />
to<br />
79<br />
80<br />
><br />
Most of <strong>the</strong> vehicles classified during <strong>the</strong> study were Passenger Cars. The number of Passenger Cars<br />
in <strong>the</strong> study was 173 which represents 97.70 percent of <strong>the</strong> total classified vehicles. The number of<br />
Small Trucks in <strong>the</strong> study was 3 which represents 1.70 percent of <strong>the</strong> total classified vehicles. The<br />
number of Trucks/Buses in <strong>the</strong> study was 0 which represents 0.00 percent of <strong>the</strong> total classified<br />
vehicles. The number of Tractor Trailers in <strong>the</strong> study was 1 which represents 0.60 percent of <strong>the</strong> total<br />
classified vehicles.<br />
HEADWAY<br />
During <strong>the</strong> peak time period, on 02/13/2008 at 04:15 PM <strong>the</strong> average headway between <strong>the</strong> vehicles<br />
was 112.5 seconds. The slowest traffic period was on 02/12/2008 at 12:00 AM. During this slowest<br />
period, <strong>the</strong> average headway was 900.0 seconds.<br />
WEATHER<br />
The roadway surface temperature over <strong>the</strong> period of <strong>the</strong> study varied between 31 and 68 degrees<br />
Fahrenheit. The HI-STAR determined that <strong>the</strong> roadway surface was Dry 100.00 percent of <strong>the</strong> time.<br />
02/15/2008<br />
Page:<br />
1
Nu-Metrics Traffic Analyzer Study<br />
Computer Generated Summary Report<br />
City: Charlottesville<br />
Street: Ox<strong>for</strong>d Rd @ 1627<br />
A study of vehicle traffic was conducted with HI-STAR unit number 2620. The study was done in <strong>the</strong><br />
EB lane on Ox<strong>for</strong>d Rd @ 1627 in Charlottesville, VA in /_near Albemarle county. The study began on<br />
02/12/2008 at 12:00 AM and concluded on 02/15/2008 at 12:00 AM, lasting a total of 72 hours. Data<br />
was recorded in 15 minute time periods. The total recorded volume of traffic showed 359 vehicles<br />
passed through <strong>the</strong> location with a peak volume of 7 on 02/12/2008 at 02:00 PM and a minimum<br />
volume of 0 on 02/12/2008 at 12:00 AM. The AADT Count <strong>for</strong> this study was 120.<br />
SPEED<br />
Chart 1 lists <strong>the</strong> values of <strong>the</strong> speed bins and <strong>the</strong> total traffic volume <strong>for</strong> each bin.<br />
0<br />
to<br />
9<br />
10<br />
to<br />
14<br />
15<br />
to<br />
19<br />
20<br />
to<br />
24<br />
25<br />
to<br />
29<br />
30<br />
to<br />
34<br />
35<br />
to<br />
39<br />
Chart 1<br />
40<br />
to<br />
44<br />
0 10 96 98 97 31 8 3 2 0 8 0 0 0 0<br />
At least half of <strong>the</strong> vehicles were traveling in <strong>the</strong> 20 - 24 mph range or a lower speed. The average<br />
speed <strong>for</strong> all classified vehicles was 24 mph with 42.2 percent exceeding <strong>the</strong> posted speed of 25 mph.<br />
The HI-STAR found 2.27 percent of <strong>the</strong> total vehicles were traveling in excess of 55 mph. The mode<br />
speed <strong>for</strong> this traffic study was 20 mph and <strong>the</strong> 85th percentile was 29.95 mph.<br />
CLASSIFICATION<br />
Chart 2 lists <strong>the</strong> values of <strong>the</strong> eight classification bins and <strong>the</strong> total traffic volume accumulated <strong>for</strong> each<br />
bin.<br />
45<br />
to<br />
49<br />
50<br />
to<br />
54<br />
55<br />
><br />
0<br />
to<br />
20<br />
332<br />
21<br />
to<br />
27<br />
13<br />
28<br />
to<br />
39<br />
40<br />
to<br />
49<br />
Chart 2<br />
50<br />
to<br />
59<br />
4 3 1 0 0 0<br />
60<br />
to<br />
69<br />
70<br />
to<br />
79<br />
80<br />
><br />
Most of <strong>the</strong> vehicles classified during <strong>the</strong> study were Passenger Cars. The number of Passenger Cars<br />
in <strong>the</strong> study was 345 which represents 97.70 percent of <strong>the</strong> total classified vehicles. The number of<br />
Small Trucks in <strong>the</strong> study was 4 which represents 1.10 percent of <strong>the</strong> total classified vehicles. The<br />
number of Trucks/Buses in <strong>the</strong> study was 3 which represents 0.80 percent of <strong>the</strong> total classified<br />
vehicles. The number of Tractor Trailers in <strong>the</strong> study was 1 which represents 0.30 percent of <strong>the</strong> total<br />
classified vehicles.<br />
HEADWAY<br />
During <strong>the</strong> peak time period, on 02/12/2008 at 02:00 PM <strong>the</strong> average headway between <strong>the</strong> vehicles<br />
was 112.5 seconds. The slowest traffic period was on 02/12/2008 at 12:00 AM. During this slowest<br />
period, <strong>the</strong> average headway was 900.0 seconds.<br />
WEATHER<br />
The roadway surface temperature over <strong>the</strong> period of <strong>the</strong> study varied between 31 and 58 degrees<br />
Fahrenheit. The HI-STAR determined that <strong>the</strong> roadway surface was Dry 100.00 percent of <strong>the</strong> time.<br />
02/15/2008<br />
Page:<br />
1
Nu-Metrics Traffic Analyzer Study<br />
Computer Generated Summary Report<br />
City: Charlottesville<br />
Street: Ox<strong>for</strong>d Rd @ 1627<br />
A study of vehicle traffic was conducted with HI-STAR unit number 2212. The study was done in <strong>the</strong><br />
WB lane on Ox<strong>for</strong>d Rd @ 1627 in Charlottesville, VA in /_near Albemarle county. The study began on<br />
02/12/2008 at 12:00 AM and concluded on 02/15/2008 at 12:00 AM, lasting a total of 72 hours. Data<br />
was recorded in 15 minute time periods. The total recorded volume of traffic showed 652 vehicles<br />
passed through <strong>the</strong> location with a peak volume of 12 on 02/13/2008 at 05:30 PM and a minimum<br />
volume of 0 on 02/12/2008 at 12:15 AM. The AADT Count <strong>for</strong> this study was 217.<br />
SPEED<br />
Chart 1 lists <strong>the</strong> values of <strong>the</strong> speed bins and <strong>the</strong> total traffic volume <strong>for</strong> each bin.<br />
0<br />
to<br />
9<br />
10<br />
to<br />
14<br />
15<br />
to<br />
19<br />
20<br />
to<br />
24<br />
25<br />
to<br />
29<br />
30<br />
to<br />
34<br />
35<br />
to<br />
39<br />
Chart 1<br />
40<br />
to<br />
44<br />
0 32 126 219 154 49 25 12 6 6 14 0 0 0 0<br />
At least half of <strong>the</strong> vehicles were traveling in <strong>the</strong> 20 - 24 mph range or a lower speed. The average<br />
speed <strong>for</strong> all classified vehicles was 25 mph with 41.3 percent exceeding <strong>the</strong> posted speed of 25 mph.<br />
The HI-STAR found 2.18 percent of <strong>the</strong> total vehicles were traveling in excess of 55 mph. The mode<br />
speed <strong>for</strong> this traffic study was 20 mph and <strong>the</strong> 85th percentile was 31.59 mph.<br />
CLASSIFICATION<br />
Chart 2 lists <strong>the</strong> values of <strong>the</strong> eight classification bins and <strong>the</strong> total traffic volume accumulated <strong>for</strong> each<br />
bin.<br />
45<br />
to<br />
49<br />
50<br />
to<br />
54<br />
55<br />
><br />
0<br />
to<br />
20<br />
610<br />
21<br />
to<br />
27<br />
22<br />
28<br />
to<br />
39<br />
40<br />
to<br />
49<br />
Chart 2<br />
50<br />
to<br />
59<br />
8 2 1 0 0 0<br />
60<br />
to<br />
69<br />
70<br />
to<br />
79<br />
80<br />
><br />
Most of <strong>the</strong> vehicles classified during <strong>the</strong> study were Passenger Cars. The number of Passenger Cars<br />
in <strong>the</strong> study was 632 which represents 98.30 percent of <strong>the</strong> total classified vehicles. The number of<br />
Small Trucks in <strong>the</strong> study was 8 which represents 1.20 percent of <strong>the</strong> total classified vehicles. The<br />
number of Trucks/Buses in <strong>the</strong> study was 2 which represents 0.30 percent of <strong>the</strong> total classified<br />
vehicles. The number of Tractor Trailers in <strong>the</strong> study was 1 which represents 0.20 percent of <strong>the</strong> total<br />
classified vehicles.<br />
HEADWAY<br />
During <strong>the</strong> peak time period, on 02/13/2008 at 05:30 PM <strong>the</strong> average headway between <strong>the</strong> vehicles<br />
was 69.23 seconds. The slowest traffic period was on 02/12/2008 at 12:15 AM. During this slowest<br />
period, <strong>the</strong> average headway was 900.0 seconds.<br />
WEATHER<br />
The roadway surface temperature over <strong>the</strong> period of <strong>the</strong> study varied between 31 and 52 degrees<br />
Fahrenheit. The HI-STAR determined that <strong>the</strong> roadway surface was Dry 86.11 percent of <strong>the</strong> time.<br />
02/15/2008<br />
Page:<br />
1
Nu-Metrics Traffic Analyzer Study<br />
Computer Generated Summary Report<br />
City: Charlottesville<br />
Street: Rose Hill Dr @ 1602<br />
A study of vehicle traffic was conducted with HI-STAR unit number 2275. The study was done in <strong>the</strong><br />
NB lane on Rose Hill Dr @ 1602 in Charlottesville, VA in /_near Albemarle county. The study began on<br />
02/26/2008 at 12:00 AM and concluded on 02/29/2008 at 12:00 AM, lasting a total of 72 hours. Data<br />
was recorded in 15 minute time periods. The total recorded volume of traffic showed 2,018 vehicles<br />
passed through <strong>the</strong> location with a peak volume of 47 on 02/26/2008 at 07:45 AM and a minimum<br />
volume of 0 on 02/26/2008 at 12:30 AM. The AADT Count <strong>for</strong> this study was 673.<br />
SPEED<br />
Chart 1 lists <strong>the</strong> values of <strong>the</strong> speed bins and <strong>the</strong> total traffic volume <strong>for</strong> each bin.<br />
0<br />
to<br />
9<br />
10<br />
to<br />
14<br />
15<br />
to<br />
19<br />
20<br />
to<br />
24<br />
25<br />
to<br />
29<br />
30<br />
to<br />
34<br />
35<br />
to<br />
39<br />
Chart 1<br />
40<br />
to<br />
44<br />
0 14 84 360 880 480 135 27 14 7 13 0 0 0 0<br />
At least half of <strong>the</strong> vehicles were traveling in <strong>the</strong> 25 - 29 mph range or a lower speed. The average<br />
speed <strong>for</strong> all classified vehicles was 28 mph with 77.2 percent exceeding <strong>the</strong> posted speed of 25 mph.<br />
The HI-STAR found 0.65 percent of <strong>the</strong> total vehicles were traveling in excess of 55 mph. The mode<br />
speed <strong>for</strong> this traffic study was 25 mph and <strong>the</strong> 85th percentile was 33.89 mph.<br />
CLASSIFICATION<br />
Chart 2 lists <strong>the</strong> values of <strong>the</strong> eight classification bins and <strong>the</strong> total traffic volume accumulated <strong>for</strong> each<br />
bin.<br />
45<br />
to<br />
49<br />
50<br />
to<br />
54<br />
55<br />
><br />
0<br />
to<br />
20<br />
1836<br />
21<br />
to<br />
27<br />
73<br />
28<br />
to<br />
39<br />
40<br />
to<br />
49<br />
Chart 2<br />
50<br />
to<br />
59<br />
96 9 0 0 0 0<br />
60<br />
to<br />
69<br />
70<br />
to<br />
79<br />
80<br />
><br />
Most of <strong>the</strong> vehicles classified during <strong>the</strong> study were Passenger Cars. The number of Passenger Cars<br />
in <strong>the</strong> study was 1,909 which represents 94.80 percent of <strong>the</strong> total classified vehicles. The number of<br />
Small Trucks in <strong>the</strong> study was 96 which represents 4.80 percent of <strong>the</strong> total classified vehicles. The<br />
number of Trucks/Buses in <strong>the</strong> study was 9 which represents 0.40 percent of <strong>the</strong> total classified<br />
vehicles. The number of Tractor Trailers in <strong>the</strong> study was 0 which represents 0.00 percent of <strong>the</strong> total<br />
classified vehicles.<br />
HEADWAY<br />
During <strong>the</strong> peak time period, on 02/26/2008 at 07:45 AM <strong>the</strong> average headway between <strong>the</strong> vehicles<br />
was 18.75 seconds. The slowest traffic period was on 02/26/2008 at 12:30 AM. During this slowest<br />
period, <strong>the</strong> average headway was 900.0 seconds.<br />
WEATHER<br />
The roadway surface temperature over <strong>the</strong> period of <strong>the</strong> study varied between 29 and 74 degrees<br />
Fahrenheit. The HI-STAR determined that <strong>the</strong> roadway surface was Dry 100.00 percent of <strong>the</strong> time.<br />
03/03/2008<br />
Page:<br />
1
Nu-Metrics Traffic Analyzer Study<br />
Computer Generated Summary Report<br />
City: Charlottesville<br />
Street: Rose Hill Dr @ 1602<br />
A study of vehicle traffic was conducted with HI-STAR unit number 2873. The study was done in <strong>the</strong><br />
SB lane on Rose Hill Dr @ 1602 in Charlottesville, VA in /_near Albemarle county. The study began on<br />
02/26/2008 at 12:00 AM and concluded on 02/29/2008 at 12:00 AM, lasting a total of 72 hours. Data<br />
was recorded in 15 minute time periods. The total recorded volume of traffic showed 1,345 vehicles<br />
passed through <strong>the</strong> location with a peak volume of 44 on 02/27/2008 at 02:30 PM and a minimum<br />
volume of 0 on 02/26/2008 at 12:00 AM. The AADT Count <strong>for</strong> this study was 448.<br />
SPEED<br />
Chart 1 lists <strong>the</strong> values of <strong>the</strong> speed bins and <strong>the</strong> total traffic volume <strong>for</strong> each bin.<br />
0<br />
to<br />
9<br />
10<br />
to<br />
14<br />
15<br />
to<br />
19<br />
20<br />
to<br />
24<br />
25<br />
to<br />
29<br />
30<br />
to<br />
34<br />
35<br />
to<br />
39<br />
Chart 1<br />
40<br />
to<br />
44<br />
0 12 106 387 520 222 63 14 4 3 8 0 0 0 0<br />
At least half of <strong>the</strong> vehicles were traveling in <strong>the</strong> 25 - 29 mph range or a lower speed. The average<br />
speed <strong>for</strong> all classified vehicles was 27 mph with 62.2 percent exceeding <strong>the</strong> posted speed of 25 mph.<br />
The HI-STAR found 0.60 percent of <strong>the</strong> total vehicles were traveling in excess of 55 mph. The mode<br />
speed <strong>for</strong> this traffic study was 25 mph and <strong>the</strong> 85th percentile was 32.55 mph.<br />
CLASSIFICATION<br />
Chart 2 lists <strong>the</strong> values of <strong>the</strong> eight classification bins and <strong>the</strong> total traffic volume accumulated <strong>for</strong> each<br />
bin.<br />
45<br />
to<br />
49<br />
50<br />
to<br />
54<br />
55<br />
><br />
0<br />
to<br />
20<br />
1294<br />
21<br />
to<br />
27<br />
24<br />
28<br />
to<br />
39<br />
40<br />
to<br />
49<br />
Chart 2<br />
50<br />
to<br />
59<br />
19 2 0 0 0 0<br />
60<br />
to<br />
69<br />
70<br />
to<br />
79<br />
80<br />
><br />
Most of <strong>the</strong> vehicles classified during <strong>the</strong> study were Passenger Cars. The number of Passenger Cars<br />
in <strong>the</strong> study was 1,318 which represents 98.40 percent of <strong>the</strong> total classified vehicles. The number of<br />
Small Trucks in <strong>the</strong> study was 19 which represents 1.40 percent of <strong>the</strong> total classified vehicles. The<br />
number of Trucks/Buses in <strong>the</strong> study was 2 which represents 0.10 percent of <strong>the</strong> total classified<br />
vehicles. The number of Tractor Trailers in <strong>the</strong> study was 0 which represents 0.00 percent of <strong>the</strong> total<br />
classified vehicles.<br />
HEADWAY<br />
During <strong>the</strong> peak time period, on 02/27/2008 at 02:30 PM <strong>the</strong> average headway between <strong>the</strong> vehicles<br />
was 20.0 seconds. The slowest traffic period was on 02/26/2008 at 12:00 AM. During this slowest<br />
period, <strong>the</strong> average headway was 900.0 seconds.<br />
WEATHER<br />
The roadway surface temperature over <strong>the</strong> period of <strong>the</strong> study varied between 29 and 70 degrees<br />
Fahrenheit. The HI-STAR determined that <strong>the</strong> roadway surface was Dry 93.06 percent of <strong>the</strong> time.<br />
03/03/2008<br />
Page:<br />
1
Nu-Metrics Traffic Analyzer Study<br />
Computer Generated Summary Report<br />
City: Charlottesville<br />
Street: Rose Hill Dr btw Rutledge&Ox<strong>for</strong>d<br />
A study of vehicle traffic was conducted with HI-STAR unit number 2212. The study was done in <strong>the</strong><br />
SB lane on Rose Hill Dr btw Rutledge&Ox<strong>for</strong>d in Charlottesville, VA in /_near Albemarle county. The<br />
study began on 02/26/2008 at 12:00 AM and concluded on 02/29/2008 at 12:00 AM, lasting a total of<br />
72 hours. Data was recorded in 15 minute time periods. The total recorded volume of traffic showed<br />
2,352 vehicles passed through <strong>the</strong> location with a peak volume of 52 on 02/27/2008 at 07:45 AM and a<br />
minimum volume of 0 on 02/26/2008 at 12:15 AM. The AADT Count <strong>for</strong> this study was 784.<br />
SPEED<br />
Chart 1 lists <strong>the</strong> values of <strong>the</strong> speed bins and <strong>the</strong> total traffic volume <strong>for</strong> each bin.<br />
0<br />
to<br />
9<br />
10<br />
to<br />
14<br />
15<br />
to<br />
19<br />
20<br />
to<br />
24<br />
25<br />
to<br />
29<br />
30<br />
to<br />
34<br />
35<br />
to<br />
39<br />
Chart 1<br />
40<br />
to<br />
44<br />
0 39 391 1146 597 114 21 11 7 5 7 0 0 0 0<br />
At least half of <strong>the</strong> vehicles were traveling in <strong>the</strong> 20 - 24 mph range or a lower speed. The average<br />
speed <strong>for</strong> all classified vehicles was 24 mph with 32.5 percent exceeding <strong>the</strong> posted speed of 25 mph.<br />
The HI-STAR found 0.30 percent of <strong>the</strong> total vehicles were traveling in excess of 55 mph. The mode<br />
speed <strong>for</strong> this traffic study was 20 mph and <strong>the</strong> 85th percentile was 28.44 mph.<br />
CLASSIFICATION<br />
Chart 2 lists <strong>the</strong> values of <strong>the</strong> eight classification bins and <strong>the</strong> total traffic volume accumulated <strong>for</strong> each<br />
bin.<br />
45<br />
to<br />
49<br />
50<br />
to<br />
54<br />
55<br />
><br />
0<br />
to<br />
20<br />
2242<br />
21<br />
to<br />
27<br />
62<br />
28<br />
to<br />
39<br />
40<br />
to<br />
49<br />
Chart 2<br />
50<br />
to<br />
59<br />
28 5 1 0 0 0<br />
60<br />
to<br />
69<br />
70<br />
to<br />
79<br />
80<br />
><br />
Most of <strong>the</strong> vehicles classified during <strong>the</strong> study were Passenger Cars. The number of Passenger Cars<br />
in <strong>the</strong> study was 2,304 which represents 98.50 percent of <strong>the</strong> total classified vehicles. The number of<br />
Small Trucks in <strong>the</strong> study was 28 which represents 1.20 percent of <strong>the</strong> total classified vehicles. The<br />
number of Trucks/Buses in <strong>the</strong> study was 5 which represents 0.20 percent of <strong>the</strong> total classified<br />
vehicles. The number of Tractor Trailers in <strong>the</strong> study was 1 which represents 0.00 percent of <strong>the</strong> total<br />
classified vehicles.<br />
HEADWAY<br />
During <strong>the</strong> peak time period, on 02/27/2008 at 07:45 AM <strong>the</strong> average headway between <strong>the</strong> vehicles<br />
was 16.98 seconds. The slowest traffic period was on 02/26/2008 at 12:15 AM. During this slowest<br />
period, <strong>the</strong> average headway was 900.0 seconds.<br />
WEATHER<br />
The roadway surface temperature over <strong>the</strong> period of <strong>the</strong> study varied between 27 and 62 degrees<br />
Fahrenheit. The HI-STAR determined that <strong>the</strong> roadway surface was Dry 99.31 percent of <strong>the</strong> time.<br />
03/03/2008<br />
Page:<br />
1
Nu-Metrics Traffic Analyzer Study<br />
Computer Generated Summary Report<br />
City: Charlottesville<br />
Street: Rugby Ave just N of Winston Rd<br />
A study of vehicle traffic was conducted with HI-STAR unit number 4159. The study was done in <strong>the</strong><br />
NB lane on Rugby Ave just N of Winston Rd in Charlottesville, VA in /_near Albemarle county. The<br />
study began on 11/27/2007 at 12:00 AM and concluded on 11/30/2007 at 12:00 AM, lasting a total of<br />
72 hours. Data was recorded in 15 minute time periods. The total recorded volume of traffic showed<br />
8,686 vehicles passed through <strong>the</strong> location with a peak volume of 93 on 11/27/2007 at 05:15 PM and a<br />
minimum volume of 0 on 11/27/2007 at 03:45 AM. The AADT Count <strong>for</strong> this study was 2,895.<br />
SPEED<br />
Chart 1 lists <strong>the</strong> values of <strong>the</strong> speed bins and <strong>the</strong> total traffic volume <strong>for</strong> each bin.<br />
0<br />
to<br />
9<br />
10<br />
to<br />
14<br />
15<br />
to<br />
19<br />
20<br />
to<br />
24<br />
25<br />
to<br />
29<br />
30<br />
to<br />
34<br />
35<br />
to<br />
39<br />
Chart 1<br />
40<br />
to<br />
44<br />
0 89 702 1353 3320 2377 635 141 29 12 19 0 0 0 0<br />
At least half of <strong>the</strong> vehicles were traveling in <strong>the</strong> 25 - 29 mph range or a lower speed. The average<br />
speed <strong>for</strong> all classified vehicles was 28 mph with 75.2 percent exceeding <strong>the</strong> posted speed of 25 mph.<br />
The HI-STAR found 0.22 percent of <strong>the</strong> total vehicles were traveling in excess of 55 mph. The mode<br />
speed <strong>for</strong> this traffic study was 25 mph and <strong>the</strong> 85th percentile was 34.02 mph.<br />
CLASSIFICATION<br />
Chart 2 lists <strong>the</strong> values of <strong>the</strong> eight classification bins and <strong>the</strong> total traffic volume accumulated <strong>for</strong> each<br />
bin.<br />
45<br />
to<br />
49<br />
50<br />
to<br />
54<br />
55<br />
><br />
0<br />
to<br />
20<br />
8487<br />
21<br />
to<br />
27<br />
142<br />
28<br />
to<br />
39<br />
40<br />
to<br />
49<br />
Chart 2<br />
50<br />
to<br />
59<br />
36 11 0 1 0 0<br />
60<br />
to<br />
69<br />
70<br />
to<br />
79<br />
80<br />
><br />
Most of <strong>the</strong> vehicles classified during <strong>the</strong> study were Passenger Cars. The number of Passenger Cars<br />
in <strong>the</strong> study was 8,629 which represents 99.40 percent of <strong>the</strong> total classified vehicles. The number of<br />
Small Trucks in <strong>the</strong> study was 36 which represents 0.40 percent of <strong>the</strong> total classified vehicles. The<br />
number of Trucks/Buses in <strong>the</strong> study was 11 which represents 0.10 percent of <strong>the</strong> total classified<br />
vehicles. The number of Tractor Trailers in <strong>the</strong> study was 1 which represents 0.00 percent of <strong>the</strong> total<br />
classified vehicles.<br />
HEADWAY<br />
During <strong>the</strong> peak time period, on 11/27/2007 at 05:15 PM <strong>the</strong> average headway between <strong>the</strong> vehicles<br />
was 9.57 seconds. The slowest traffic period was on 11/27/2007 at 03:45 AM. During this slowest<br />
period, <strong>the</strong> average headway was 900.0 seconds.<br />
WEATHER<br />
The roadway surface temperature over <strong>the</strong> period of <strong>the</strong> study varied between 41 and 58 degrees<br />
Fahrenheit. The HI-STAR determined that <strong>the</strong> roadway surface was Dry 100.00 percent of <strong>the</strong> time.<br />
12/03/2007<br />
Page:<br />
1
Nu-Metrics Traffic Analyzer Study<br />
Computer Generated Summary Report<br />
City: Charlottesville<br />
Street: Rugby Ave just N of Winston Rd<br />
A study of vehicle traffic was conducted with HI-STAR unit number 4427. The study was done in <strong>the</strong><br />
SB lane on Rugby Ave just N of Winston Rd in Charlottesville, VA in /_near Albemarle county. The<br />
study began on 11/27/2007 at 12:00 AM and concluded on 11/30/2007 at 12:00 AM, lasting a total of<br />
72 hours. Data was recorded in 15 minute time periods. The total recorded volume of traffic showed<br />
8,069 vehicles passed through <strong>the</strong> location with a peak volume of 71 on 11/29/2007 at 08:30 AM and a<br />
minimum volume of 0 on 11/27/2007 at 01:00 AM. The AADT Count <strong>for</strong> this study was 2,690.<br />
SPEED<br />
Chart 1 lists <strong>the</strong> values of <strong>the</strong> speed bins and <strong>the</strong> total traffic volume <strong>for</strong> each bin.<br />
0<br />
to<br />
9<br />
10<br />
to<br />
14<br />
15<br />
to<br />
19<br />
20<br />
to<br />
24<br />
25<br />
to<br />
29<br />
30<br />
to<br />
34<br />
35<br />
to<br />
39<br />
Chart 1<br />
40<br />
to<br />
44<br />
0 231 855 1741 3144 1557 390 75 22 12 32 0 0 0 0<br />
At least half of <strong>the</strong> vehicles were traveling in <strong>the</strong> 25 - 29 mph range or a lower speed. The average<br />
speed <strong>for</strong> all classified vehicles was 27 mph with 64.9 percent exceeding <strong>the</strong> posted speed of 25 mph.<br />
The HI-STAR found 0.40 percent of <strong>the</strong> total vehicles were traveling in excess of 55 mph. The mode<br />
speed <strong>for</strong> this traffic study was 25 mph and <strong>the</strong> 85th percentile was 32.82 mph.<br />
CLASSIFICATION<br />
Chart 2 lists <strong>the</strong> values of <strong>the</strong> eight classification bins and <strong>the</strong> total traffic volume accumulated <strong>for</strong> each<br />
bin.<br />
45<br />
to<br />
49<br />
50<br />
to<br />
54<br />
55<br />
><br />
0<br />
to<br />
20<br />
7837<br />
21<br />
to<br />
27<br />
158<br />
28<br />
to<br />
39<br />
40<br />
to<br />
49<br />
Chart 2<br />
50<br />
to<br />
59<br />
51 9 3 1 0 0<br />
60<br />
to<br />
69<br />
70<br />
to<br />
79<br />
80<br />
><br />
Most of <strong>the</strong> vehicles classified during <strong>the</strong> study were Passenger Cars. The number of Passenger Cars<br />
in <strong>the</strong> study was 7,995 which represents 99.20 percent of <strong>the</strong> total classified vehicles. The number of<br />
Small Trucks in <strong>the</strong> study was 51 which represents 0.60 percent of <strong>the</strong> total classified vehicles. The<br />
number of Trucks/Buses in <strong>the</strong> study was 9 which represents 0.10 percent of <strong>the</strong> total classified<br />
vehicles. The number of Tractor Trailers in <strong>the</strong> study was 4 which represents 0.00 percent of <strong>the</strong> total<br />
classified vehicles.<br />
HEADWAY<br />
During <strong>the</strong> peak time period, on 11/29/2007 at 08:30 AM <strong>the</strong> average headway between <strong>the</strong> vehicles<br />
was 12.5 seconds. The slowest traffic period was on 11/27/2007 at 01:00 AM. During this slowest<br />
period, <strong>the</strong> average headway was 900.0 seconds.<br />
WEATHER<br />
The roadway surface temperature over <strong>the</strong> period of <strong>the</strong> study varied between 42 and 56 degrees<br />
Fahrenheit. The HI-STAR determined that <strong>the</strong> roadway surface was Dry 100.00 percent of <strong>the</strong> time.<br />
12/03/2007<br />
Page:<br />
1
Nu-Metrics Traffic Analyzer Study<br />
Computer Generated Summary Report<br />
City: Charlottesville<br />
Street: Well<strong>for</strong>d St @ 1111<br />
A study of vehicle traffic was conducted with HI-STAR unit number 2275. The study was done in <strong>the</strong><br />
NB lane on Well<strong>for</strong>d St @ 1111 in Charlottesville, VA in /_near Albemarle county. The study began on<br />
02/12/2008 at 12:00 AM and concluded on 02/15/2008 at 12:00 AM, lasting a total of 72 hours. Data<br />
was recorded in 15 minute time periods. The total recorded volume of traffic showed 403 vehicles<br />
passed through <strong>the</strong> location with a peak volume of 10 on 02/13/2008 at 05:45 PM and a minimum<br />
volume of 0 on 02/12/2008 at 12:00 AM. The AADT Count <strong>for</strong> this study was 134.<br />
SPEED<br />
Chart 1 lists <strong>the</strong> values of <strong>the</strong> speed bins and <strong>the</strong> total traffic volume <strong>for</strong> each bin.<br />
0<br />
to<br />
9<br />
10<br />
to<br />
14<br />
15<br />
to<br />
19<br />
20<br />
to<br />
24<br />
25<br />
to<br />
29<br />
30<br />
to<br />
34<br />
35<br />
to<br />
39<br />
Chart 1<br />
40<br />
to<br />
44<br />
0 8 48 74 140 75 29 8 5 6 8 0 0 0 0<br />
At least half of <strong>the</strong> vehicles were traveling in <strong>the</strong> 25 - 29 mph range or a lower speed. The average<br />
speed <strong>for</strong> all classified vehicles was 28 mph with 67.5 percent exceeding <strong>the</strong> posted speed of 25 mph.<br />
The HI-STAR found 2.00 percent of <strong>the</strong> total vehicles were traveling in excess of 55 mph. The mode<br />
speed <strong>for</strong> this traffic study was 25 mph and <strong>the</strong> 85th percentile was 34.72 mph.<br />
CLASSIFICATION<br />
Chart 2 lists <strong>the</strong> values of <strong>the</strong> eight classification bins and <strong>the</strong> total traffic volume accumulated <strong>for</strong> each<br />
bin.<br />
45<br />
to<br />
49<br />
50<br />
to<br />
54<br />
55<br />
><br />
0<br />
to<br />
20<br />
383<br />
21<br />
to<br />
27<br />
12<br />
28<br />
to<br />
39<br />
40<br />
to<br />
49<br />
Chart 2<br />
50<br />
to<br />
59<br />
6 0 0 0 0 0<br />
60<br />
to<br />
69<br />
70<br />
to<br />
79<br />
80<br />
><br />
Most of <strong>the</strong> vehicles classified during <strong>the</strong> study were Passenger Cars. The number of Passenger Cars<br />
in <strong>the</strong> study was 395 which represents 98.50 percent of <strong>the</strong> total classified vehicles. The number of<br />
Small Trucks in <strong>the</strong> study was 6 which represents 1.50 percent of <strong>the</strong> total classified vehicles. The<br />
number of Trucks/Buses in <strong>the</strong> study was 0 which represents 0.00 percent of <strong>the</strong> total classified<br />
vehicles. The number of Tractor Trailers in <strong>the</strong> study was 0 which represents 0.00 percent of <strong>the</strong> total<br />
classified vehicles.<br />
HEADWAY<br />
During <strong>the</strong> peak time period, on 02/13/2008 at 05:45 PM <strong>the</strong> average headway between <strong>the</strong> vehicles<br />
was 81.82 seconds. The slowest traffic period was on 02/12/2008 at 12:00 AM. During this slowest<br />
period, <strong>the</strong> average headway was 900.0 seconds.<br />
WEATHER<br />
The roadway surface temperature over <strong>the</strong> period of <strong>the</strong> study varied between 31 and 74 degrees<br />
Fahrenheit. The HI-STAR determined that <strong>the</strong> roadway surface was Dry 100.00 percent of <strong>the</strong> time.<br />
02/15/2008<br />
Page:<br />
1
Nu-Metrics Traffic Analyzer Study<br />
Computer Generated Summary Report<br />
City: Charlottesville<br />
Street: Well<strong>for</strong>d St @ 1111<br />
A study of vehicle traffic was conducted with HI-STAR unit number 2873. The study was done in <strong>the</strong><br />
SB lane on Well<strong>for</strong>d St @ 1111 in Charlottesville, VA in /_near Albemarle county. The study began on<br />
02/12/2008 at 12:00 AM and concluded on 02/15/2008 at 12:00 AM, lasting a total of 72 hours. Data<br />
was recorded in 15 minute time periods. The total recorded volume of traffic showed 767 vehicles<br />
passed through <strong>the</strong> location with a peak volume of 13 on 02/12/2008 at 06:00 PM and a minimum<br />
volume of 0 on 02/12/2008 at 12:00 AM. The AADT Count <strong>for</strong> this study was 256.<br />
SPEED<br />
Chart 1 lists <strong>the</strong> values of <strong>the</strong> speed bins and <strong>the</strong> total traffic volume <strong>for</strong> each bin.<br />
0<br />
to<br />
9<br />
10<br />
to<br />
14<br />
15<br />
to<br />
19<br />
20<br />
to<br />
24<br />
25<br />
to<br />
29<br />
30<br />
to<br />
34<br />
35<br />
to<br />
39<br />
Chart 1<br />
40<br />
to<br />
44<br />
0 19 59 251 282 108 28 6 0 3 6 0 0 0 0<br />
At least half of <strong>the</strong> vehicles were traveling in <strong>the</strong> 25 - 29 mph range or a lower speed. The average<br />
speed <strong>for</strong> all classified vehicles was 26 mph with 56.8 percent exceeding <strong>the</strong> posted speed of 25 mph.<br />
The HI-STAR found 0.79 percent of <strong>the</strong> total vehicles were traveling in excess of 55 mph. The mode<br />
speed <strong>for</strong> this traffic study was 25 mph and <strong>the</strong> 85th percentile was 31.70 mph.<br />
CLASSIFICATION<br />
Chart 2 lists <strong>the</strong> values of <strong>the</strong> eight classification bins and <strong>the</strong> total traffic volume accumulated <strong>for</strong> each<br />
bin.<br />
45<br />
to<br />
49<br />
50<br />
to<br />
54<br />
55<br />
><br />
0<br />
to<br />
20<br />
711<br />
21<br />
to<br />
27<br />
41<br />
28<br />
to<br />
39<br />
40<br />
to<br />
49<br />
Chart 2<br />
50<br />
to<br />
59<br />
9 1 0 0 0 0<br />
60<br />
to<br />
69<br />
70<br />
to<br />
79<br />
80<br />
><br />
Most of <strong>the</strong> vehicles classified during <strong>the</strong> study were Passenger Cars. The number of Passenger Cars<br />
in <strong>the</strong> study was 752 which represents 98.70 percent of <strong>the</strong> total classified vehicles. The number of<br />
Small Trucks in <strong>the</strong> study was 9 which represents 1.20 percent of <strong>the</strong> total classified vehicles. The<br />
number of Trucks/Buses in <strong>the</strong> study was 1 which represents 0.10 percent of <strong>the</strong> total classified<br />
vehicles. The number of Tractor Trailers in <strong>the</strong> study was 0 which represents 0.00 percent of <strong>the</strong> total<br />
classified vehicles.<br />
HEADWAY<br />
During <strong>the</strong> peak time period, on 02/12/2008 at 06:00 PM <strong>the</strong> average headway between <strong>the</strong> vehicles<br />
was 64.29 seconds. The slowest traffic period was on 02/12/2008 at 12:00 AM. During this slowest<br />
period, <strong>the</strong> average headway was 900.0 seconds.<br />
WEATHER<br />
The roadway surface temperature over <strong>the</strong> period of <strong>the</strong> study varied between 31 and 72 degrees<br />
Fahrenheit. The HI-STAR determined that <strong>the</strong> roadway surface was Dry 100.00 percent of <strong>the</strong> time.<br />
02/15/2008<br />
Page:<br />
1
Nu-Metrics Traffic Analyzer Study<br />
Computer Generated Summary Report<br />
City: Charlottesville<br />
Street: Well<strong>for</strong>d St @ 1311<br />
A study of vehicle traffic was conducted with HI-STAR unit number 2878. The study was done in <strong>the</strong><br />
NB lane on Well<strong>for</strong>d St @ 1311 in Charlottesville, VA in /_near Albemarle county. The study began on<br />
02/12/2008 at 12:00 AM and concluded on 02/15/2008 at 12:00 AM, lasting a total of 72 hours. Data<br />
was recorded in 15 minute time periods. The total recorded volume of traffic showed 375 vehicles<br />
passed through <strong>the</strong> location with a peak volume of 9 on 02/12/2008 at 07:45 AM and a minimum<br />
volume of 0 on 02/12/2008 at 12:00 AM. The AADT Count <strong>for</strong> this study was 125.<br />
SPEED<br />
Chart 1 lists <strong>the</strong> values of <strong>the</strong> speed bins and <strong>the</strong> total traffic volume <strong>for</strong> each bin.<br />
0<br />
to<br />
9<br />
10<br />
to<br />
14<br />
15<br />
to<br />
19<br />
20<br />
to<br />
24<br />
25<br />
to<br />
29<br />
30<br />
to<br />
34<br />
35<br />
to<br />
39<br />
Chart 1<br />
40<br />
to<br />
44<br />
0 12 86 184 67 14 2 3 0 0 5 0 0 0 0<br />
At least half of <strong>the</strong> vehicles were traveling in <strong>the</strong> 20 - 24 mph range or a lower speed. The average<br />
speed <strong>for</strong> all classified vehicles was 23 mph with 24.4 percent exceeding <strong>the</strong> posted speed of 25 mph.<br />
The HI-STAR found 1.34 percent of <strong>the</strong> total vehicles were traveling in excess of 55 mph. The mode<br />
speed <strong>for</strong> this traffic study was 20 mph and <strong>the</strong> 85th percentile was 27.62 mph.<br />
CLASSIFICATION<br />
Chart 2 lists <strong>the</strong> values of <strong>the</strong> eight classification bins and <strong>the</strong> total traffic volume accumulated <strong>for</strong> each<br />
bin.<br />
45<br />
to<br />
49<br />
50<br />
to<br />
54<br />
55<br />
><br />
0<br />
to<br />
20<br />
354<br />
21<br />
to<br />
27<br />
12<br />
28<br />
to<br />
39<br />
40<br />
to<br />
49<br />
Chart 2<br />
50<br />
to<br />
59<br />
5 1 1 0 0 0<br />
60<br />
to<br />
69<br />
70<br />
to<br />
79<br />
80<br />
><br />
Most of <strong>the</strong> vehicles classified during <strong>the</strong> study were Passenger Cars. The number of Passenger Cars<br />
in <strong>the</strong> study was 366 which represents 98.10 percent of <strong>the</strong> total classified vehicles. The number of<br />
Small Trucks in <strong>the</strong> study was 5 which represents 1.30 percent of <strong>the</strong> total classified vehicles. The<br />
number of Trucks/Buses in <strong>the</strong> study was 1 which represents 0.30 percent of <strong>the</strong> total classified<br />
vehicles. The number of Tractor Trailers in <strong>the</strong> study was 1 which represents 0.30 percent of <strong>the</strong> total<br />
classified vehicles.<br />
HEADWAY<br />
During <strong>the</strong> peak time period, on 02/12/2008 at 07:45 AM <strong>the</strong> average headway between <strong>the</strong> vehicles<br />
was 90.0 seconds. The slowest traffic period was on 02/12/2008 at 12:00 AM. During this slowest<br />
period, <strong>the</strong> average headway was 900.0 seconds.<br />
WEATHER<br />
The roadway surface temperature over <strong>the</strong> period of <strong>the</strong> study varied between 33 and 56 degrees<br />
Fahrenheit. The HI-STAR determined that <strong>the</strong> roadway surface was Dry 100.00 percent of <strong>the</strong> time.<br />
02/15/2008<br />
Page:<br />
1
Nu-Metrics Traffic Analyzer Study<br />
Computer Generated Summary Report<br />
City: Charlottesville<br />
Street: Well<strong>for</strong>d St @ 1311<br />
A study of vehicle traffic was conducted with HI-STAR unit number 2891. The study was done in <strong>the</strong><br />
SB lane on Well<strong>for</strong>d St @ 1311 in Charlottesville, VA in /_near Albemarle county. The study began on<br />
02/12/2008 at 12:00 AM and concluded on 02/15/2008 at 12:00 AM, lasting a total of 72 hours. Data<br />
was recorded in 15 minute time periods. The total recorded volume of traffic showed 45 vehicles<br />
passed through <strong>the</strong> location with a peak volume of 5 on 02/12/2008 at 05:00 PM and a minimum<br />
volume of 0 on 02/12/2008 at 12:00 AM. The AADT Count <strong>for</strong> this study was 15.<br />
SPEED<br />
Chart 1 lists <strong>the</strong> values of <strong>the</strong> speed bins and <strong>the</strong> total traffic volume <strong>for</strong> each bin.<br />
0<br />
to<br />
9<br />
10<br />
to<br />
14<br />
15<br />
to<br />
19<br />
20<br />
to<br />
24<br />
25<br />
to<br />
29<br />
30<br />
to<br />
34<br />
35<br />
to<br />
39<br />
Chart 1<br />
40<br />
to<br />
44<br />
0 9 6 19 2 4 0 0 1 0 2 0 0 0 0<br />
At least half of <strong>the</strong> vehicles were traveling in <strong>the</strong> 20 - 24 mph range or a lower speed. The average<br />
speed <strong>for</strong> all classified vehicles was 22 mph with 20.9 percent exceeding <strong>the</strong> posted speed of 25 mph.<br />
The HI-STAR found 4.65 percent of <strong>the</strong> total vehicles were traveling in excess of 55 mph. The mode<br />
speed <strong>for</strong> this traffic study was 20 mph and <strong>the</strong> 85th percentile was 30.69 mph.<br />
CLASSIFICATION<br />
Chart 2 lists <strong>the</strong> values of <strong>the</strong> eight classification bins and <strong>the</strong> total traffic volume accumulated <strong>for</strong> each<br />
bin.<br />
45<br />
to<br />
49<br />
50<br />
to<br />
54<br />
55<br />
><br />
0<br />
to<br />
20<br />
37<br />
21<br />
to<br />
27<br />
4<br />
28<br />
to<br />
39<br />
40<br />
to<br />
49<br />
Chart 2<br />
50<br />
to<br />
59<br />
1 0 1 0 0 0<br />
60<br />
to<br />
69<br />
70<br />
to<br />
79<br />
80<br />
><br />
Most of <strong>the</strong> vehicles classified during <strong>the</strong> study were Passenger Cars. The number of Passenger Cars<br />
in <strong>the</strong> study was 41 which represents 95.30 percent of <strong>the</strong> total classified vehicles. The number of<br />
Small Trucks in <strong>the</strong> study was 1 which represents 2.30 percent of <strong>the</strong> total classified vehicles. The<br />
number of Trucks/Buses in <strong>the</strong> study was 0 which represents 0.00 percent of <strong>the</strong> total classified<br />
vehicles. The number of Tractor Trailers in <strong>the</strong> study was 1 which represents 2.30 percent of <strong>the</strong> total<br />
classified vehicles.<br />
HEADWAY<br />
During <strong>the</strong> peak time period, on 02/12/2008 at 05:00 PM <strong>the</strong> average headway between <strong>the</strong> vehicles<br />
was 150.0 seconds. The slowest traffic period was on 02/12/2008 at 12:00 AM. During this slowest<br />
period, <strong>the</strong> average headway was 900.0 seconds.<br />
WEATHER<br />
The roadway surface temperature over <strong>the</strong> period of <strong>the</strong> study varied between 29 and 46 degrees<br />
Fahrenheit. The HI-STAR determined that <strong>the</strong> roadway surface was Dry 97.57 percent of <strong>the</strong> time.<br />
02/15/2008<br />
Page:<br />
1
Appendix B<br />
Traffic Calming Analysis Summary Sheets<br />
City of Charlottesville, 2004
Appendix C<br />
Pages 12-13, Traffic Calming Device Implementation Handbook<br />
City of Charlottesville, 2000
Figure 2: Criteria <strong>for</strong> determining severity of through traffic problems.<br />
Existing conditions that fall between <strong>the</strong> two curves will be considered moderate and subject to<br />
<strong>the</strong> application of appropriate traffic calming measures if ano<strong>the</strong>r type of traffic problem also<br />
exists, (i.e., speeding). Streets that portray combinations of volume/through traffic percentages<br />
above <strong>the</strong> higher curve will be considered intolerable to <strong>the</strong> extent required to warrant <strong>the</strong><br />
application of traffic calming measures to reduce <strong>the</strong> volume of through traffic.<br />
Speeding Analysis: Speed limits have been posted along most of Charlottesville’s residential<br />
streets. Posted limits of 25 and 30 MPH are fairly common. Past experience has shown that<br />
some speeding will likely occur in most, if not all situations. Accepted procedures <strong>for</strong> determining<br />
<strong>the</strong> safe operating speed along an unposted street includes measurement of prevailing speeds,<br />
and considering posting a limit at or near <strong>the</strong> 85 th percentile speed.<br />
City of Charlottesville<br />
Traffic Calming Device Implementation Guidebook
<strong>Neighborhood</strong> concerns about speeding problems appear to be oriented to those motorists<br />
whose speed is significantly higher—generally more than 10 MPH—over <strong>the</strong> posted limit. Such<br />
speeds are <strong>the</strong> main cause of concern, and usually are <strong>the</strong> ones that create accident potential.<br />
Moreover, speeding problems should generally prevail throughout several blocks of a street or<br />
along several streets of a neighborhood <strong>for</strong> <strong>the</strong> problem to be considered <strong>for</strong> traffic calming<br />
treatments.<br />
The criteria to be used to determine <strong>the</strong> presence and seriousness of speeding problems is given<br />
in Figure 3. It relates <strong>the</strong> observed 85 th percentile speed to <strong>the</strong> posted speed limit. If <strong>the</strong> speed<br />
studies reveal <strong>the</strong> 85 th percentile speed to be equal to or less than <strong>the</strong> posted limit, a tolerable<br />
condition will be found to exist. Actions to reduce <strong>the</strong> prevailing speed are generally not<br />
considered to be warranted when <strong>the</strong> relationship between <strong>the</strong> 85 th percentile speed and <strong>the</strong><br />
posted speed limit is below <strong>the</strong> lower threshold line on <strong>the</strong> chart.<br />
Figure 3: Criteria <strong>for</strong> determining presence and severity of speeding problems.<br />
When <strong>the</strong> 85 th percentile speed exceeds <strong>the</strong> posted speed limit, it will be concluded that a<br />
speeding problem exists. The problem will be classed as “moderate” if <strong>the</strong> 85 th percentile/posted<br />
speed limit comparison falls between <strong>the</strong> two threshold lines on Figure 3 and “serious” when <strong>the</strong><br />
comparison exceeds <strong>the</strong> upper threshold value line. Often, jurisdictions will adjust <strong>the</strong> posted<br />
speed limit based upon <strong>the</strong> percentage of motorists traveling (usually 10) mph over <strong>the</strong> 85 th<br />
percentile speed, based on spot speed study evaluations.<br />
City of Charlottesville<br />
Traffic Calming Device Implementation Guidebook