- Page 1 and 2:
PNNL-6415 Rev. 18 Hanford Site Nati
- Page 3 and 4:
PNNL-6415 Rev. 18 Hanford Site Nati
- Page 5 and 6:
Preface This document describes the
- Page 7 and 8:
Acknowledgements As editor of Revis
- Page 9 and 10:
Acronyms, Abbreviations, and Symbol
- Page 11 and 12:
Acronyms, Abbreviations, and Symbol
- Page 13 and 14:
Acronyms, Abbreviations, and Symbol
- Page 15 and 16:
Glossary Accrete. To grow or fuse t
- Page 17 and 18:
Table of Contents Preface .........
- Page 19 and 20:
4.5 Ecology........................
- Page 21 and 22:
6.0 Statutory and Regulatory Requir
- Page 23 and 24:
Figures Figure 4.0-1. U.S. Departme
- Page 25 and 26:
Figure 4.10-1. Occupational Injury
- Page 27 and 28:
Table 4.1-1. Table 4.1-2. Tables St
- Page 29 and 30:
Table A7. Table A8. Joint Frequency
- Page 31 and 32:
Introduction 4.0 Affected Environme
- Page 33 and 34:
• 300 Area. The 300 Area, encompa
- Page 35 and 36:
4.1 Climate and Meteorology K. W. B
- Page 37 and 38:
Table 4.1-1. Station Numbers, Names
- Page 39 and 40:
Figure 4.1-2. Wind Roses at the 9.1
- Page 41 and 42:
Figure 4.1-3. Wind Roses at the 60-
- Page 43 and 44:
more than half of the annual amount
- Page 45 and 46:
4.2 Air Quality B. G. Fritz A varie
- Page 47 and 48:
meet one or more ambient air standa
- Page 49 and 50:
4.2.2.2 Emissions of Nonradiologica
- Page 51 and 52:
concentration at the HMS during 200
- Page 53 and 54:
The Clean Air Act requires the impl
- Page 55 and 56: 4.3 Geology M. A. Chamness and M. D
- Page 57 and 58: Figure 4.3.2. Physical and Structur
- Page 59 and 60: 4.3.2.1 Stratigraphy of Rocks Older
- Page 61 and 62: significant topography. Continued u
- Page 63 and 64: During Cold Creek time in the centr
- Page 65 and 66: Clastic dikes typically occur in sw
- Page 67 and 68: Figure 4.3.7. Rattlesnake Mountain
- Page 69 and 70: The Cold Creek unit in the 200 East
- Page 71 and 72: Soil types found on the Hanford Sit
- Page 73 and 74: Two large events occurred on the ea
- Page 75 and 76: generally shallow; 75 percent of th
- Page 77 and 78: Figure 4.3-10. Earthquake Activity
- Page 79 and 80: 4.4 Hydrology P. D. Thorne and G. V
- Page 81 and 82: Columbia River flow rates near Prie
- Page 83 and 84: the aquatic life designation is “
- Page 85 and 86: Columbia River water quality data f
- Page 87 and 88: Contaminant, Units Table 4.4-1. Reg
- Page 89 and 90: Figure 4.4-6. Locations of Principa
- Page 91 and 92: Figure 4.4-8. Flood Area for the Pr
- Page 93 and 94: Figure 4.4-9. Flood Area from a 100
- Page 95 and 96: Figure 4.4-10. Extent of Probable M
- Page 97 and 98: 4.4.2.1 Vadose Zone Contamination T
- Page 99 and 100: Groundwater beneath the Hanford Sit
- Page 101 and 102: Gee et al. (1992) and Fayer et al.
- Page 103 and 104: 4.4.3.5 Groundwater East and North
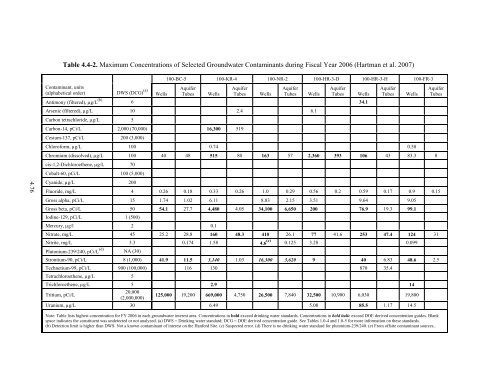
- Page 105: DWS in one or more onsite wells. Co
- Page 109 and 110: Figure 4.4-13. Distribution of Haza
- Page 111 and 112: levels across much of the Hanford S
- Page 113 and 114: 4.5 Ecology T. M. Poston and M. R.
- Page 115 and 116: Figure 4.5-1. Distribution of Veget
- Page 117 and 118: location, the Hanford Site provides
- Page 119 and 120: when the crust is dominated by cyan
- Page 121 and 122: Mule deer rely mainly on shoreline
- Page 123 and 124: Lands Ecology Reserve Unit and shor
- Page 125 and 126: 4.5.1.3 Other Distinctive Terrestri
- Page 127 and 128: Figure 4.5-3. Columbia River Island
- Page 129 and 130: species), and salt rattlepod (Swain
- Page 131 and 132: spawning areas and are of the great
- Page 133 and 134: Benthic Invertebrates. Bottom dwell
- Page 135 and 136: When present, however, they formed
- Page 137 and 138: Common Name Scientific Name Federal
- Page 139 and 140: Table 4.5-2. Washington State Candi
- Page 141 and 142: 4.111 Common Name Scientific Name C
- Page 143 and 144: Common Name Scientific Name State L
- Page 145 and 146: 4.6 Cultural, Archaeological, and H
- Page 147 and 148: Table 4.6-1. Historic Buildings, Ar
- Page 149 and 150: Establishment of the Historic Distr
- Page 151 and 152: 4.6.2 Early Settlers/Farming Landsc
- Page 153 and 154: 4.6.2.2 Traditional Cultural Places
- Page 155 and 156: DOE/RL will consider the retention
- Page 157 and 158:
Traditional Cultural Places. Twenty
- Page 159 and 160:
een identified and may have been th
- Page 161 and 162:
eligible for the National Register
- Page 164 and 165:
Archaeological Resources. Numerous
- Page 166 and 167:
This page intentionally left blank
- Page 168 and 169:
Figure 4.7-1. Hanford Site, Washing
- Page 170 and 171:
The area’s farms and ranches gene
- Page 172 and 173:
Three measures of area income are p
- Page 174 and 175:
Table 4.7-3. Population Estimates a
- Page 176 and 177:
(CEQ) later provided additional gui
- Page 178 and 179:
Figure 4.7-3. Location of Low-Incom
- Page 180 and 181:
11.2 percent vacancy rate in 2005.
- Page 182 and 183:
A DOE-maintained road network withi
- Page 184 and 185:
Table 4.7-5. Police Personnel in th
- Page 186 and 187:
Table 4.7-7. Examples of Physical R
- Page 188 and 189:
This page intentionally left blank
- Page 190 and 191:
Figure 4.8-1. Viewshed from Gable M
- Page 192 and 193:
Table 4.9-1. Applicable State Noise
- Page 194 and 195:
4.9.3.2 Basalt Waste Isolation Proj
- Page 196 and 197:
This page intentionally left blank
- Page 198 and 199:
During the 5-yr period from 2001-20
- Page 200 and 201:
4.10.2 Occupational Radiation Expos
- Page 202 and 203:
Table 4.10-2. Radiation Exposure Da
- Page 204 and 205:
71 FR 74929. “Notice of Availabil
- Page 206 and 207:
Bonneville Power Administration (BP
- Page 208 and 209:
Cushing, C.E., and E.G. Wolf. 1982.
- Page 210 and 211:
Fecht, K.R., S.P. Reidel, and A.M.
- Page 212 and 213:
Hartman, M.J., and R.E. Peterson. 1
- Page 214 and 215:
Liikala, T.L., R.L. Aaberg, N.J. Ai
- Page 216 and 217:
Office of Financial Management (OFM
- Page 218 and 219:
Reidel, S.R., T.L. Tolan, P.R. Hoop
- Page 220 and 221:
Simpson, B.C., R.A. Corbin, and S.F
- Page 222 and 223:
Tri-City Association of REALTORS (T
- Page 224 and 225:
U.S. Department of Energy (DOE). 19
- Page 226 and 227:
U.S. Department of Energy (DOE). 20
- Page 228 and 229:
Walker, D.E., Jr. 1967. Mutual Cros
- Page 230 and 231:
Westinghouse Hanford Company (WHC).
- Page 232 and 233:
This page intentionally left blank
- Page 234 and 235:
This page intentionally left blank
- Page 236 and 237:
Maximum Emission Rate: E = (9.8 x 1
- Page 238 and 239:
Table A2. Joint Frequency Distribut
- Page 240 and 241:
Table A4. Joint Frequency Distribut
- Page 242 and 243:
Table A6. Joint Frequency Distribut
- Page 244 and 245:
Table A8. Joint Frequency Distribut
- Page 246 and 247:
Table A11. X/Q’ Values (s m -3 )
- Page 248 and 249:
Table A15. X/Q’ Values (s m -3 )
- Page 250 and 251:
Table A19. 95th Percentile E/Q Valu
- Page 252 and 253:
Table A23. 95th Percentile E/Q Valu
- Page 254 and 255:
This page intentionally left blank
- Page 256 and 257:
Table B1 (cont’d) A. Shrub-Steppe
- Page 258 and 259:
Table B2. Mammals that Have Been Ob
- Page 260 and 261:
Table B3. Common Bird Species Known
- Page 262 and 263:
Table B3 (cont'd) Common Name Strig
- Page 264 and 265:
Table B3 (cont'd) Common Name Scien
- Page 266 and 267:
Table B5. Fish Species in the Hanfo
- Page 268 and 269:
Appendix B References Becker, J.M.
- Page 270 and 271:
This page intentionally left blank
- Page 272 and 273:
Figure C2. Vegetation/Land Coverage
- Page 274 and 275:
Figure C4. Vegetation/Land Coverage
- Page 276 and 277:
Figure C6. Vegetation/Land Coverage
- Page 278 and 279:
Figure C8. Vegetation/Land Coverage
- Page 280 and 281:
Figure C10. Vegetation/Land Coverag
- Page 282 and 283:
This page intentionally left blank
- Page 284 and 285:
Introduction The CEQ regulations in
- Page 286 and 287:
Section 309 of the CAA directs EPA
- Page 288 and 289:
• Pollution Prevention Act (42 US
- Page 290 and 291:
• 40 CFR 60, “Standards of Perf
- Page 292 and 293:
• 10 CFR 1022, “Compliance with
- Page 294 and 295:
species on the Hanford Site. Regula
- Page 296 and 297:
and authority of DOE on Hanford Sit
- Page 298 and 299:
This page intentionally left blank
- Page 300 and 301:
This page intentionally left blank
- Page 302 and 303:
This page intentionally left blank
- Page 304 and 305:
DOE also has an Information Brief c
- Page 306 and 307:
This page intentionally left blank
- Page 308 and 309:
40 CFR 81. “Designation of Areas
- Page 310 and 311:
71 FR 74929. “Notice of Availabil
- Page 312 and 313:
Clinton, W.J. 2000. “Memorandum f
- Page 314 and 315:
U.S. Department of Energy (DOE). 19
- Page 316 and 317:
Washington State Department of Ecol
- Page 318 and 319:
No. of Copies 1 J. McConnaughey The
- Page 320:
No. of Copies Fluor Hanford, Inc. (