Fall 2006 - Halliburton
Fall 2006 - Halliburton
Fall 2006 - Halliburton

You also want an ePaper? Increase the reach of your titles
YUMPU automatically turns print PDFs into web optimized ePapers that Google loves.
<strong>Fall</strong> <strong>2006</strong><br />
Summer 2004<br />
Feature Stories<br />
<strong>Halliburton</strong> Stock Fund Scheduled to Close 1<br />
KBR Master Trust to be Established 3<br />
Investment Know-How<br />
Diversification Key to a Healthy Portfolio 4<br />
Lifestyles<br />
Who Knew Investing was Like Golf? 6<br />
Focus on Funds<br />
S&P 500 Index Fund and<br />
Mid Cap Equity Index Fund 7<br />
Risk Assessment<br />
Should Interest Rates Interest You? 8<br />
Newsstand<br />
Market Update 9<br />
Retiree Corner 10<br />
Fund Performance Update 11<br />
Current news<br />
concerning your<br />
Savings Plan
The <strong>Halliburton</strong> Trust Investments Department<br />
Seated, left to right: Brinda Maxwell, Nat Duffield.<br />
Back row, left to right: Wendy Wang, Sharon Parkes, Maria Bacaling.<br />
Trust Talk is published quarterly by the <strong>Halliburton</strong> Trust Investments Department. It is designed to provide Savings Plan<br />
members with conventional wisdom on saving and investing. The information included in Trust Talk is not intended as<br />
investment advice. You may want to consult a financial advisor before making any investment decisions.<br />
2<br />
Suggestions or comments about Trust Talk can be sent to Nat Duffield or Sharon Parkes, Trust Investments Department,<br />
10200 Bellaire Blvd., Houston, Texas 77072.
Feature<br />
<strong>Halliburton</strong> Stock Fund Scheduled to Close<br />
Changes Coming to the Savings Plan<br />
Beginning January 1, 2007, there will be some changes in the Savings Plan. This issue of Trust Talk will explain<br />
those changes and what impact they may have on your investments. Please read the feature stories carefully.<br />
If you have any questions, contact your Benefits Service Center.<br />
As of January 1, 2007, the <strong>Halliburton</strong> Stock<br />
Fund (HSF) will be closed to new<br />
investments. That means participants in the<br />
Savings Plan will not be allowed to make<br />
new contributions, transfers or loan repayments into<br />
the HSF as of that date. If you currently allocate part of<br />
your contribution to the HSF, you must select a new<br />
fund within the Savings Plan to receive those<br />
contributions by December 27, <strong>2006</strong>. If you don’t select<br />
a new fund by the deadline, any contributions still<br />
allocated toward the HSF will be redirected to the<br />
Moderate Premixed<br />
Portfolio. You can make<br />
this change at the Your<br />
Benefits Resources Web<br />
site or by calling the<br />
Benefits Service Center.<br />
The Case for Change<br />
The Company<br />
understands that many<br />
employees will rely on<br />
the Savings Plan for the<br />
majority of their<br />
retirement income and is<br />
taking steps to improve<br />
the diversification and<br />
lessen the risks within<br />
the fund options.<br />
Investing in singlecompany<br />
stock funds<br />
exposes retirement<br />
savings to extreme shifts<br />
in a single stock price.<br />
Many factors outside a<br />
company’s control can<br />
affect its stock price. And<br />
even the healthiest and strongest companies can<br />
experience downturns in their stock price. Removal of<br />
the HSF makes sense for the following reasons:<br />
• Removes a non-diversified fund from the<br />
Savings Plan;<br />
• Removes the highest risk investment option; and<br />
• Encourages diversification for all plan participants.<br />
This decision supports<br />
the Savings Plan’s<br />
objectives and<br />
investment strategies to<br />
provide stable, long-term<br />
retirement savings<br />
growth. Removing the<br />
HSF investment option<br />
does not reflect a lack of<br />
confidence in the current<br />
or future performance of<br />
the Company.<br />
The Importance of<br />
Diversification<br />
Being heavily invested in<br />
single-company stock<br />
funds (regardless of the<br />
stock involved) within a<br />
retirement plan is not<br />
generally recommended<br />
by financial advisors.<br />
That’s because singlecompany<br />
stock funds are<br />
vulnerable to extreme<br />
shifts in a single stock<br />
1
price. To protect against individual stock fluctuations,<br />
financial advisors recommend diversification within<br />
a retirement savings plan. Successful investing is<br />
generally built on the principle of diversification and<br />
is a feature of all the remaining Savings Plan’s<br />
investment funds. (See “Investment Know-How” in this<br />
issue for more information on diversification.)<br />
Transfer Balance to Other Funds<br />
The Company is providing a three-year sunset period<br />
beginning January 1, 2007, so that participants can<br />
transition their funds out of the <strong>Halliburton</strong> Stock Fund<br />
over time — thereby making the most of dollar cost<br />
averaging. (For more information on dollar cost<br />
averaging, see the “Investment Know-How” section of<br />
Trust Talk Spring <strong>2006</strong>.) Any balance in the HSF at the<br />
end of the sunset period will be transferred to an<br />
investment fund chosen by the Company.<br />
The Company will monitor the overall move out of the<br />
HSF during the sunset period and, if necessary, may<br />
implement periodic transfers and/or change the sunset<br />
period to gradually decrease the HSF balance. In the<br />
meantime, you are encouraged to begin planning an<br />
exit strategy from the HSF.<br />
Rebalancing Requirement Lifted<br />
Currently, if you rebalance your Savings Plan account<br />
by moving funds into or out of the HSF, the percentage<br />
of your Savings Plan account balance invested in the<br />
HSF is automatically reduced to 15% of your total<br />
account. Effective January 1, 2007, this rebalancing<br />
requirement will be eliminated to allow participants<br />
more flexibility in moving out of the HSF. Thus,<br />
rebalancing your Savings Plan account on or after<br />
January 1, 2007, will no longer trigger the automatic<br />
reduction of your HSF balance to 15% of your total<br />
portfolio. This change will allow you to gradually move<br />
your money out of the <strong>Halliburton</strong> Stock Fund and into<br />
other investment options.<br />
Investing in the Future<br />
Although the HSF will no longer be available as an<br />
investment option in the Savings Plan, you can still<br />
invest in the Company through the Employee Stock<br />
Purchase Plan and through the open market. You may<br />
want to consult a financial advisor before making any<br />
investment decisions.<br />
Dates to Remember<br />
December 27, <strong>2006</strong><br />
Future contributions to the HSF must be<br />
redirected to a new fund or funds by<br />
December 27, <strong>2006</strong>. If you do not make a<br />
new selection, your future contributions<br />
will be invested in the Moderate<br />
Premixed Portfolio. You can change your<br />
future contributions at the Your Benefits<br />
Resources Web site or by calling the<br />
Benefits Service Center.<br />
January 1, 2007<br />
The <strong>Halliburton</strong> Stock Fund will be frozen.<br />
Plan participants will not be allowed to<br />
make new contributions, transfers or loan<br />
repayments into the HSF.<br />
Three years beginning January 1, 2007<br />
You must transfer your HSF balance into<br />
other funds within the Savings Plan<br />
during this sunset period. Any balance<br />
remaining in the HSF after this time will<br />
be transferred to an investment fund<br />
chosen by the Company. You can make<br />
transfers at the Your Benefits Resources<br />
Web site or by calling the Benefits<br />
Service Center.<br />
2
Feature<br />
KBR Master Trust to be Established<br />
In anticipation of KBR’s full and complete<br />
separation, KBR assets will be separated from<br />
the <strong>Halliburton</strong> Master Trust in the near future.<br />
The KBR Savings Plan assets will be used to<br />
establish a dedicated KBR Master Trust. The KBR<br />
Master Trust will collect and invest all employer and<br />
employee funds contributed to the KBR and Brown &<br />
Root Savings Plans. These assets will be held by<br />
trustee and custodian, State Street Bank and Trust<br />
Company. By law, the KBR Master Trust assets must<br />
be used solely for the benefit of its plan participants<br />
or their beneficiaries and are not subject to the<br />
claims of any KBR or <strong>Halliburton</strong> creditor.<br />
It is intended that the KBR Master Trust will offer<br />
KBR participants with the Premixed Portfolios and<br />
Single Focus Fund investment options currently<br />
offered under the <strong>Halliburton</strong> Master Trust with no<br />
substantial change to how the funds are managed.<br />
As fund managers will now be overseeing two<br />
accounts, each with a smaller asset pool (as<br />
compared to the joint assets), there will be a slight<br />
increase in fees and expenses to the investment<br />
options under both the <strong>Halliburton</strong> and KBR Master<br />
Trusts. However, even with the increase in fees and<br />
expenses, both the <strong>Halliburton</strong> and KBR plans will<br />
continue to offer investment options with fee<br />
structures below what are typically found in mutual<br />
funds that are available to the general public.<br />
3
Investment Know-How<br />
Diversification Key to a Healthy Portfolio<br />
Whoever said “variety is the spice of life” knew what he<br />
was talking about. He probably wasn’t thinking about<br />
investing when coining the phrase, but in fact, “variety”<br />
may be the single most important concept investors<br />
need to understand.<br />
In the world of stocks, bonds and other investments,<br />
variety means diversification. Diversification is the<br />
practice of spreading your investments across different<br />
asset classes, in order to minimize your risk of suffering a<br />
major loss. To use another popular idiom, diversification<br />
means “don’t put all your eggs in one basket.”<br />
Why is diversification so important? The simplest answer<br />
is that it provides protection from market risk. With any<br />
investment, you’re taking a risk that it may decline in<br />
value; generally, the more risk you take, the more<br />
potential you have to be rewarded with higher returns. A<br />
well-diversified portfolio is one that balances investments<br />
with higher and lower risk/reward profiles, so that a<br />
downturn in one asset class won’t devastate the entire<br />
portfolio. (For more information on the different types of<br />
risks, see the <strong>Fall</strong> 2004 issue of Trust Talk.)<br />
Avoid the Ups and Downs<br />
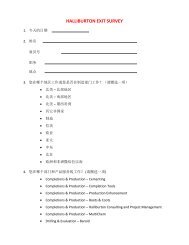
The chart on page 5 illustrates the need for<br />
diversification. It tracks the performance of the Single<br />
Focus Funds in the Savings Plan over the last 10 years.<br />
As you can see, the performance of each fund varies<br />
from year to year. For example, small-cap stocks topped<br />
the charts in 1996, took a downturn in 1998, hit bottom in<br />
2002, and skyrocketed in 2003! If you had invested only in<br />
small-cap stocks over the last decade, your retirement<br />
savings would have taken several harrowing turns. And<br />
it’s a risky game to bet that the fund will be “up” when<br />
you need to withdraw the money.<br />
Mix and Match<br />
Selecting from the Savings Plan’s Single Focus Funds<br />
puts the power of diversification in your hands. Your<br />
fund choices should be based on a combination of<br />
factors, including how many years you have until<br />
retirement, your investment objectives, your risk<br />
tolerance, and what other investments you have<br />
outside of the plan. Young adults typically have a higher<br />
tolerance for risk and can allocate more money to<br />
higher risk (e.g., stock) funds, and a smaller percentage<br />
to income-producing (e.g., bond or cash alternative)<br />
funds, because they have many years to ride out the<br />
volatility of the stock market in hopes of achieving<br />
higher returns. An investor nearing retirement age or<br />
with a lower tolerance for risk may choose just the<br />
opposite strategy, putting most of his/her assets in<br />
stable, income-producing investments, and a smaller<br />
percentage in stock funds.<br />
Let the Plan Diversify for You<br />
The Savings Plan’s four Premixed Portfolios are<br />
designed to take the guesswork out of diversification<br />
for participants who don’t want to create their own<br />
portfolios. Often called lifestyle funds, the Premixed<br />
Portfolios let you select your investments according to<br />
targeted risk and return profiles: Stable Value,<br />
Conservative, Moderate and Aggressive. Each Portfolio<br />
is professionally managed, self-balancing and well<br />
diversified. Any one of them can be used as a complete<br />
investment strategy.<br />
4
Single Focus Funds’ 10-Year Performance*<br />
1996 1997 1998 1999 2000 2001 2002 2003 2004 2005<br />
RETURN Strongest<br />
Small Cap<br />
36.3%<br />
LCGrowth<br />
24.7%<br />
LCValue<br />
24.2%<br />
S&P 500<br />
22.9%<br />
Mid Cap<br />
19.3%<br />
LCGrowth<br />
36.5%<br />
S&P 500<br />
33.3%<br />
Small Cap<br />
33.1%<br />
LCValue<br />
32.4%<br />
Mid Cap<br />
32.2%<br />
LCGrowth<br />
31.1%<br />
S&P 500<br />
28.5%<br />
Mid Cap<br />
19.2%<br />
LCValue<br />
16.4%<br />
Non U.S.<br />
12.4%<br />
Non U.S.<br />
24.6%<br />
S&P 500<br />
20.9%<br />
LCGrowth<br />
16.8%<br />
Mid Cap<br />
14.8%<br />
Small Cap<br />
8.5%<br />
Mid Cap<br />
17.7%<br />
LCValue<br />
16.6%<br />
Small Cap<br />
10.7%<br />
Bond<br />
Fund<br />
10.6%<br />
Balanced<br />
10.2%<br />
Bond<br />
Fund<br />
8.2%<br />
Balanced<br />
4.1%<br />
Small Cap<br />
2.5%<br />
Mid Cap<br />
-0.5%<br />
LCValue<br />
-1.8%<br />
Bond<br />
Fund<br />
10.3%<br />
Balanced<br />
-6.9%<br />
Non U.S.<br />
-13.7%<br />
LCValue<br />
-14.1%<br />
Mid Cap<br />
-14.5%<br />
Small Cap<br />
40.0%<br />
Mid Cap<br />
35.6%<br />
Non U.S.<br />
33.1%<br />
S&P 500<br />
28.6%<br />
LCValue<br />
28.4%<br />
Non U.S.<br />
18.5%<br />
Mid Cap<br />
16.5%<br />
LCValue<br />
15.9%<br />
Small Cap<br />
14.2%<br />
Balanced<br />
11.3%<br />
Non U.S.<br />
19.8%<br />
Mid Cap<br />
12.5%<br />
LCValue<br />
8.0%<br />
Balanced<br />
6.9%<br />
LCGrowth<br />
6.4%<br />
Balanced<br />
16.2%<br />
Balanced<br />
23.2%<br />
Balanced<br />
12.1%<br />
Balanced<br />
4.3%<br />
Non U.S.<br />
-6.7%<br />
S&P 500<br />
-12.0%<br />
S&P 500<br />
-22.2%<br />
LCGrowth<br />
27.3%<br />
S&P 500<br />
10.8%<br />
S&P 500<br />
4.8%<br />
Non U.S.<br />
15.8%<br />
Bond<br />
Fund<br />
9.6%<br />
Bond<br />
Fund<br />
8.3%<br />
Bond<br />
Fund<br />
-0.7%<br />
S&P 500<br />
-9.2%<br />
LCGrowth<br />
-18.2%<br />
Small Cap<br />
-23.3%<br />
Balanced<br />
20.8%<br />
LCGrowth<br />
7.9%<br />
Bond<br />
Fund<br />
2.3%<br />
Weakest<br />
Bond<br />
Fund<br />
3.7%<br />
Non U.S.<br />
8.0%<br />
Small Cap<br />
-7.7%<br />
LCValue<br />
-6.0%<br />
LCGrowth<br />
-11.8%<br />
Non U.S.<br />
-18.8%<br />
LCGrowth<br />
-27.6%<br />
Bond<br />
Fund<br />
4.0%<br />
Bond<br />
Fund<br />
4.2%<br />
Small Cap<br />
1.6%<br />
* None of the funds were in existence until 1999 or later. To provide comparative historical data, we used the managers’ returns of their<br />
<strong>Halliburton</strong> Trust account and/or the returns from the firms’ composite accounts. Refer to the Highlights Brochure for more information on<br />
each fund.<br />
5
Lifestyles<br />
Who Knew Investing was Like Golf?<br />
Trust Talk asked several employees about how they save for<br />
retirement. Fortunately, these employees had a lot to share.<br />
Trust Talk will feature additional employee comments in future<br />
issues.<br />
Shawn Skobel, account representative sand controlpumping,<br />
likens investing to golf. He says that similar to<br />
needing a variety of clubs in your bag to complete a<br />
game of golf, you need multiple investment vehicles in<br />
your retirement portfolio to help you reach your savings<br />
goals. Here’s what he had to say about how he is doing<br />
on reaching his savings goals.<br />
Shawn, how far are you from retirement?<br />
30 years on paper...but ideally I would like to retire 10<br />
years sooner.<br />
How well are you doing on saving for<br />
your retirement goal?<br />
I believe that I am moving in the right<br />
direction. I have been maxing out all of<br />
my options and putting away as much as<br />
possible in the Savings Plan, Roth IRAs and<br />
other voluntary accounts for over 10 years<br />
now. I still have a long way to go but can now<br />
see the light at the end of the<br />
tunnel...there is hope.<br />
How do you make your investment<br />
decisions?<br />
I make a lot of my own decisions...but<br />
I do like to pick the brains of a couple<br />
of advisors that are close to the<br />
family. I also take some time out<br />
each week to read up on the<br />
markets worldwide and follow up on<br />
multiple indexes.<br />
How often do you review your investment choices?<br />
I review my portfolio once a quarter. I like to make sure<br />
that my entire portfolio is diversified and not tied to one<br />
sector or index. I find that if you look at your portfolio<br />
each and every day you can get caught up in the hype<br />
and lose your overall focus. This is long-term planning.<br />
Take a step back and see if you can visualize the big<br />
picture.<br />
How would you describe your investment style?<br />
Moderate aggressive. I feel like I have the risk<br />
tolerance and time to invest in funds with higher<br />
risk vs. reward profiles at this point of my life.<br />
This will change as I get older and closer to<br />
retirement.<br />
What one piece of advice would you<br />
give someone regarding saving for<br />
retirement?<br />
Educate yourself and understand what you<br />
are doing with your money...understand<br />
all of your options.<br />
What one piece of<br />
advice do you wish<br />
someone had given<br />
you earlier?<br />
The sooner you start the<br />
better...and max out all of your<br />
options. You will thank yourself<br />
in the long run.<br />
6
Focus on Funds<br />
S&P 500 Index Fund and Mid Cap Equity Index Fund<br />
In this issue of Trust Talk, we will compare the S&P 500 Index Fund with the Mid Cap Equity Index Fund. Both of<br />
these Single Focus Funds are located in the mid- to upper-end of the risk/return spectrum. The comparison chart<br />
below highlights the objectives of each fund.<br />
Conservative Premixed<br />
Aggressive Premixed<br />
Premixed Portfolios<br />
Single Focus Funds<br />
Lower<br />
Risk/<br />
Lower<br />
Return<br />
Stable Value Premixed<br />
Bond Index<br />
Moderate Premixed<br />
Balanced<br />
Large Cap Growth Equity Small Cap Equity<br />
S&P 500 Index<br />
Mid Cap Equity Index<br />
Higher<br />
Risk/<br />
Higher<br />
Return<br />
Large Cap Value Equity<br />
Non-U.S. Equity<br />
<strong>Halliburton</strong> Stock<br />
Now, let’s look at the details of this portfolio as of September 30, <strong>2006</strong>.<br />
S&P 500 Index Fund<br />
The S&P 500 Index Fund is passively managed. It seeks<br />
long-term growth that approximates the risk and return of<br />
the S&P 500 Index.<br />
The S&P 500 Index Fund invests in 500 U.S. large cap<br />
companies, covering a large percentage of the shares that<br />
trade in the marketplace, even though the number of<br />
companies represented is relatively small compared to the<br />
total number of companies within the market.<br />
Investment Objective<br />
How Are They Different?<br />
Fund Composition<br />
Mid Cap Equity Index Fund<br />
The Mid Cap Equity Index Fund is passively managed. It<br />
seeks long-term growth that approximates the risk and<br />
return of the S&P MidCap 400 Index.<br />
The Mid Cap Equity Index Fund covers 400 U.S. mid cap<br />
companies with market capitalization of $1 - $4 billion, or<br />
7% of the U.S. stock market.<br />
100%<br />
100%<br />
U.S. Stocks<br />
U.S. Stocks<br />
Long-Term Potential Risk & Return<br />
Market Risk ▲ ▲ ▲ ▲<br />
Inflation Risk ▲<br />
Potential Return ▲ ▲ ▲ ▲<br />
Low Med High<br />
Market Risk ▲ ▲ ▲ ▲<br />
Inflation Risk ▲<br />
Potential Return ▲ ▲ ▲ ▲ ▲<br />
Low Med High<br />
7
Risk Assessment<br />
Should Interest Rates Interest You?<br />
Every so often, we see it in the headlines of the business section:<br />
the Federal Reserve is expected to raise (or lower) interest rates<br />
by a quarter of a percentage point. And unless you’re about to<br />
take out a mortgage, the news of changing rates probably<br />
doesn’t grab your attention. But maybe it should.<br />
Interest rates can have a more significant impact on your<br />
personal financial situation than you may think, especially<br />
when it comes to your investment portfolio. Understanding<br />
how interest rates impact the economy can give you a<br />
clearer picture of why your investments rise and fall, and<br />
may even help guide your future investing decisions.<br />
How Interest Rates Work<br />
When we hear that interest rates are changing, it<br />
means the Federal Reserve System the (“Fed”) is taking<br />
action in an effort to regulate the growth of the<br />
economy and control inflation. (See “How the Federal<br />
Reserve System Affects You” in the Winter <strong>2006</strong> issue of<br />
Trust Talk.) Rising interest rates tend to hurt bond prices<br />
because bonds bought in the past at lower interest<br />
rates become less attractive. Yet, higher interest rates<br />
can also result in higher returns when bond income is<br />
reinvested. The general rule of thumb in understanding<br />
how bonds work is that as interest rates rise, bond<br />
returns are expected to fall. As interest rates fall, bond<br />
returns tend to go up.<br />
Impact of Interest Rates on the Savings Plan<br />
When interest rates rise, the total return from bonds is<br />
likely to decline and vice versa. There are several funds<br />
in the Savings Plan that are generally more susceptible<br />
to fluctuations caused by interest rate changes. The<br />
Bond Index Fund is most sensitive to changes in<br />
interest rates because it holds 100% bonds. To<br />
some extent, the Stable Value and Conservative<br />
Premixed Portfolios are too. These<br />
Premixed Portfolios hold investment<br />
contracts which by nature will<br />
encounter a lagging effect to changes<br />
in interest rates. To a lesser extent, the<br />
Balanced Fund and Moderate Premixed<br />
Portfolio are affected by interest rates<br />
because they hold some bonds as well.<br />
While the remaining funds in the Savings Plan may<br />
show some response to changing interest rates, their<br />
broad diversification and management strategies make<br />
them less vulnerable.<br />
What Should You Do?<br />
Does the effect of interest rate changes on the Bond<br />
Index Fund, Stable Value and Conservative Premixed<br />
Portfolios mean you should completely avoid them in<br />
favor of other choices? Not necessarily. Bonds and<br />
other income-producing investments are still an<br />
important part of any well-diversified portfolio, as they<br />
help to balance out the risk of stocks losing value from<br />
other market-related factors.<br />
After two years of increasing interest rates, most<br />
experts agree that the Fed will leave them alone for the<br />
near future, or at least for the balance of <strong>2006</strong>. So how<br />
should that affect your investment decisions? If history<br />
repeats itself (of which there is no guarantee), stable<br />
rates suggest that total return of bond funds will rise<br />
again. If you’re nearing retirement and hold a large<br />
percentage of bond funds, this could be especially<br />
good news.<br />
But be warned that attempting to predict the future is<br />
risky business. The interest rate<br />
environment should not be the only<br />
factor you use to decide how you invest<br />
your money. More importantly, your<br />
investment time frame, risk tolerance,<br />
and long-term investment goals<br />
should weigh most heavily in your<br />
asset allocation. In the end,<br />
crafting a well diversified portfolio<br />
and making regular contributions<br />
over many years is the most<br />
effective way to build a financially<br />
secure retirement.<br />
8
Newsstand<br />
Market Update<br />
The third quarter proved positive across much of the<br />
U.S. and foreign stock markets and bond rates were<br />
favorable. Despite a small dip early on, the U.S.<br />
markets rallied driven by a calm inflation outlook from<br />
the Federal Reserve Board (Fed) along with a drop in<br />
oil prices. Both stocks and bonds performed well for<br />
the quarter because of the Fed’s decision to hold<br />
interest rates steady. After 17 straight increases in the<br />
Fed’s fund rate over the past two years, prime interest<br />
rates held steady at 5.25%. While the Fed held off on<br />
raising rates due to the slowing growth in the economy<br />
and the slowing housing market, a drop in gas prices at<br />
the pump helped fuel the markets.<br />
Most of the U.S. stock markets started the quarter with<br />
negative returns in July. As oil prices dropped in<br />
August, the U.S. stock<br />
markets began their<br />
rally. The markets ended<br />
the quarter with positive<br />
results in both the U.S.<br />
stock and bond markets<br />
as well as in the foreign<br />
stock market. The Dow<br />
Jones Industrial Average<br />
(Dow) briefly climbed<br />
above its all-time closing<br />
high in the last days of<br />
the quarter.<br />
Large cap stocks and<br />
value style holdings led<br />
the way in the U.S.<br />
markets outperforming<br />
small cap and growth<br />
style investments. There<br />
was a wide dispersion<br />
in performance among<br />
the major sectors of<br />
the market, with<br />
telecommunications up<br />
10.5% and energy down<br />
3.0%. The Russell 1000<br />
Value Index of large cap<br />
stocks gained 6.2% and the Russell 2000 Index of<br />
small cap stocks produced a modest 0.4% return for<br />
the quarter.<br />
In the foreign markets, value style investments also<br />
outperformed growth investments with Europe leading<br />
the region in performance for the quarter. The MSCI All<br />
Country World Index (ACWI) ex. U.S. gained 3.9% in the<br />
third quarter with consistent returns each month.<br />
Emerging markets rallied during the quarter after<br />
negative results during the second quarter. This was<br />
primarily due to strong results in the Far East. The<br />
Japanese market struggled during the third quarter<br />
losing 0.7%.<br />
Moderating inflation helped the bond market. Both<br />
short-term rates and long-term rates fell in September<br />
as the Fed held rates<br />
steady for two<br />
consecutive meetings,<br />
saying they are pausing<br />
to let the effects of<br />
previous rate increases<br />
filter through the<br />
economy. As a result,<br />
the markets interpreted<br />
this to mean that the<br />
Fed’s next move would<br />
probably be to start<br />
cutting interest rates. For<br />
the quarter, the broad<br />
Lehman Brothers<br />
Aggregate Index<br />
returned 3.8%. The major<br />
segments of the U.S.<br />
bond market produced<br />
positive returns with<br />
longer maturity bonds<br />
being the best<br />
performers. High yield<br />
and Treasury Inflation<br />
Protected Securities<br />
(TIPS) also posted gains<br />
for the quarter.<br />
9
Newsstand<br />
Retiree Corner<br />
Top Costs in Retirement<br />
A common rule of thumb is that you’ll need 70-80% of<br />
your pre-retirement income per year during your<br />
retirement years. To help you think about how much<br />
you’ll spend during retirement, and how much you need<br />
to save now, here are the most typical big-ticket costs<br />
you can expect during retirement.<br />
1. Healthcare: It’s a fact of life for most retirees. As we<br />
age, we require more trips to the doctor and more<br />
regular prescriptions, which continue to get more<br />
expensive every year with the increase in the<br />
availability of breakthrough treatments and the fact<br />
that people are living longer lives. Of course,<br />
Medicare doesn’t cover it all.<br />
2. Travel and entertainment: Since you’ll no longer<br />
spend your days at a job, you may actually increase<br />
your spending in other areas. Taking trips around the<br />
world, maintaining a regular golf habit, eating out,<br />
and making road trips aren’t cheap.<br />
3. Housing: You’ll still need a roof over your head and<br />
food on the table. With inflation, those things will<br />
cost more years from now than they do today. And<br />
these days, fewer Americans are staying put long<br />
enough to pay off their homes. In fact, many<br />
increase their housing costs in retirement by buying<br />
that dream home or waterfront property.<br />
4. Living assistance: At some point, a large<br />
percentage of people have to pay for some type of<br />
assisted living arrangement, such as a nursing home<br />
or home health care. In your early retirement years,<br />
you may help your aging parents with the expense;<br />
later, you may need the care yourself.<br />
5. Savings: That’s right, even after you’re retired, you’ll<br />
probably need to continue socking away and/or<br />
continuing to invest money for the long road of<br />
retirement. With life expectancies getting longer, you<br />
could be looking at 30 years or more with no job.<br />
Even if you’ve been a dedicated saver, you may not<br />
have enough to last throughout retirement by the<br />
time you reach retirement age.<br />
10
Fund Performance Update<br />
<strong>Halliburton</strong> Company Employee Benefit Master Trust<br />
for the period ended September 30, <strong>2006</strong><br />
General investment policy<br />
Balanced Fund Aggressive Moderate Conservative<br />
U.S. stocks 65.0% 70.0% 43.0% 26.0%<br />
Russell 3000 Index<br />
Non-U.S. stocks — 22.5% 14.0% 9.0%<br />
MSCI EAFE Index<br />
Emerging market stocks — 7.5% 5.0% 3.0%<br />
MSCI Emerging Market Free Index<br />
U.S. broad market bonds 35.0% — 33.0% 20.0%<br />
Lehman Aggregate Bond Index<br />
U.S. high yield bonds — — 5.0% 4.0%<br />
Merrill Lynch High Yield Bond Index<br />
iMoneyNet Money Market Fund Average — — — 38.0%<br />
Performance<br />
10 Years* 5 Years* 3 Years* 1 Year 3rd Quarter<br />
PREMIXED PORTFOLIOS<br />
Stable Value Premixed Portfolio (SVPP) 6.1% 5.1% 5.0% 5.2% 1.3%<br />
iMoneyNet Money Market Fund Average 3.4% 1.8% 2.3% 4.2% 1.2%<br />
Conservative Premixed Portfolio (CPP) 7.2% 7.5% 8.6% 6.3% 2.7%<br />
CPP Index Composite 6.3% 6.3% 8.0% 7.5% 3.1%<br />
Moderate Premixed Portfolio (MPP) 8.3% 9.5% 12.2% 9.2% 3.6%<br />
MPP Index Composite 7.9% 9.1% 11.7% 9.7% 4.3%<br />
Aggressive Premixed Portfolio (APP) 8.6% 10.6% 16.1% 11.7% 3.2%<br />
APP Index Composite 8.4% 11.0% 16.4% 13.1% 4.5%<br />
SINGLE FOCUS FUNDS<br />
Bond Index Fund 6.2% 4.7% 3.3% 3.7% 3.8%<br />
Lehman Aggregate Bond Index 6.4% 4.8% 3.4% 3.7% 3.8%<br />
Balanced Fund 9.9% 9.3% 12.4% 10.4% 5.1%<br />
Balanced Fund Index Composite 8.2% 7.2% 9.6% 7.9% 4.4%<br />
Large Cap Value Equity Fund 10.6% 10.0% 15.9% 11.2% 4.1%<br />
Russell 1000 Value Index 11.2% 10.7% 17.2% 14.6% 6.2%<br />
S&P 500 Index Fund 8.5% 6.9% 12.2% 10.7% 5.7%<br />
S&P 500 Index 8.6% 7.0% 12.3% 10.8% 5.7%<br />
Large Cap Growth Equity Fund 5.8% 3.5% 9.4% 6.9% 3.4%<br />
Russell 1000 Growth Index 5.5% 4.4% 8.4% 6.0% 3.9%<br />
Non-U.S. Equity Fund 8.3% 15.0% 23.3% 18.9% 3.2%<br />
MSCI ACWI ex. U.S.** 7.1% 14.8% 23.2% 18.9% 3.9%<br />
Mid Cap Equity Index Fund 13.3% 12.9% 15.1% 6.5% -1.0%<br />
S&P MidCap 400 Index 13.4% 13.1% 15.2% 6.6% -1.1%<br />
Small Cap Equity Fund 8.3% 10.2% 12.5% 6.8% -0.9%<br />
Russell 2000 Index 9.1% 13.8% 15.5% 9.9% 0.4%<br />
<strong>Halliburton</strong> Stock Fund 9.5% 21.3% 33.3% -16.0% -22.6%<br />
*Annualized.<br />
**Returns prior to January 1, 2005, include MSCI EAFE Index, the previous Fund benchmark.<br />
11
Performance Notes<br />
The Bond Index, Balanced, Large Cap Value Equity,<br />
S&P 500 Index, Large Cap Growth Equity, Non-U.S.<br />
Equity, and Small Cap Equity Funds were not in<br />
existence until April 1, 1999. The Mid Cap Equity Index<br />
Fund was not in existence until January 1, 2005. The<br />
Conservative Premixed Portfolio was introduced<br />
January 1, <strong>2006</strong>.<br />
In order to provide comparative historical returns, the<br />
managers’ return of their <strong>Halliburton</strong> Trust account is<br />
shown. If the <strong>Halliburton</strong> Trust had not employed a<br />
manager for the periods presented, the firm’s<br />
composite account return was added. All rates of<br />
return are net of expenses. Your rate of return may vary<br />
depending on your account activity (e.g., contributions,<br />
withdrawals, transfers, loans, etc.) and your plan’s<br />
administration expenses.<br />
To help you better understand how your funds are<br />
performing, the funds are compared with composite<br />
returns or with appropriate indexes. The composites<br />
are created by blending together index returns in<br />
proportion to the investment policy of each fund (see<br />
chart). Because there are no indexes comparable to<br />
the Stable Value Premixed Portfolio’s investments, we<br />
compare its return with money market funds tracked by<br />
iMoneyNet.<br />
Performance data represents past performance; no<br />
assurance can be made regarding future results.<br />
Index Definitions*<br />
iMoneyNet Money Market Fund Average is an index of<br />
over 700 money market funds.<br />
Lehman Aggregate Bond Index is an index of U.S.<br />
bonds, including government, corporate, mortgagebacked,<br />
and asset-backed securities.<br />
Merrill Lynch High Yield Bond Index is an index of U.S.<br />
corporate bonds that are rated less than investment<br />
grade but are not in default.<br />
MSCI (Morgan Stanley Capital International) All<br />
Country World Index (ACWI) ex. U.S. is an index of<br />
non-U.S. equity securities listed on the stock<br />
exchanges of developed and emerging markets.<br />
MSCI EAFE Index is an index of non-U.S. equity<br />
securities listed on the stock exchanges of Europe,<br />
Australasia, and the Far East.<br />
MSCI Emerging Market Free Index is an index of non-<br />
U.S. equities traded in emerging markets.<br />
Russell 1000 Growth Index focuses on the 1,000 largest<br />
companies in the Russell 3000 Index that have lower<br />
dividend yields and above-average growth rates.<br />
Russell 1000 Value Index focuses on the 1,000 largest<br />
companies in the Russell 3000 Index that have higher<br />
dividend yields and below-average growth rates.<br />
Russell 2000 Index measures the performance of the<br />
2,000 smallest companies in the Russell 3000 Index.<br />
Russell 3000 Index measures the performance of the<br />
3,000 largest U.S. companies based on total market<br />
capitalization. It is used as a general measure of U.S.<br />
stock market performance.<br />
Standard & Poor’s 500 Index is a popular standard for<br />
measuring large-cap U.S. stock market performance.<br />
The index includes a representative sample of 500<br />
leading companies in prominent industries.<br />
Standard & Poor’s MidCap 400 Index is a popular<br />
standard for measuring mid-cap U.S. stock market<br />
performance. The index includes a representative<br />
sample of 400 leading companies in prominent<br />
industries with a market capitalization of approximately<br />
$1 - $4 billion.<br />
*You cannot invest in any of these indexes. Fund holdings will differ<br />
from index holdings.<br />
12
10200 Bellaire Blvd.<br />
Houston, TX 77072<br />
We encourage you to call the<br />
Trust Investments Department<br />
with any suggestions or<br />
comments regarding Trust<br />
Talk. You can expect the next<br />
issue in February 2007.<br />
H000044730 11/06<br />
PRSRT STD<br />
US POSTAGE<br />
PAID<br />
DALLAS, TX<br />
PERMIT 2650