Observing Variable Stars - Gymnasium und Fachmittelschule Thun ...
Observing Variable Stars - Gymnasium und Fachmittelschule Thun ...
Observing Variable Stars - Gymnasium und Fachmittelschule Thun ...

You also want an ePaper? Increase the reach of your titles
YUMPU automatically turns print PDFs into web optimized ePapers that Google loves.
Matura paper<br />
<strong>Gymnasium</strong> <strong>Thun</strong> Seefeld BE<br />
<strong>Observing</strong> <strong>Variable</strong> <strong>Stars</strong><br />
Measuring changes of brightness of variable stars with<br />
photographs<br />
Illustration 1<br />
a paper by: Daniel Bernet (1984)<br />
<strong>und</strong>er the assistance of: Dr. Ekkehard Stürmer<br />
co-marker: Dr. Roger Spring<br />
2002 / 2003
Matura paper<br />
Daniel Bernet<br />
<strong>Observing</strong> <strong>Variable</strong> <strong>Stars</strong> November 2003<br />
Table of Content<br />
1. PREFACE............................................................................................................3<br />
2. INTRODUCTION .................................................................................................4<br />
3. OBSERVING VARIABLE STARS .......................................................................6<br />
3.1 ASSUMPTION ...................................................................................................6<br />
3.2 SELECTING A VARIABLE STAR ............................................................................6<br />
3.3 TAKING PHOTOGRAPHS.....................................................................................7<br />
3.4 TAKING NOTES .................................................................................................8<br />
3.5 ANNOTATIONS..................................................................................................8<br />
4. EVALUATION......................................................................................................9<br />
4.1 MEASURING PRINTS..........................................................................................9<br />
4.2 BRIGHTNESS INDEX ..........................................................................................9<br />
4.3 PLOTTING GRAPHS .........................................................................................10<br />
4.4 EVALUATING THE BRIGHTNESS OF A VARIABLE STAR ..........................................10<br />
4.5 ANNOTATIONS................................................................................................10<br />
5. PRACTICAL TEST ............................................................................................12<br />
5.1 SELECTION ....................................................................................................12<br />
5.2 OBSERVATIONS MADE.....................................................................................12<br />
5.3 RESULTS .......................................................................................................13<br />
5.4 ACCURACY ....................................................................................................14<br />
5.5 INTERPRETATION............................................................................................15<br />
6. PROBLEMS.......................................................................................................16<br />
6.1 MEASURING DIFFICULTIES ...............................................................................16<br />
6.2 OBSERVING CONDITIONS.................................................................................17<br />
6.3 SENSITIVITY OF THE FILM ................................................................................17<br />
6.4 VIGNETTING EFFECT .......................................................................................18<br />
6.5 DOUBLE STARS ..............................................................................................18<br />
6.6 SELECTING A VARIABLE STAR ..........................................................................18<br />
7. CONCLUSION...................................................................................................19<br />
8. SUMMARY ........................................................................................................21<br />
9. REFERENCES ..................................................................................................22<br />
9.1 GLOSSARY ....................................................................................................22<br />
9.2 REFERENCES.................................................................................................24<br />
9.3 ILLUSTRATIONS ..............................................................................................25<br />
9.4 TABLES .........................................................................................................25<br />
10. APPENDICES....................................................................................................26<br />
10.1 SETTINGS......................................................................................................26<br />
10.2 EVALUATED PHOTOGRAPHS ............................................................................27<br />
10.3 OBSERVATION FORM ......................................................................................34<br />
10.4 EVALUATION FORM .........................................................................................35<br />
<strong>Gymnasium</strong> <strong>Thun</strong> Seefeld Page 2
Matura paper<br />
Daniel Bernet<br />
<strong>Observing</strong> <strong>Variable</strong> <strong>Stars</strong> November 2003<br />
1. Preface<br />
During the first half of my junior year at the <strong>Gymnasium</strong> <strong>Thun</strong> Seefeld I was trying<br />
hard to find a subject, in which I had enough interest and which could fulfill the requirements<br />
of a topic that would enable me to do some real scientific observations<br />
and investigations. As the deadline drew nearer when we had to decide what our<br />
Matura paper topic would be, I grew sure that it would be a topic about astronomy.<br />
Since Dr. Ekkehard Stürmer was my Physics teacher at that time, I didn’t wait to ask<br />
for his valuable opinion on my ideas for a suitable topic. My suggestions were that I<br />
could research the moon-landing hoax, whether mankind was on the moon or not. It<br />
was a topic which I was really interested in, but in conversation with Mr. Stürmer it<br />
became clear that it would be much more of a literature research paper than a subject<br />
I could do much of my own thinking with scientific investigations involved.<br />
Mr. Stürmer had a couple of very interesting and suitable suggestions for a topic in<br />
the field of Astronomy and I grew extremely fond of one of those proposals. Mr.<br />
Stürmer was telling me about stars that change brightness in different periods. Those<br />
variable stars, as they are called, could be observed and a light curve could be the<br />
result of a long-term observation. The advantages of such a topic were, that I could<br />
do some real scientific investigations, since the changes of brightness of those stars<br />
are not always predictable.<br />
That’s how I got this topic as my Matura paper subject. It was really a great choice,<br />
because I didn’t know much about variable stars before, which made my work exciting<br />
and very interesting. I could work scientifically and it wouldn’t interfere with my<br />
plans of going to the United States for a year either.<br />
On 8 th August 2002 I left Switzerland and spent the following whole school year in the<br />
United States. Until then, I invested quite a lot of time on my Matura paper. I took all<br />
the material with me and I thought that I could continue to work on my Matura paper<br />
whenever I would have had free time. For the whole first semester I didn’t touch any<br />
of my papers. The following year though, early summer 2003, I took a couple of pictures,<br />
which made a long-term observation of the one particular variable star I was<br />
working with very interesting.<br />
I had some trouble getting back to work when I returned from the US. It wasn’t easy<br />
to get used to the normal life back in Switzerland and I just left my Matura paper<br />
aside for a couple of weeks. Sometime during summer vacation I had a meeting with<br />
Mr. Stürmer once more and that gave me enough motivation to go on and advance. It<br />
was also then, that I decided I would write the Matura paper in English and not in<br />
German, although I knew that it could be some kind of barrier, since there are a lot of<br />
technical terms involved and I didn’t know how well I could express the matter in<br />
English. Despite those difficulties I knew it would be worth the challenge.<br />
Here, I would like to thank Dr. Ekkehard Stürmer very much for all the great advice<br />
and helpful inputs I got from him during the whole process of development of my<br />
Matura paper. I also thank my co-marker Dr. Roger Spring for his valuable contribution.<br />
<strong>Gymnasium</strong> <strong>Thun</strong> Seefeld Page 3
Matura paper<br />
Daniel Bernet<br />
<strong>Observing</strong> <strong>Variable</strong> <strong>Stars</strong> November 2003<br />
2. Introduction<br />
Many people think of the stars as something constant, durable and everlasting. Before<br />
I had written this paper, me too, I thought of something steady and unvarying<br />
when I was gazing up at the sky and was in awe by those beautiful stars. As many<br />
others, I was totally wrong. Uncountable stars were just in the process of changing<br />
brightness at the instant I was thinking, if everything were different at least the stars<br />
would be the same.<br />
I had to adjust my belief and learned that there exist so-called variable stars. These<br />
stars are defined as “stars that change brightness” 1 , as the word variable already implies.<br />
I also learned that there are many different kinds of variable stars, which<br />
change brightness because of very different reasons and they all have unlike periods<br />
2 .<br />
“The first astronomer to study variable stars seriously was a German named F.W.A.<br />
Argelander (1799-1875)” 3 . He developed the so-called “Argelander Method for Visual<br />
<strong>Variable</strong> Star Brightness Estimation” 4 . This system is, like the method called “Measuring<br />
<strong>Variable</strong> <strong>Stars</strong> Visually” 5 developed by the American Association of <strong>Variable</strong><br />
<strong>Stars</strong> Observers AAVSO, based on the naked-eye comparison between the variable<br />
star and its surro<strong>und</strong>ing stars. With the trained eye of the observer the variable star is<br />
compared to stars whose brightness are known each time it is examined. With those<br />
relations to other stars an estimate of the variable star’s brightness can be made.<br />
The disadvantage of this method is, that there is no objective way of proving that a<br />
star actually did have a particular brightness on a particular day.<br />
There are other methods that don’t have such a disadvantage, such as using chargecoupled<br />
devices (CCD) 6 or photoelectric photometry (PEP) 7 , which are both extremely<br />
accurate and reliable. Unfortunately those methods are very time-consuming<br />
and expensive.<br />
Since no instruments are necessary for the visual methods to estimate variable star’s<br />
brightness, many amateur observers utilize it. Using those visual methods, one can<br />
make fast and reliable observations without much expense. But still, the disadvantage<br />
remains that no prove exists, of where the estimates of the brightness of the<br />
variable star are coming from after the observations have been made.<br />
Exactly this disadvantage of the visual methods, which doesn’t allow you to confirm<br />
the values after the observations were made, leads to the purpose of my Matura paper.<br />
My goal is to develop a method, which enables me to observe variable stars in a<br />
way that provides some proof of where those estimates of the brightness of variable<br />
stars are derived from. I don’t know, whether anybody else started an attempt in this<br />
direction before, since I couldn’t find any sources or even hints of anything like that.<br />
Using this method I will observe one particular variable star over a longer period of<br />
time and explain what steps I took to estimate its brightness. Furthermore I will discuss<br />
the problems and difficulties I had using this technique, and show how accurately<br />
it worked. The main question of my Matura paper is therefore whether I can<br />
measure changes of brightness of variable stars with my own method.<br />
My method is based on so-called star trail photographs. Such photographs are created<br />
when the film in a camera is exposed to the light of the stars over a longer pe-<br />
<strong>Gymnasium</strong> <strong>Thun</strong> Seefeld Page 4
Matura paper<br />
Daniel Bernet<br />
<strong>Observing</strong> <strong>Variable</strong> <strong>Stars</strong> November 2003<br />
riod of time. Since the Earth is rotating, there won’t be just little dots on the picture as<br />
we see them when we look up at the sky, but lines created by the stars that seem to<br />
move over the film.<br />
I assume that there is a connection between the widths of those star trails on the<br />
photograph and the brightness of the stars. This is essential because I will measure<br />
the widths of the star trails and relate those values to the apparent magnitude of surro<strong>und</strong>ing<br />
stars. The number I’m looking for is an estimate of the apparent brightness<br />
of the observed variable star at different times. Since I can measure the width of the<br />
star trail of the variable star I can calculate an estimate of the absolute magnitude of<br />
the variable star using the relation of the surro<strong>und</strong>ing star’s brightness and their corresponding<br />
widths of the star trails.<br />
A further objective of my Matura paper is not to just finding a different method to observe<br />
variable stars, but to do scientific work, to learn something new about this interesting<br />
topic and to present all that in my final written paper.<br />
That’s why the most important part of my whole Matura paper isn’t just the final<br />
document but the whole process of fulfilling this interesting but very challenging task.<br />
Illustration 2: This is a time exposure photograph,<br />
a so-called star trail picture, which is<br />
created when the film gets exposed to the light<br />
of the stars for a longer period<br />
Illustration 3: This is a photograph which<br />
wasn’t exposed long enough so that a star trail<br />
picture could result. Such pictures wouldn’t be<br />
very helpful, because it would be hard to determine<br />
the representative diameters of the<br />
light dots.<br />
<strong>Gymnasium</strong> <strong>Thun</strong> Seefeld Page 5
Matura paper<br />
Daniel Bernet<br />
<strong>Observing</strong> <strong>Variable</strong> <strong>Stars</strong> November 2003<br />
3. <strong>Observing</strong> <strong>Variable</strong> <strong>Stars</strong><br />
In this chapter I will explain what steps I took to observe variable stars with the<br />
method I developed. First I will talk about the assumption on which my whole method<br />
is based, as mentioned in the introduction. Further I will report with which criteria I<br />
selected the variable star to be observed and how and with what equipment I took<br />
photographs.<br />
Illustration 4: Those differently bright stars clearly have star<br />
trails of unlike widths.<br />
brightness of the star and the width of the star trail on the photograph.<br />
3.1 Assumption<br />
In order to prove changes of brightness of variable stars with my method of using<br />
photographs, it is essential<br />
that there is a connection<br />
between the width of the star<br />
trails on the pictures and the<br />
absolute magnitude of the<br />
appropriate star. If there is<br />
no relationship between<br />
those two values, then my<br />
method won’t work at all,<br />
since my method measures<br />
the widths of the star trails<br />
and relates those values to<br />
the star’s real brightness.<br />
I assumed that there must be<br />
a link between those two<br />
values.<br />
With the first couple of pictures<br />
I took, it became obvious<br />
that there must be <strong>und</strong>oubtedly<br />
some kind of a<br />
relationship between the<br />
3.2 Selecting a variable star<br />
I fo<strong>und</strong> it is quite important that there is a well-considered selection of the variable<br />
star to be observed. There are many factors which influence whether a star can be<br />
observed at all at a particular place on a certain date. First of all, the star has to rise<br />
sometime during the night when it’s dark enough. It can occur for example that the<br />
desired star rises just before dawn or sets right after dusk, so that it is impossible to<br />
take good pictures, since it has to be really dark to get a good contrast between the<br />
star’s light and the dark sky. Bad contrast on the photographs proved to be a real<br />
problem during the process of evaluation, as I will explain later.<br />
Secondly, the time when photographs were taken, the sky was supposed to be<br />
moonless, for the same reason of contrast between the star’s light and the backgro<strong>und</strong>.<br />
The moon could lighten up the sky very well, so that the stars were hard to<br />
see, identify and evaluate on the photographs later on. The moon’s influence was<br />
<strong>Gymnasium</strong> <strong>Thun</strong> Seefeld Page 6
Matura paper<br />
Daniel Bernet<br />
<strong>Observing</strong> <strong>Variable</strong> <strong>Stars</strong> November 2003<br />
Illustration 5: Although the photograph<br />
is a little bit overexposed, it exemplifies<br />
that no stars surro<strong>und</strong>ing the moon are<br />
visible<br />
less significant when the moon was located far away from the variable star. As a result,<br />
when a variable star was located in the west and the moon was rising in the<br />
east, it was possible to make pretty good photographs<br />
anyways.<br />
Thirdly, the star couldn’t be behind any objects<br />
such as mountains. This depended on<br />
the declination of the chosen variable star. If<br />
its declination was not high enough, it occurred<br />
that the star couldn’t be observed all<br />
year aro<strong>und</strong> (as was the case with the variable<br />
star I was observing).<br />
Last but not least, the variable star had to be<br />
bright enough to be discovered without much<br />
difficulty and possibly without a telescope or<br />
binoculars, since only stars up to a certain<br />
absolute magnitude could be seen on the pictures,<br />
depending on the focal length of the<br />
lens and the sensitivity of the film. If I was using<br />
a 135mm lens for example, I was able to<br />
identify most of the stars up to an absolute<br />
brightness of approximately 7 or 8 magnitudes.<br />
Of course it was also essential that the star<br />
was changing its brightness during the course of the observations. For that matter<br />
the homepage of the magazine Sky and Telescope 8 or a star calendar 9 was very<br />
useful.<br />
3.3 Taking photographs<br />
When I had selected the variable star to be observed, I had to look for all the necessary<br />
equipment. I needed a reflex camera with a shutter and a shutter-release cable,<br />
so that I could expose the film for any desirable length of time. A role of film was<br />
needed too, which had to have a sensitivity of at least 200 ASA. Additionally a tripod<br />
was necessary, on which I could mount and fix the camera. Without a tripod I wasn’t<br />
able to take nice star trail photographs because the camera had to remain completely<br />
motionless. Even the slightest movement of the tripod resulted in very curvy pictures.<br />
When the weather conditions allowed, I went outside, set all the equipment up at a<br />
dark spot, away from house, street and other artificial light sources. A map of the<br />
night sky could help to find the desired star. To find direction, a compass was very<br />
helpful, too.<br />
When the camera was mounted on the tripod and the tripod was well balanced and<br />
fixed, I had to set the lens to infinity and I adjusted the aperture setting according to<br />
the darkness of the night. When the night was moonless and very dark, I opened the<br />
aperture all the way but when night had not quite yet fallen completely, I left the aperture<br />
mechanism approximately halfway open. I think it was helpful to take a couple of<br />
pictures just to experience what effect the aperture setting could have.<br />
As soon as the desired star was located, I centered it in the finder of the camera, the<br />
tripod had to be set so that the camera couldn’t move while the shutter would be<br />
opened. The exposure time was set to individual time (on most reflex cameras it is<br />
represented by a capital letter B). Then I released the trigger with the shutter-release<br />
<strong>Gymnasium</strong> <strong>Thun</strong> Seefeld Page 7
Matura paper<br />
Daniel Bernet<br />
<strong>Observing</strong> <strong>Variable</strong> <strong>Stars</strong> November 2003<br />
cable and I usually left the shutter opened for approximately five minutes. The time of<br />
exposure could be set shorter too, but as the period of exposure is decreased, the<br />
star trails shrink simultaneously. I fo<strong>und</strong> that for my purposes five minutes was a<br />
good value, since the star trails were long enough. If the star trails had been too<br />
short, for example when pictures of stars with high declinations (near the celestial<br />
poles) are made, the time of exposure should have been increased.<br />
Illustration 6: Already very<br />
slight movements of the tripod<br />
can result in such curvy star<br />
trails.<br />
3.4 Taking notes<br />
While taking the photographs, I made notes all along. Without the notes I would have<br />
been lost, because I couldn’t identify which photograph was which and what was<br />
supposed to be on it. In the appendices, chapter 10, the form can be fo<strong>und</strong> which I<br />
used while I was taking the pictures. Some categories such as location, date, time,<br />
lens, exposure time and subject were very useful. It made the identification of the<br />
pictures themselves but also of particular stars on the photographs much easier.<br />
The fact, that it is possible to reconstruct which picture was taken at which time, can<br />
be of great value, when a special event occurred for example. The date of the picture<br />
taken was also important, because I used it in the long-term observation of the variable<br />
star to create a light curve.<br />
3.5 Annotations<br />
It became clear that the process of taking photographs was very important and<br />
shouldn’t be <strong>und</strong>erestimated. When I didn’t pay attention and didn’t do it with patience,<br />
it was much harder to evaluate the prints. I had difficulties especially when I<br />
was measuring the widths of the star trails.<br />
Overall it is very exciting to go out in the dark and take pictures of those marvelous<br />
stars. While the camera couldn’t be touched because pictures were taken, I fo<strong>und</strong> it<br />
very relaxing and appealing to gaze up at the sky and enjoy the overwhelming sight.<br />
<strong>Gymnasium</strong> <strong>Thun</strong> Seefeld Page 8
Matura paper<br />
Daniel Bernet<br />
<strong>Observing</strong> <strong>Variable</strong> <strong>Stars</strong> November 2003<br />
4. Evaluation<br />
This chapter is concerned with the evaluation of the pictures taken. All the data I collected<br />
was used to plot diagrams and finally make an estimate of the variable star’s<br />
brightness. I will also show how I evaluated the long-term observation. For this matter<br />
I used Excel 2000 since the possibilities of this program were very helpful to plot all<br />
the graphs and evaluate the data.<br />
4.1 Measuring prints<br />
To be able to make any measurements of the widths of the star trails on a photograph,<br />
I borrowed a microscope, which was very helpful. If no such instrument had<br />
been available, it would have been very difficult to measure well and reliably.<br />
I think the best way was to measure the width of those star trails with measuring<br />
eyepiece. This enabled me to see gridlines lines on the photographs and it was easy<br />
to get the values. It would have been also possible though, to use a very small ruler<br />
and lay it right on the picture <strong>und</strong>er the microscope but by doing it this way, it would<br />
have taken much more time since a ruler has the tendency not to stay where it<br />
should.<br />
Once I hade adjusted the microscope so that I could see a clear image of the photograph,<br />
I focused on a particular star trail of a known star, measured it several times in<br />
different places and took the average.<br />
Basically I tried to find the exact beginning and end of the width of the lines, which<br />
can prove to be quite difficult, depending on how good the contrast between the star<br />
trails and the backgro<strong>und</strong> is. It was also helpful to try out some different lenses on the<br />
microscope to get the lens, which I was most comfortable with and which got me the<br />
best results.<br />
I measured a sufficient number of identifiable stars on the photograph and filled the<br />
values in a table which I registered the width of each star trail with. This form I utilized<br />
can also be fo<strong>und</strong> in chapter 10, Appendices.<br />
4.2 Brightness index<br />
Since stars with different declinations “move” with unlike speeds, namely stars with<br />
higher declinations shift slower, while stars with smaller declinations have bigger<br />
speeds, they also trail with different velocities over the film. The slower a star travels<br />
over the film, the more photons have a chance to react with the film when the time of<br />
exposure is kept constant. That means, if two stars have the same brightness but<br />
travel with different speeds, the star trail of the faster star will be narrower. If I had<br />
related the width of the star trails directly to the apparent magnitude of the stars,<br />
there would have always been an error, since stars with greater declinations would<br />
be too bright compared to stars with smaller declinations. That’s why I had to multiply<br />
each width of the star trails by the cosine of their declination, which gives me a socalled<br />
brightness index.<br />
<strong>Gymnasium</strong> <strong>Thun</strong> Seefeld Page 9
Matura paper<br />
Daniel Bernet<br />
<strong>Observing</strong> <strong>Variable</strong> <strong>Stars</strong> November 2003<br />
4.3 Plotting graphs<br />
Using the program Excel, I made a table with all relevant data such as the star<br />
names, their apparent magnitudes and their corresponding brightness indices. When<br />
I had everything set up, I plotted a graph with the data of all stars except the variable<br />
star for each photograph. The x-axis corresponded to the brightness index of the star<br />
trails and the y-axis represented the corresponding apparent brightness.<br />
I fo<strong>und</strong> that all points of the differently bright stars fell on a straight line with relatively<br />
small deviations. That’s why I could draw a line of best fit through all those points. I<br />
made such a graph for each picture I wanted to use to make an estimate on the<br />
brightness of the variable star.<br />
4.4 Evaluating the brightness of a variable star<br />
To finally make an estimate on the brightness of a variable star, I used the equation<br />
of the line of best fit, which I could easily calculate, together with the brightness index<br />
of the variable star. I could not, of course, calculate it directly, since the desired value<br />
of the apparent brightness wasn’t given. That’s why the formula to get an estimate of<br />
the apparent magnitude is derived as follows:<br />
y = ax + b<br />
where y = y-value (apparent magnitude), x = x-value (brightness index), a = slope of<br />
the line of best fit, b = constant<br />
The y-value, representing the variable star’s apparent magnitude, is the desired number.<br />
Since the equation of the line of best fit is known, therefore a and b are given,<br />
and the brightness index, the x-value, was calculated too, I could paste all those values<br />
and compute y and get therefore an estimate of the variable star’s brightness for<br />
each evaluated photograph and plotted graph.<br />
4.5 Annotations<br />
The process of evaluation could be shortened quite a bit once all the data was entered<br />
in a spreadsheet using Excel. When it was set up, this program had features<br />
that allowed entering only the width of the star trails of the stars and it calculated everything<br />
by itself. That was very practical and helpful.<br />
<strong>Gymnasium</strong> <strong>Thun</strong> Seefeld Page 10
Matura paper<br />
Daniel Bernet<br />
<strong>Observing</strong> <strong>Variable</strong> <strong>Stars</strong> November 2003<br />
0<br />
Evaluation diagram<br />
1<br />
Apparent brightness<br />
2<br />
3<br />
4<br />
5<br />
y = -0.1908x + 5.5086<br />
6<br />
0 5 10 15 20 25 30<br />
Brightness index<br />
measurements estimate of Delta Scorpii Linear (measurements)<br />
Illustration 7: For each photograph I used for the evaluation, I made such a diagram. With the formula<br />
of the line of best fit and the appropriate brightness index of the variable star I could make an<br />
estimate on its brightness. In this example the brightness index of Delta Scorpii equals 16.6. Therefore<br />
the estimate for the variable star’s brightness is:<br />
y = -0.1908x + 5.5086 where y = the apparent magnitude and x = brightness index<br />
y = -0.1908 · 16.6 + 5.5086<br />
y = 2.34<br />
So the estimate for the variable star’s brightness would be 2.34 magnitudes.<br />
<strong>Gymnasium</strong> <strong>Thun</strong> Seefeld Page 11
Matura paper<br />
Daniel Bernet<br />
<strong>Observing</strong> <strong>Variable</strong> <strong>Stars</strong> November 2003<br />
5. Practical Test<br />
In chapter six I will show how my method worked when applied to a selected variable<br />
star. For over a year I made over fifty star trail photographs, including eight good<br />
photographs I could use for further evaluations of a particular variable star’s brightness.<br />
Those eight photographs were complemented by three pictures, which Mr.<br />
Stürmer had taken a long time ago. Having quite a lot of measurements I could draw<br />
a nice light curve of this particular variable star.<br />
I will present the results of my observations and also compare my values with the<br />
data obtained by professional and other independent observers.<br />
5.1 Selection<br />
Just aro<strong>und</strong> the time when I had to choose the topic I was going to investigate for my<br />
Matura paper, there was news about the star Delta in the constellation Scorpio. This<br />
message was posted on the homepage of the British magazine Sky and Telescope:<br />
“Delta Scorpii Brighter Than Ever<br />
By Alan M. MacRobert<br />
February 4, 2002 Most skywatchers think of Scorpius as a summer constellation (in<br />
the Northern Hemisphere), but early risers get a preview of the Scorpion climbing the<br />
southeastern sky before dawn during winter. It's there right now — and it doesn't look<br />
normal. The star Delta Scorpii remains unusually bright, more than a year and a half<br />
after beginning an unexpected flareup” 10 .<br />
Delta Scorpii wasn’t known as a variable star before the year 2000. Since the star<br />
was bright (almost as bright as the brightest star Antares in the constellation Scorpion),<br />
easy to find and at this point of time easy to observe, I decided to have an eye<br />
on it.<br />
Also, I thought this star was quite interesting, since it was not very predictable what<br />
was going to happen with its brightness due to the fact that Delta Scorpii wasn’t even<br />
supposed to change its magnitude.<br />
As I explained in the introduction, one of my goals was to do some real scientific investigations.<br />
Since this star would enable me to do so and also could fulfill all the<br />
other necessities, I finally chose this star for my long-term observation.<br />
5.2 Observations made<br />
The first two pictures were taken in 1984 by Mr. Stürmer and back in those days the<br />
star didn’t count as a variable star and was noted with an absolute brightness of 2.3<br />
magnitudes 10 . The brightness of Delta Scorpii, which I calculated, has a magnitude of<br />
2.03 and 2.47. Those values represent the apparent brightness at this point of time<br />
quite accurately. The next photograph was taken six years later in 1990 and the estimated<br />
value is 2.34 magnitudes, which is very precise.<br />
<strong>Gymnasium</strong> <strong>Thun</strong> Seefeld Page 12
Matura paper<br />
Daniel Bernet<br />
<strong>Observing</strong> <strong>Variable</strong> <strong>Stars</strong> November 2003<br />
The first picture I took by myself predicted an absolute brightness of 1.77 magnitudes.<br />
The next estimate jumped up to 1.63 magnitudes. The next four estimates<br />
fluctuated quite a lot with a general decreasing tendency to get darker down to an<br />
absolute brightness of 1.91 magnitudes. This estimate came from the last photograph<br />
I took in 2002 (06.07.02). In August 02, I went to the United States and the<br />
useable photograph, which I made there, was taken in late June 03 and predicted a<br />
brightness of 1.56 magnitudes.<br />
5.3 Results<br />
Once I had calculated all the estimates of the absolute magnitude of Delta Scorpii, I<br />
wanted to compare those values with values of independent observers. Luckily the<br />
magazine Sky and Telescope printed a light curve of Delta Scorpii’s brightness in<br />
their August edition of 2003, which was made with data of different observers 11 .<br />
I used this data to plot a diagram of Delta Scorpii’s brightness over time. I pasted all<br />
my estimates and compared the professional light curve with the data obtained by my<br />
observations.<br />
Since the light curve in the magazine was made with the data of different observers,<br />
there is a range of different values of Delta Scorpii’s brightness at the same points of<br />
time. I plotted the extremes of these values to show in what range Delta Scorpii’s<br />
brightness was supposed to be.<br />
Apparent brightness<br />
1<br />
1.2<br />
1.4<br />
1.6<br />
1.8<br />
2<br />
2.2<br />
2.4<br />
2.6<br />
2.8<br />
Light curve of Delta Scorpii, Overview<br />
3<br />
1.4.02 1.6.02 1.8.02 1.10.02 1.12.02 1.2.03 3.4.03 3.6.03<br />
Date<br />
own observations independent observations min independent observations max<br />
Illustration 8: This diagram is an overview of how well my own observations match the data obtained<br />
by professional observers<br />
<strong>Gymnasium</strong> <strong>Thun</strong> Seefeld Page 13
Matura paper<br />
Daniel Bernet<br />
<strong>Observing</strong> <strong>Variable</strong> <strong>Stars</strong> November 2003<br />
Apparent brightness<br />
1.5<br />
1.55<br />
1.6<br />
1.65<br />
1.7<br />
1.75<br />
1.8<br />
1.85<br />
1.9<br />
1.95<br />
Light curve of Delta Scorpii, Details<br />
2<br />
1.4.02 1.6.02 1.8.02 1.10.02 1.12.02 1.2.03 3.4.03 3.6.03<br />
Date<br />
own observations independent observations min independent observations max<br />
Illustration 9: This is the same diagram as illustration 8, but it is magnified, so that details can be<br />
seen.<br />
My measurements fit the data of independent observers well. As can be seen from<br />
the diagrams, the brightness of Delta Scorpii was changing a lot during the time I was<br />
observing. The spread of the estimated brightness by the professional observers is<br />
quite large, especially in November 2002. Most of my estimates are really close to or<br />
even within the range given by the data of other observers. A couple of my own estimates<br />
are a little bit off, but still seem to show the tendency of what has happened to<br />
Delta Scorpii’s brightness. Unfortunately I couldn’t find any reliable reference for the<br />
brightness of Delta Scorpii in late June 2003. Whether it matches the data or not<br />
would be pure speculation.<br />
There are many possibilities where the errors of my estimates of the variable star’s<br />
brightness could have originated. It is most likely that the main problem was the<br />
process of measuring the widths of the star trails, but there are also other possible<br />
explanations for those deviations. In chapter 6, I will talk about the problems of this<br />
method and how they influence the estimate of the variable star’s brightness.<br />
5.4 Accuracy<br />
The AAVSO explains in its book Hands-On Astrophysics 12 :<br />
“As you gain experience in observing variable stars, your accuracy in estimating<br />
magnitudes will increase. Nonetheless, there will always be some scatter in your<br />
data. Doing real science and gathering real data always results in measurements that<br />
have inconsistencies. Science is a process of searching for answers that are as yet<br />
unknown. Therefore we cannot strive for “correctness.” Scientists aim for precision –<br />
<strong>Gymnasium</strong> <strong>Thun</strong> Seefeld Page 14
Matura paper<br />
Daniel Bernet<br />
<strong>Observing</strong> <strong>Variable</strong> <strong>Stars</strong> November 2003<br />
exactness in procedure and measurement – so that their results, whatever they may<br />
be, will be as accurate as possible. (…). There is no way to avoid scattered data, no<br />
way to avoid the inconsistencies that come from random error. However, there are<br />
ways of eliminating the most extreme scatter so that your data are still accurate<br />
enough to be useful” 12 .<br />
Keeping that in mind, I made a table of my estimates and calculated how much they<br />
differ from the mean of the range of the observations made by independent observers.<br />
This should give me a good idea of how accurate my method worked in action.<br />
Date of observation<br />
Table 1<br />
Brightness Mean of<br />
the range<br />
18.07.1984 2.03 2.3 0.27<br />
27.07.1984 2.47 2.3 0.17<br />
04.05.1990 2.34 2.3 0.04<br />
04.04.2002 1.77 1.71 0.06<br />
07.04.2002 1.63 1.71 0.08<br />
21.04.2002 1.66 1.72 0.06<br />
15.05.2002 1.82 1.73 0.09<br />
31.05.2002 1.76 1.74 0.02<br />
30.06.2002 1.70 1.81 0.11<br />
06.07.2002 1.91 1.82 0.09<br />
23.06.2003 1.56 n/a n/a<br />
Deviation from the estimated<br />
mean of the range<br />
I added up all the deviations from the mean of the range and divided it by the number<br />
of observations made, to get the mean deviation. The calculated mean deviation of<br />
Delta Scorpii’s brightness from the data obtained by other observers is therefore 0.10<br />
magnitudes.<br />
5.5 Interpretation<br />
The AAVSO states on their homepage “most visual observers can get to 0.2-0.3 mag<br />
(=magnitudes) accuracy if they are very experienced” 13 . Patient and experienced Users<br />
of the more expensive and complicated methods of CCD and PEP will get an accuracy<br />
between 0.05 and 0.005 on their observations 7,13 .<br />
Since with my method of using photographs I got an accuracy of 0.1 magnitudes and<br />
this accuracy is based on values obtained with visual methods, which have an accuracy<br />
between 0.2 and 0.3 magnitudes, my methods has an average accuracy between<br />
0.1 and 0.4 magnitudes. Of course my estimates aren’t nearly as accurate as<br />
observations made with CCD or PEP, but still the system of using photographs has a<br />
similar accuracy as traditional visual methods, which is a great result.<br />
<strong>Gymnasium</strong> <strong>Thun</strong> Seefeld Page 15
Matura paper<br />
Daniel Bernet<br />
<strong>Observing</strong> <strong>Variable</strong> <strong>Stars</strong> November 2003<br />
6. Problems<br />
In this chapter I will show what problems can occur during the process of evaluating<br />
the brightness of variable stars using my method.<br />
6.1 Measuring difficulties<br />
I think the greatest problem of my method is that it is very difficult to measure the<br />
width of the star trails. Those lines all have different colors due to the fact that all the<br />
stars have different colors too. Sometimes it is very hard to tell where a star trail<br />
starts and where it ends. It may seem easy when it is looked at without any instruments,<br />
but <strong>und</strong>er the microscope it looks quite different. There can be blurry transitions<br />
between the star trails and the backgro<strong>und</strong> of the photographs. I fo<strong>und</strong> that a<br />
more accurate result can be achieved when not the limits of the widths of the star<br />
trails are looked at, but the spot halfway in between the lines and the backgro<strong>und</strong>.<br />
Often this method gave me a more accurate result.<br />
I had to be very objective too and I had to try not to influence the measuring by comparing<br />
the real brightness with the evaluated brightness indices.<br />
The widths of the star trails are what my method is based on. When an error occurs<br />
here, it has the biggest influence on the result of the brightness of the variable star.<br />
That’s why the measuring has to be done very carefully and patiently.<br />
Transition: Backgro<strong>und</strong> (sky) - Foregro<strong>und</strong> (star trails)<br />
Brightness<br />
A<br />
B<br />
Backgro<strong>und</strong> - Foregro<strong>und</strong> - Backgro<strong>und</strong><br />
Illustration 10: This diagram exemplifies that an error in<br />
the process of trying to find the exact limit between foreand<br />
backgro<strong>und</strong> has a bigger influence than making an<br />
error while measuring from the spot halfway between the<br />
fore- and backgro<strong>und</strong><br />
Illustration 11: This is a magnified<br />
star trail as it could be seen <strong>und</strong>er<br />
a microscope. Instead of measuring<br />
the limits of the star trail (B) I<br />
measured from the spot halfway in<br />
between the foregro<strong>und</strong> (star trail)<br />
and the backgro<strong>und</strong> (sky), (A),<br />
which gave me a more reliable<br />
result.<br />
<strong>Gymnasium</strong> <strong>Thun</strong> Seefeld Page 16
Matura paper<br />
Daniel Bernet<br />
<strong>Observing</strong> <strong>Variable</strong> <strong>Stars</strong> November 2003<br />
6.2 <strong>Observing</strong> conditions<br />
It was very important that the conditions were good, when pictures were taken. Often<br />
only after the photographs were developed can it be seen whether the conditions<br />
were good or not. Moisture in the air influenced the star trails very much due to the<br />
fact that the light was scattered by little particles of water and therefore the trails on<br />
the photographs got very blurry and couldn’t be used for the evaluations anymore.<br />
Furthermore it occurred that the widths of the star trails on the photographs weren’t<br />
representative because the widths didn’t relate to the real brightness of the stars. For<br />
example a star which shone brighter could have a smaller width of the star trail than<br />
a star that shone darker. Those errors were due to bad observing conditions too, although<br />
it was not always as obvious as in illustration 12.<br />
As I explained before, the ambient lighting conditions were also significant, since a<br />
good contrast between the star trails and the backgro<strong>und</strong> was essential for accurate<br />
evaluations. That’s why I took photographs from a very dark location and made sure<br />
that no other light sources disturbed the location in the sky where the variable star<br />
was located at the time.<br />
Illustration 12: It could only be seen after the print was developed, that the night was muggy and<br />
dull. Such pictures can clearly not be used for the evaluation, since there are no definite widths of<br />
the star trails.<br />
6.3 Sensitivity of the film<br />
The sensitivity of the film influenced the evaluation too. First of all, a roll of film is<br />
sensitive in different ways to different colors. Since each star has a different color, it<br />
could occur that the widths of the star trails result differently even though the stars<br />
had exactly the same brightness. The color of the star’s light depends on the star’s<br />
surface temperature. I obtained the best results when I compared stars with approximately<br />
the same surface temperature instead of stars which have a completely<br />
different color.<br />
Secondly, films with different sensitivities to all colors of light are available. For example<br />
there are films with a sensitivity of 200 ASA, which are used for normal photo-<br />
<strong>Gymnasium</strong> <strong>Thun</strong> Seefeld Page 17
Matura paper<br />
Daniel Bernet<br />
<strong>Observing</strong> <strong>Variable</strong> <strong>Stars</strong> November 2003<br />
graphs. I fo<strong>und</strong> that for time exposure photographs the film should have at least a<br />
sensitivity of 200 ASA, because otherwise the star trails won’t be seen well enough to<br />
make accurate estimates. It is even better when the film’s sensitivity is 400 ASA or<br />
more, because usually there will be a better contrast between the star trails and the<br />
backgro<strong>und</strong>.<br />
6.4 Vignetting effect<br />
The vignetting effect could occur when<br />
photographs were taken with a lens with a<br />
short focal length (up to approximately<br />
150mm). What happened was, that the<br />
star trails on the edge of the photographs<br />
weren’t displayed as clear and sharp as<br />
the ones in the middle of the photographs.<br />
The effect could be reduced when a lens<br />
with a longer focal length was used or<br />
when only the stars in the middle of the<br />
photographs were included in the evaluations.<br />
Illustration 13: This piece<br />
of a star trail photograph<br />
shows how the star trails<br />
get blurry at the edge of the<br />
photograph (red square)<br />
because of the vignetting<br />
effect. The star trails which<br />
are in the middle of the<br />
picture (yellow square)<br />
seem to have a clearer and<br />
sharper shape.<br />
6.5 Double stars<br />
I happened to have a double star on my<br />
photographs although I didn’t know it was<br />
one. On the pictures I couldn’t or barely<br />
could discover a difference between the<br />
two stars so that the value of the width of<br />
the double star was twice as big as it<br />
should have been according to the given<br />
brightness of one of those stars. I fo<strong>und</strong> it<br />
was best to exclude double stars from the<br />
evaluation, because otherwise they only<br />
distorted the result.<br />
Illustration 14: This is a<br />
star trail of a double star. I<br />
didn’t know it was one,<br />
until I examined it <strong>und</strong>er<br />
the microscope<br />
6.6 Selecting a variable star<br />
I explained before what difficulties there are during the process of measuring the<br />
widths of the star trails. Even slight changes of the brightness index of the variable<br />
star for example could result in a huge change of its calculated brightness. That occurred<br />
when the variable star’s brightness differed significantly from the brightness of<br />
the stars it was compared to or when one of the surro<strong>und</strong>ing stars to which the variable<br />
star was contrasted to, was much brighter or darker than all the others (illustration<br />
15). That’s why the variable star’s brightness should match the brightness of all<br />
surro<strong>und</strong>ing stars as much as possible, so that slight changes of the brightness index<br />
of the variable star or small variations of the surro<strong>und</strong>ing stars’ brightness indices,<br />
don’t result in significant alterations of the estimate for the variable star’s apparent<br />
magnitude.<br />
<strong>Gymnasium</strong> <strong>Thun</strong> Seefeld Page 18
Matura paper<br />
Daniel Bernet<br />
<strong>Observing</strong> <strong>Variable</strong> <strong>Stars</strong> November 2003<br />
0<br />
Evaluation diagram 1<br />
Apparent brightness<br />
1<br />
2<br />
3<br />
4<br />
5<br />
6<br />
0 5 10 15 20 25 30 35<br />
Brightness index<br />
measurements estimate for Delta Scorpii Linear (measurements)<br />
Evaluation diagram 2<br />
0<br />
Apparent brightness<br />
1<br />
2<br />
3<br />
4<br />
5<br />
6<br />
0 5 10 15 20 25 30 35<br />
Brightness index<br />
measurements estimate for Delta Scorpii Linear (measurements)<br />
Illustration 15: Those two diagrams show how much influence slight changes of the brightness<br />
index of the brightest star can have on the estimate of the variable star’s brightness,<br />
when one star is much brighter than all the others. In the upper diagram, the brightness index<br />
of the brightest star is 26.0 units and the corresponding estimate of the variable star’s<br />
brightness is 1.63 magnitudes (red arrow). In the second diagram, the brightness index was<br />
increased by only 5 units (which is not much) and then the corresponding estimate of the<br />
variable star’s brightness is 1.97 magnitudes (blue arrow). That’s why the variable star<br />
should only be compared to stars with approximately the same brightness.<br />
<strong>Gymnasium</strong> <strong>Thun</strong> Seefeld Page 19
Matura paper<br />
Daniel Bernet<br />
<strong>Observing</strong> <strong>Variable</strong> <strong>Stars</strong> November 2003<br />
7. Conclusion<br />
Overall it is obvious that my method has advantages and disadvantages. I’m convinced<br />
the most important advantage is that there is a medium with which I have<br />
some kind of proof for my observations. On one hand it was important for the investigations<br />
I was doing, because I could check myself if I had worked objectively, but<br />
also other persons have the possibility to know where all those values originated.<br />
Using visual methods, there is no such thing which could give you any clue of where<br />
the values came from. Therefore the observations made can’t be checked afterwards,<br />
which is very unfortunate.<br />
This advantage of my method has a high price though. Overall my method depends<br />
on many factors which can distort the result of the final estimate of the brightness of<br />
the variable star. Without any doubt my method works very well, if the conditions<br />
leading to the observations are perfect and it gives very reliable values. Unfortunately<br />
the conditions aren’t nearly as often as perfect as I’d wish they were. The weather<br />
can be bad, there could be moisture in the air, the contrast between the star trails<br />
and the backgro<strong>und</strong> on the photographs could be really bad, the moon could happen<br />
to be in the same constellation as the variable star at a particular moment, a car<br />
could pass by and make the photograph unusable, there could be problems with the<br />
measuring of the star trails and so on.<br />
Therefore my method is more demanding and time-consuming than other methods<br />
may be.<br />
The answer to the principal question I asked myself in my Matura paper, whether I<br />
can measure changes of brightness of a variable star with my own method, is certainly<br />
yes. After having developed my method, the practical test proved, that I definitely<br />
could provide evidence that a variable star, in my case Delta Scorpii, was<br />
changing its brightness. Furthermore, my observations were quite accurate and were<br />
approximately in the same range of accuracy as the visual methods.<br />
Further investigations could be made, examining whether my method supplies accurate<br />
observations of any variable star or if the reliability depends directly on the selection<br />
of a variable star. Would it be possible for example to observe a variable star<br />
near the celestial poles and still get accurate values?<br />
Many other directions of further investigations could be thought of. My Matura paper<br />
might be a fo<strong>und</strong>ation on which further studies could be based on.<br />
<strong>Gymnasium</strong> <strong>Thun</strong> Seefeld Page 20
Matura paper<br />
Daniel Bernet<br />
<strong>Observing</strong> <strong>Variable</strong> <strong>Stars</strong> November 2003<br />
8. Summary<br />
The topic of my Matura paper is observing variable stars. AAVSO defines <strong>Variable</strong><br />
stars as “stars that change brightness.” 1 There are many different reasons for these<br />
changes of brightness, 2 but this is not the concern of my Matura paper. The question<br />
is simply if I can measure changes of brightness of variable stars using my method.<br />
The most common method to observe variable stars is visual 4,5 , with which no instruments<br />
but trained eyes are necessary, since it is based on the relative comparison<br />
of the variable star and its surro<strong>und</strong>ing stars. There are other methods, such as<br />
using charge-coupled devices (CCD) 6 or photoelectric photometry (PEP) 7 , which are<br />
both extremely accurate and reliable, but those methods are very time-consuming<br />
and expensive.<br />
The traditional visual method has the disadvantage that there is no objective way of<br />
proving where the values of the observations come from. Because of this disadvantage<br />
I wanted to develop a method with which I have some kind of proof for my<br />
brightness estimates of a variable star.<br />
The method I developed is based on so-called star trail photographs. I assumed that<br />
there is a connection between the widths of the star trails and the absolute brightness<br />
of the corresponding stars. Since, for whatever reason, the star trails of the same<br />
stars are not equally wide on different photographs although the stars didn’t change<br />
brightness I only compared star trails within a photograph. That’s why I had to index<br />
sufficiently many star trails and their related absolute brightness. Using this data, I<br />
could calculate the absolute brightness of the variable star. Using Excel I plotted a<br />
graph for each photograph I could use to estimate the variable star’s absolute brightness.<br />
Once each point was plotted (x-axis: brightness index, y-axis: absolute brightness)<br />
I drew a line of best fit and using the equation of this line I could calculate an<br />
estimate of the absolute brightness (y-value is known) of the variable star. Since<br />
stars with a lower declination trail faster over the film of the camera, they will appear<br />
slightly fainter on the photograph. That’s why I couldn’t relate the absolute brightness<br />
directly to the widths of the star trails and had to compute a so-called brightness index,<br />
in order to cancel this error.<br />
Once I had developed this method of using photographs to estimate variable stars’<br />
brightness, I tested how well my method worked in action. I observed Delta Scorpii<br />
which was changing brightness unexpectedly and compared my estimates with the<br />
estimates of independent visual observers. I plotted my values together with the estimates<br />
of other observers in one diagram and investigated how accurate my method<br />
was working.<br />
I was surprised how well my estimates matched the estimates from other observers.<br />
Although my approximations had some scattering, they illustrated the tendency of the<br />
variable star’s brightness changes and had an accuracy between 0.10 and 0.40<br />
magnitudes, which is in the same range of the accuracy of visual methods.<br />
That’s why the answer to the question, whether I can measure changes of brightness<br />
of variable stars using photographs, is certainly yes.<br />
<strong>Gymnasium</strong> <strong>Thun</strong> Seefeld Page 21
Matura paper<br />
Daniel Bernet<br />
<strong>Observing</strong> <strong>Variable</strong> <strong>Stars</strong> November 2003<br />
9.1 Glossary<br />
AAVSO*<br />
Absolute brightness*<br />
Absolute magnitude*<br />
Apparent brightness*<br />
Apparent magnitude*<br />
Aperture**<br />
ASA**<br />
Brightness index***<br />
9. References<br />
The American Association of <strong>Variable</strong> Star Observers,<br />
located in Cambridge, Massachusetts, is an astronomical<br />
organization specializing in variable stars.<br />
It maintains the largest variable star database in the<br />
world.<br />
The apparent brightness of a star computed as if<br />
placed at a standard distance of 10 parsecs from the<br />
Earth.<br />
Synonym for absolute brightness.<br />
The brightness that star appears to have for an observer<br />
on Earth.<br />
Synonym for apparent brightness.<br />
Is an adjustable opening, that controls the amount of<br />
light passing through the lens of an optical instrument.<br />
The sensitivity of film to light is called film speed and<br />
is measured on a scale originally set by the American<br />
Standards Association. Hence the speed of a<br />
film is referred to as its ASA number.<br />
The brightness index is a relative value which is<br />
used to calculate an estimate of the brightness of a<br />
variable star with declination (δ).<br />
The brightness index is derived as follows:<br />
As I assumed, the width w of a star trail has a connection<br />
with the brightness (luminosity P) of the corresponding<br />
star (meaning the amount of photons per<br />
period of time T, to which the film is exposed). As the<br />
star trails slower over the film (which is the case with<br />
increasing declination of different stars), the layer is<br />
exposed to more photons in the same period of time.<br />
That’s why the absolute amount of photons N<br />
(= P · T) is inversely proportional to the speed v, with<br />
which the star moves over the film.<br />
Fortunately the absolute amount of photons doesn’t<br />
have to be calculated. It’s sufficient to compare a<br />
given trail of a star (with declination δ) with a trail of a<br />
similarly bright star on the equator (δ = 0°).<br />
Since the rotation speed of a point on a sphere is<br />
given by the equation v (δ) = v (0°) · cos (δ):<br />
w (δ) = C 1 · N = C 2 · P · T = C 3 · P / v (δ) =<br />
C 3 · P / [v (0°) · cos (δ)]<br />
Constant C 1 tells us how the width of the star trail is<br />
related to the absolute amount of photons, constant<br />
C 2 contains an additional factor, which shows the<br />
proportional relation between N, and P and T. Constant<br />
C 3 , finally, is just the proportional factor be-<br />
<strong>Gymnasium</strong> <strong>Thun</strong> Seefeld Page 22
Matura paper<br />
Daniel Bernet<br />
<strong>Observing</strong> <strong>Variable</strong> <strong>Stars</strong> November 2003<br />
Declination*<br />
Double star**<br />
Focal length**<br />
Light curve*<br />
Magnitude*<br />
Measuring eyepiece<br />
Period*<br />
Reflex camera (SLR)**<br />
Shutter**<br />
Shutter-release cable<br />
Time exposure photographs<br />
Time of exposure<br />
<strong>Variable</strong> star*<br />
tween the width of the star trails, the brightness and<br />
the speed.<br />
Therefore w (0°) is the width of the star trail of a star<br />
with brightness P on the celestial equator. Exactly<br />
this width we need to know. That’s why all measured<br />
widths of the star trails w (δ) have to be multiplied by<br />
cos (δ), so that we get the width at 0°: w (0°) = w (δ) ·<br />
cos (δ).<br />
The extension of the coordinate of latitude on Earth<br />
to the celestial sphere. It is measured in degrees, the<br />
same as latitude on Earth.<br />
Most double stars appear to the unaided eye as a<br />
single but in their true nature they have two or more<br />
components. Some of these components may be in<br />
orbit aro<strong>und</strong> each other (physical) and other components<br />
may be simply in front of one another from our<br />
perspective here on Earth (optical).<br />
The distance the lens must be from the film to give a<br />
sharp image of a distant object.<br />
A plot of variation in magnitude versus time for a<br />
variable star.<br />
A measure of the brightness of a star. The brighter a<br />
star, the lower the value of its magnitude.<br />
An eyepiece with little gridlines that enables the user<br />
to measure something <strong>und</strong>er the microscope. The<br />
gridlines are in an <strong>und</strong>efined unit.<br />
The length of time for one complete cycle of a variable<br />
star, i.e., the time between successive maxima<br />
or minima.<br />
Single-lens reflex (SLR) cameras have a mirror that<br />
reflect the image through the lens up into the viewfinder.<br />
When the trigger is pushed, the mirror moves<br />
and enables the light to expose the film.<br />
The shutter controls the length of time that light enters<br />
through the lens onto the film.<br />
Is used to fix the shutter, so that the film can be exposed<br />
as long as desired<br />
Photographs which were exposed to light for a<br />
longer period of time.<br />
Length of time that light enters through the lens onto<br />
the film.<br />
A star that displays variations in brightness.<br />
* copied from the book: Young, Donna L./Mattei Janet Akyüz/Percy John R.:<br />
AAVSO Hands-On Astrophysics. Cambridge: AAVSO, 1997. ISBN: 1-878174-<br />
25-8, Glossary/Subject Index 1 – 8<br />
** copied from the homepage: Grolier Online, “The New Book of Popular Science”,<br />
http://go.grolier.com/gol<br />
*** derived by Mr. Stürmer, paraphrased and translated into English by myself<br />
<strong>Gymnasium</strong> <strong>Thun</strong> Seefeld Page 23
Matura paper<br />
Daniel Bernet<br />
<strong>Observing</strong> <strong>Variable</strong> <strong>Stars</strong> November 2003<br />
9.2 References<br />
(1) AAVSO, „<strong>Variable</strong> <strong>Stars</strong>“, http://www.aavso.org/vstar/<br />
(2) AAVSO, „Types of <strong>Variable</strong> <strong>Stars</strong>“, http://www.aavso.org/vstar/types.shtml<br />
(3) Young, Donna L./Mattei Janet Akyüz/Percy John R.: AAVSO Hands-On<br />
Astrophysics. Cambridge:AAVSO, 1997. ISBN: 1-878174-25-8, p. 89<br />
(4) ALCOVE Database ®, „<strong>Variable</strong> <strong>Stars</strong>“,<br />
http://members.aol.com/astroalcove/variables.html<br />
(5) Young, Donna L./Mattei Janet Akyüz/Percy John R.: AAVSO Hands-On Astrophysics.<br />
Cambridge: AAVSO, 1997. ISBN: 1-878174-25-8, p. 89ff<br />
(6) CCD’s For Material Scientists, “Evolving Towards The Perfect CCD”,<br />
http://zebu.uoregon.edu/ccd.html<br />
and<br />
What is CCD Resolution, “CCD Resolution”,<br />
http://www.camerafever.com/exp001_CCD.html<br />
(7) AAVSO, „Photoelectric Photometry (PEP) <strong>Observing</strong> Program”,<br />
http://www.aavso.org/observing/programs/pep/<br />
(8) Sky and Telescope, “<strong>Variable</strong> <strong>Stars</strong>”,<br />
http://skyandtelescope.com/observing/objects/variablestars/<br />
(9) Roth, Hans (Hg.): Der Sternenhimmel. 2002. 62. Jahrgang. Stuttgart: Franckh-<br />
Kosmos Verlags-GmbH & Co., 2001<br />
(10) Sky and Telescope, „Delta Scorpii Brighter Than Ever”,<br />
http://skyandtelescope.com/printable/news/current/article_465.asp<br />
(11) McRobert, Alan: The Delta Sco Show Continues. Sky & Telescope, August<br />
2003, p.18<br />
(12) Young, Donna L./Mattei Janet Akyüz/Percy John R.: AAVSO Hands-On Astrophysics.<br />
Cambridge: AAVSO, 1997. ISBN: 1-878174-25-8, p. 157<br />
(13) AAVSO, „CCD <strong>Observing</strong> Manual: Introduction”,<br />
http://www.aavso.org/observing/programs/ccd/manual/1.shtml<br />
<strong>Gymnasium</strong> <strong>Thun</strong> Seefeld Page 24
Matura paper<br />
Daniel Bernet<br />
<strong>Observing</strong> <strong>Variable</strong> <strong>Stars</strong> November 2003<br />
9.3 Illustrations<br />
Photographs:<br />
All photographs printed in this paper except illustration 16, 17 and 18, which were<br />
made by Mr. Stürmer, were taken by myself. In chapter 10, I put together a table of<br />
all the data of where, when and how I (and Mr. Stürmer) made the photographs.<br />
Diagrams:<br />
Illustration 7<br />
This diagram is made with data obtained during the process of<br />
evaluation of the photograph number 17 (illustration 17).<br />
Illustration 8: I used the data of all evaluated photographs (illustrations 16 – 26) and<br />
data from the article fo<strong>und</strong> in the magazine Sky and Telescope. 11<br />
Illustration 9: same as illustration 8<br />
Illustration 10 I drew a hyperbolic arctangent curve for this diagram to exemplify the<br />
transition between the backgro<strong>und</strong> and the foregro<strong>und</strong> of the photograph.<br />
Illustration 15 The data for this diagram comes from the evaluated photograph number<br />
19 (illustration 19).<br />
9.4 Tables<br />
Table 1<br />
I used the data of all evaluated photographs (illustrations 16 – 26) and<br />
data taken from the article fo<strong>und</strong> in the magazine Sky and Telescope. 11<br />
<strong>Gymnasium</strong> <strong>Thun</strong> Seefeld Page 25
Matura paper<br />
Daniel Bernet<br />
<strong>Observing</strong> <strong>Variable</strong> <strong>Stars</strong> November 2003<br />
10. Appendices<br />
10.1 Settings<br />
In the first table, all the photographs are listed which were used in the main part of my<br />
Matura paper.<br />
Illustr<br />
ation<br />
nr<br />
Date Time Location Camera,<br />
Film (ASA)<br />
Lens<br />
(mm)<br />
Exposure<br />
time<br />
(min)<br />
Subject<br />
1 06.07.02 23:30 Hondrich Minolta, 200 70 3.5 20 Atair*<br />
2 26.02.03 08:25 Colden, NY Nikkon, 200 135 5.8 5 Algol<br />
3 26.02.03 11:22 Colden, NY Nikkon, 200 135 2.5 20sec Polaris<br />
4 06.07.02 23:30 Hondrich Minolta, 200 70 3.5 20 Atair**<br />
5 21.04.02 00:10 Hondrich Ricoh, 400 135 11 10sec Moon*<br />
6 30.04.02 22:11 Hondrich Ricoh, 400 135 2.8 5 Virgo**<br />
11 04.04.02 04:05 Hondrich Ricoh, 400 135 4 1 Antares**<br />
12 21.04.02 02.32 Aeschi Ricoh, 400 135 2.8 5 Scorpius<br />
13 04.04.02 04:05 Hondrich Ricoh, 400 135 4 1 Scorpius*<br />
14 23.06.02 00:55 Golden, NY Nikkon 135 2.8 5 Rho Scorpii**<br />
*Only a piece of the whole picture is printed<br />
**Only a magnified piece of the whole picture is printed<br />
The second table shows when, where and how all the photographs used for the light<br />
curve (Illustration 8 and 9) were made. Note that photographs 16, 17 and 18 were made<br />
by Dr. Ekkehard Stürmer.<br />
All pictures listed below are printed in chapter 10.2.<br />
Illustr<br />
ation<br />
nr<br />
Date Time Location Camera,<br />
Film (ASA)<br />
Lens<br />
(mm)<br />
Aperture<br />
Aperture<br />
Exposure<br />
time<br />
(min)<br />
Subject<br />
16 18.07.84 23:05 Uetendorf 1000 205 5 Scorpius<br />
17 27.07.84 22:51 Sunnehüsi 1000 145 5 Scorpius<br />
18 04.05.90 03:03 Sunnehüsi 55 10 Scorpius<br />
19 04.04.02 04:05 Hondrich Ricoh, 400 135 4 1 Scorpius<br />
20 07.04.02 03:21 Hondrich Ricoh, 400 135 4 3 Scorpius<br />
21 21.04.02 02:32 Hondrich Ricoh, 400 135 2.8 5 Scorpius<br />
22 15.05.02 00:55 Hondrich Ricoh, 400 135 2.8 5 Scorpius<br />
23 31.05.02 00:04 Hondrich Ricoh, 400 135 4 5 Scorpius<br />
24 30.06.02 22:44 Hondrich Minolta, 200 70 3.5 5 Scorpius<br />
25 06.07.02 22:59 Hondrich Minolta, 200 70 3.5 5 Scorpius<br />
26 23.06.02 01:05 Golden, NY Nikkon, 200 135 2.8 5 Scorpius<br />
<strong>Gymnasium</strong> <strong>Thun</strong> Seefeld Page 26
Matura paper<br />
Daniel Bernet<br />
<strong>Observing</strong> <strong>Variable</strong> <strong>Stars</strong> November 2003<br />
10.2 Evaluated photographs<br />
Illustration 16<br />
Illustration 17<br />
<strong>Gymnasium</strong> <strong>Thun</strong> Seefeld Page 27
Matura paper<br />
Daniel Bernet<br />
<strong>Observing</strong> <strong>Variable</strong> <strong>Stars</strong> November 2003<br />
Illustration 18<br />
<strong>Gymnasium</strong> <strong>Thun</strong> Seefeld Page 28
Matura paper<br />
Daniel Bernet<br />
<strong>Observing</strong> <strong>Variable</strong> <strong>Stars</strong> November 2003<br />
Illustration 19<br />
<strong>Gymnasium</strong> <strong>Thun</strong> Seefeld Page 29
Matura paper<br />
Daniel Bernet<br />
<strong>Observing</strong> <strong>Variable</strong> <strong>Stars</strong> November 2003<br />
Illustration 20<br />
Illustration 21<br />
<strong>Gymnasium</strong> <strong>Thun</strong> Seefeld Page 30
Matura paper<br />
Daniel Bernet<br />
<strong>Observing</strong> <strong>Variable</strong> <strong>Stars</strong> November 2003<br />
Illustration 22<br />
Illustration 23<br />
<strong>Gymnasium</strong> <strong>Thun</strong> Seefeld Page 31
Matura paper<br />
Daniel Bernet<br />
<strong>Observing</strong> <strong>Variable</strong> <strong>Stars</strong> November 2003<br />
Illustration 24<br />
Illustration 25<br />
<strong>Gymnasium</strong> <strong>Thun</strong> Seefeld Page 32
Matura paper<br />
Daniel Bernet<br />
<strong>Observing</strong> <strong>Variable</strong> <strong>Stars</strong> November 2003<br />
Illustration 26<br />
<strong>Gymnasium</strong> <strong>Thun</strong> Seefeld Page 33
Matura paper<br />
Daniel Bernet<br />
<strong>Observing</strong> <strong>Variable</strong> <strong>Stars</strong> November 2003<br />
10.3 Observation form<br />
Daniel Bernet Camera Film nr, Type<br />
Rüttistrasse 25<br />
3702 Hondrich<br />
Taking photographs<br />
Nr Date Local<br />
time<br />
Location Lens Aperture<br />
Exposure<br />
time<br />
Subject<br />
<strong>Gymnasium</strong> <strong>Thun</strong> Seefeld Page 34
Matura paper<br />
Daniel Bernet<br />
<strong>Observing</strong> <strong>Variable</strong> <strong>Stars</strong> November 2003<br />
10.4 Evaluation form<br />
Sheet nr Lens Measuring Film nr<br />
Evaluation of photographs (model for Scorpius)<br />
Name of the<br />
star<br />
Brightness<br />
abs. (in<br />
magnitude)<br />
Declination<br />
Widths of the star trails (in <strong>und</strong>efined units) /<br />
Photograph number<br />
7 Oph 4.42 -18°27’<br />
4 Oph 4.5 -20°02’<br />
9 Oph 4.45 -21°28’<br />
14 Sco 4.01 -19°28’<br />
Beta Sco 2.62 -19°48’<br />
Omega1 3.96 -20°40’<br />
Sco<br />
Omega2 4.32 -20°52’<br />
Sco<br />
Pi Sco 2.89 -26°07’<br />
Sigma Sco 2.89 -25°35’<br />
Omicron 4.55 -24°10’<br />
Sco<br />
HR 6141 4.79 -25°07’<br />
Antares 0.96 -26°26’<br />
8 Oph 4.28 -16°36’<br />
35 Oph 2.43 -15°43’<br />
23 Sco 2.82 -18°12’<br />
38 Librae 3.91 -14°47’<br />
46 Librae 4.15 -16°43’<br />
Delta Sco 2.32 -22°37’<br />
<strong>Gymnasium</strong> <strong>Thun</strong> Seefeld Page 35
Matura paper<br />
Daniel Bernet<br />
<strong>Observing</strong> <strong>Variable</strong> <strong>Stars</strong> November 2003<br />
1 AAVSO, „<strong>Variable</strong> <strong>Stars</strong>“, http://www.aavso.org/vstar/<br />
2 AAVSO, „Types of <strong>Variable</strong> <strong>Stars</strong>“, http://www.aavso.org/vstar/types.shtml<br />
3 Young, Donna L./Mattei Janet Akyüz/Percy John R.: AAVSO Hands-On Astrophysics.<br />
Cambridge:AAVSO, 1997. ISBN: 1-878174-25-8. p. 89<br />
4 ALCOVE Database ®, „<strong>Variable</strong> <strong>Stars</strong>“,<br />
http://members.aol.com/astroalcove/variables.html<br />
5 Young, Donna L./Mattei Janet Akyüz/Percy John R.: AAVSO Hands-On Astrophysics.<br />
Cambridge:AAVSO, 1997. ISBN: 1-878174-25-8. p. 89ff<br />
6 CCD’s For Material Scientists, “Evolving Towards The Perfect CCD”,<br />
http://zebu.uoregon.edu/ccd.html<br />
and<br />
What is CCD Resolution, “CCD Resolution”,<br />
http://www.camerafever.com/exp001_CCD.html<br />
7 AAVSO, „Photoelectric Photometry (PEP) <strong>Observing</strong> Program”,<br />
http://www.aavso.org/observing/programs/pep/<br />
8 Sky and Telescope, “<strong>Variable</strong> <strong>Stars</strong>”,<br />
http://skyandtelescope.com/observing/objects/variablestars/<br />
9 Roth, Hans (Hg.): Der Sternenhimmel. 2002. 62. Jahrgang. Stuttgart: Franckh-<br />
Kosmos Verlags-GmbH & Co., 2001<br />
10 Sky and Telescope, „Delta Scorpii Brighter Than Ever”,<br />
http://skyandtelescope.com/printable/news/current/article_465.asp<br />
11 McRobert, Alan: The Delta Sco Show Continues. Sky & Telescope, August 2003,<br />
p.18<br />
12 Young, Donna L./Mattei Janet Akyüz/Percy John R.: AAVSO Hands-On Astrophysics.<br />
Cambridge:AAVSO, 1997. ISBN: 1-878174-25-8. p. 157<br />
13 AAVSO, „CCD <strong>Observing</strong> Manual: Introduction”,<br />
http://www.aavso.org/observing/programs/ccd/manual/1.shtml<br />
<strong>Gymnasium</strong> <strong>Thun</strong> Seefeld Page 36


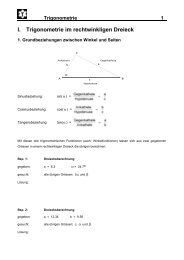


![[de: 'ra:m n] - Gymnasium und Fachmittelschule Thun Seefeld](https://img.yumpu.com/22133192/1/184x260/de-ram-n-gymnasium-und-fachmittelschule-thun-seefeld.jpg?quality=85)