

The Eternal Triangle of Growth, Inequality and Poverty Reduction
The Eternal Triangle of Growth, Inequality and Poverty Reduction
The Eternal Triangle of Growth, Inequality and Poverty Reduction

You also want an ePaper? Increase the reach of your titles
YUMPU automatically turns print PDFs into web optimized ePapers that Google loves.
<strong>The</strong> <strong>Eternal</strong> <strong>Triangle</strong> <strong>of</strong><br />
<strong>Growth</strong>, <strong>Inequality</strong> <strong>and</strong> <strong>Poverty</strong> <strong>Reduction</strong><br />
(for International Seminar on<br />
Building Interdisciplinary Development Studies)<br />
Pr<strong>of</strong>. Shigeru T. OTSUBO<br />
GSID, Nagoya University<br />
October 2007<br />
1<br />
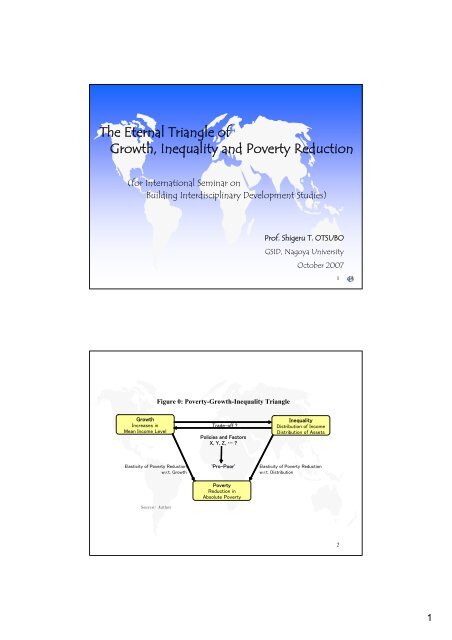
Figure 0: <strong>Poverty</strong>-<strong>Growth</strong>-<strong>Inequality</strong> <strong>Triangle</strong><br />
<strong>Growth</strong><br />
Increases in<br />
Mean Income Level<br />
Trade-<strong>of</strong>f ?<br />
Policies <strong>and</strong> Factors<br />
X, Y, Z, … ?<br />
<strong>Inequality</strong><br />
Distribution <strong>of</strong> Income<br />
Distribution <strong>of</strong> Assets<br />
Elasticity <strong>of</strong> <strong>Poverty</strong> <strong>Reduction</strong> 'Pro-Poor' Elasticity <strong>of</strong> <strong>Poverty</strong> <strong>Reduction</strong><br />
w.r.t. <strong>Growth</strong><br />
w.r.t. Distribution<br />
Source: Author<br />
<strong>Poverty</strong><br />
<strong>Reduction</strong> in<br />
Absolute <strong>Poverty</strong><br />
2<br />
1
Figure 2: Decomposition <strong>of</strong> change in distribution <strong>and</strong> poverty<br />
into growth <strong>and</strong> distribution effects<br />
Source: Bourguignon (2003), Figure 1.2; Bourguignon (2004), Figure 1<br />
Change in <strong>Poverty</strong> = F( growth, distribution, change in distribution) (assuming log-normal distribution)<br />
3<br />
Figure 1: <strong>Poverty</strong>-<strong>Growth</strong>-<strong>Inequality</strong> <strong>Triangle</strong><br />
<strong>Growth</strong><br />
Increases in<br />
Mean Income Level<br />
Trade-<strong>of</strong>f ?<br />
Development Governance<br />
Institutions<br />
(common factors?)<br />
<strong>Inequality</strong><br />
Distribution <strong>of</strong> Income<br />
Distribution <strong>of</strong> Assets<br />
Elasticity <strong>of</strong> <strong>Poverty</strong> <strong>Reduction</strong> 'Pro-Poor' Elasticity <strong>of</strong> <strong>Poverty</strong> <strong>Reduction</strong><br />
w.r.t. <strong>Growth</strong><br />
w.r.t. Distribution<br />
<strong>Poverty</strong><br />
<strong>Reduction</strong> in<br />
Absolute <strong>Poverty</strong><br />
Source: Author<br />
Pro-Poor vs. Pro-<strong>Growth</strong><br />
Pro-Poor <strong>Growth</strong><br />
4<br />
2
Kuznetz Hypothesis – Kuznetz’ Inverted U Curve 1<br />
<strong>Growth</strong><br />
Increases in<br />
Mean Income Level<br />
Trade-<strong>of</strong>f ?<br />
Development Governance<br />
Institutions<br />
(common factors?)<br />
<strong>Inequality</strong><br />
Distribution <strong>of</strong> Income<br />
Distribution <strong>of</strong> Assets<br />
Elasticity <strong>of</strong> <strong>Poverty</strong> <strong>Reduction</strong> 'Pro-Poor' Elasticity <strong>of</strong> <strong>Poverty</strong> <strong>Reduction</strong><br />
w.r.t. <strong>Growth</strong><br />
w.r.t. Distribution<br />
<strong>Poverty</strong><br />
<strong>Reduction</strong> in<br />
Absolute <strong>Poverty</strong><br />
Kuznetz (1955)<br />
<strong>The</strong> paper is perhaps 5 per cent empirical information <strong>and</strong> 95 per cent speculation, some <strong>of</strong><br />
it possibly tainted by wishful thinking.(p.26)<br />
Fields (2001)<br />
Although the two early studies by Kuznetz (1955 <strong>and</strong> 1963) are widely cited as providing<br />
evidence in favor <strong>of</strong> the Kuznetz curve, the actual data he presents do not support this. His<br />
key table, reproduced here as table 3.2, reveals only two countries (Prussia <strong>and</strong> Saxony) in<br />
which the inverted-U pattern held; in the other seven (United Kingdom, Germany,<br />
Netherl<strong>and</strong>s, Denmark, Norway, Sweden, <strong>and</strong> the United States), inequality fell. (p.47)<br />
5<br />
Kuznetz Hypothesis – Kuznetz’ Inverted U Curve 2<br />
<strong>Growth</strong><br />
Increases in<br />
Mean Income Level<br />
Trade-<strong>of</strong>f ?<br />
Development Governance<br />
Institutions<br />
(common factors?)<br />
<strong>Inequality</strong><br />
Distribution <strong>of</strong> Income<br />
Distribution <strong>of</strong> Assets<br />
Elasticity <strong>of</strong> <strong>Poverty</strong> <strong>Reduction</strong> 'Pro-Poor' Elasticity <strong>of</strong> <strong>Poverty</strong> <strong>Reduction</strong><br />
w.r.t. <strong>Growth</strong><br />
w.r.t. Distribution<br />
<strong>Poverty</strong><br />
<strong>Reduction</strong> in<br />
Absolute <strong>Poverty</strong><br />
<strong>The</strong>oretical Studies<br />
Stiglitz (1969) – Neoclassical Model <strong>of</strong> <strong>Growth</strong> <strong>and</strong> distribution<br />
Simple model <strong>of</strong> accumulation w/ i) a linear savings fn., ii) a constant reproduction rate,<br />
iii) homogeneous labor, iv) equal inheritance,<br />
then, all wealth <strong>and</strong> income is aymptotically evenly distributed.<br />
Forces <strong>of</strong> inequality are then 1) heterogeneity <strong>of</strong> labor force,<br />
2) class savings behavior (advent <strong>of</strong> capitalist <strong>and</strong> workers classes), <strong>and</strong><br />
3) alternative inheritance policies (such as primogeniture).<br />
Fields (1980) -- Limiting Cases <strong>of</strong> Dualistic Development (Two-Sector Models)<br />
i) Modern-Sector Enlargement → Lorenz curves cross, but most likely ‘Inverted U’<br />
Lewis’ (1954) two-sector model with unlimited supply <strong>of</strong> labor<br />
ii) Modern-Sector Enrichment<br />
iii) Traditional-Sector Enrichment<br />
6<br />
3
Kuznetz Hypothesis – Kuznetz’ Inverted U Curve 3<br />
<strong>Growth</strong><br />
Increases in<br />
Mean Income Level<br />
Trade-<strong>of</strong>f ?<br />
Development Governance<br />
Institutions<br />
(common factors?)<br />
<strong>Inequality</strong><br />
Distribution <strong>of</strong> Income<br />
Distribution <strong>of</strong> Assets<br />
Elasticity <strong>of</strong> <strong>Poverty</strong> <strong>Reduction</strong> 'Pro-Poor' Elasticity <strong>of</strong> <strong>Poverty</strong> <strong>Reduction</strong><br />
w.r.t. <strong>Growth</strong><br />
w.r.t. Distribution<br />
<strong>Poverty</strong><br />
<strong>Reduction</strong> in<br />
Absolute <strong>Poverty</strong><br />
Empirical Studies<br />
1970s-80s Kuznetz’ inverted U-curve Confirmed In Cross-Country Studies<br />
e.g. Paukert (1973), Ahluwalia (1976), Ahluwalia, Carter <strong>and</strong> Chenery (1976), etc.<br />
1990s Rejected In Panel & Corss-Country w/ Fixed Effects Studies<br />
e.g. Deininger <strong>and</strong> Squire (1996, 1998), Bruno, Ravallion, <strong>and</strong> Squire (1996)<br />
7<br />
Table 1: <strong>Growth</strong>, <strong>Inequality</strong>, <strong>and</strong> <strong>Poverty</strong><br />
Periods <strong>of</strong> growth (88) Periods <strong>of</strong> decline (7)<br />
Indicator Improved Worsened Improved Worsened<br />
<strong>Inequality</strong> 45 43 2 5<br />
Income <strong>of</strong> the poor a 77 11 2 5<br />
Note: "Improved" in the income distribution implies a decrease <strong>of</strong> the Gini coefficient;<br />
"worsened" implies an increase. <strong>The</strong> sample includes ninety-five economies.<br />
a. <strong>The</strong> income <strong>of</strong> the lowest quintile.<br />
Source: Deininger <strong>and</strong> Squire 1996 Table 7<br />
Deininger <strong>and</strong> Squire (1996) constructed a data set <strong>of</strong> Gini coefficients <strong>and</strong> other income distribution<br />
measures with 682 observations for 108 countries from the 1960s to the 1990s. (decadal<br />
changes/growths)<br />
Table 1 (their Table 7) summarize movements in Gini coefficients <strong>and</strong> real income <strong>of</strong> the poorest quintile<br />
during decadal growth episodes (defined by the availability <strong>of</strong> distribution data that span at least one<br />
decade).<br />
First, there appears to be little systematic relationship between growth <strong>and</strong> changes in aggregate<br />
inequality (inequality as measured in Gini coefficients). … <strong>The</strong> simple correlation between<br />
contemporaneous as well as lagged income growth <strong>and</strong> the change in the Gini coefficient is insignificant for<br />
the whole sample as well as for subsamples defined in terms <strong>of</strong> country characteristics (rich or poor,<br />
equal or unequal, fast-growing or slow growing economies).<br />
<strong>The</strong> average annual percentage change in the Gini coefficient in our sample was only 0.28 points,<br />
compared with an average growth rate in per capita income <strong>of</strong> 2.16 percent.<br />
Second. Although we do not find significant correlations between aggregate growth <strong>and</strong> changes in<br />
inequality, there is a strong correlation between aggregate growth <strong>and</strong> changes in the income <strong>of</strong> all<br />
quintiles except the top one. (p. 587)<br />
8<br />
4
Figure 3: Cross-country estimates <strong>of</strong> the Kuznets curve<br />
Source: Bourguignon 2004, Figure 5<br />
9<br />
Bourguignon(2004) interpretation <strong>of</strong><br />
**Deininger <strong>and</strong> Squire (1998) based on D&S(1996) Data**<br />
Data come from an unbalanced panel, with several observations for each country at approximately 10<br />
year intervals.<br />
When all the observations are pooled together <strong>and</strong> a simple regression <strong>of</strong> the Gini coefficient over<br />
income per capita <strong>and</strong> the inverse <strong>of</strong> income per capita is run, then a clear inverted-U curve is obtained.<br />
However curvature loses significance when the estimation is made on decadal differences for each<br />
country in the sample, that is to say when only time changes are taken into account.<br />
Finally, when fixed country effects are introduced in the original estimate, so that all countries are<br />
assumed to follow parallel paths rather than the same path, then the inverted-U shape disappears. In<br />
effect the curve becomes practically flat, <strong>and</strong> even the decline in inequality for low incomes fails to be<br />
statistically significant.<br />
This shows that:<br />
<strong>The</strong>se results certainly do not imply that growth has no significant impact on distribution.<br />
Rather they indicate that there is too much country specificity in the way growth affects<br />
distribution for any generalization to be possible. Indeed, case studies, as opposed to crosssectional<br />
studies, show that distributional changes have very much to do with the pace <strong>and</strong><br />
structural features <strong>of</strong> economic growth in the period under analysis. (p. 13)<br />
10<br />
5
<strong>Inequality</strong> in Income/Assets → <strong>Growth</strong> 1<br />
Figure 1: <strong>Poverty</strong>-<strong>Growth</strong>-<strong>Inequality</strong> <strong>Triangle</strong><br />
<strong>Growth</strong><br />
Increases in<br />
Mean Income Level<br />
Trade-<strong>of</strong>f ?<br />
Development Governance<br />
Institutions<br />
(common factors?)<br />
<strong>Inequality</strong><br />
Distribution <strong>of</strong> Income<br />
Distribution <strong>of</strong> Assets<br />
Elasticity <strong>of</strong> <strong>Poverty</strong> <strong>Reduction</strong> 'Pro-Poor' Elasticity <strong>of</strong> <strong>Poverty</strong> <strong>Reduction</strong><br />
w.r.t. <strong>Growth</strong><br />
w.r.t. Distribution<br />
<strong>Poverty</strong><br />
<strong>Reduction</strong> in<br />
Absolute <strong>Poverty</strong><br />
**WDR 2006: Equity <strong>and</strong> Development (2005)**<br />
With imperfect markets, inequalities in power <strong>and</strong> wealth translate into unequal opportunities, leading to<br />
wasted productive potential <strong>and</strong> to an inefficient allocation <strong>of</strong> resources. (p.7)<br />
Imperfect Capital Markets, Imperfect L<strong>and</strong> Markets, Imperfect Markets for Human Capital<br />
Economic <strong>and</strong> political inequalities are associated with impaired institutional development. (p.8)<br />
<strong>The</strong> second channel through which inequality affects long-run processes <strong>of</strong> development is the shaping<br />
<strong>of</strong> economic <strong>and</strong> political institutions. (p.9)<br />
11<br />
<strong>Inequality</strong> in Income/Assets → <strong>Growth</strong> 2<br />
Figure 1: <strong>Poverty</strong>-<strong>Growth</strong>-<strong>Inequality</strong> <strong>Triangle</strong><br />
<strong>Growth</strong><br />
Increases in<br />
Mean Income Level<br />
Trade-<strong>of</strong>f ?<br />
Development Governance<br />
Institutions<br />
(common factors?)<br />
<strong>Inequality</strong><br />
Distribution <strong>of</strong> Income<br />
Distribution <strong>of</strong> Assets<br />
Elasticity <strong>of</strong> <strong>Poverty</strong> <strong>Reduction</strong> 'Pro-Poor' Elasticity <strong>of</strong> <strong>Poverty</strong> <strong>Reduction</strong><br />
w.r.t. <strong>Growth</strong><br />
w.r.t. Distribution<br />
<strong>Poverty</strong><br />
<strong>Reduction</strong> in<br />
Absolute <strong>Poverty</strong><br />
<strong>The</strong>oretical Studies (<strong>Inequality</strong> is bad for growth) (mostly on Assets <strong>Inequality</strong>)<br />
Galor <strong>and</strong> Zeira(1993), Banerjee <strong>and</strong> Newman (1993), Benabou (1996),<br />
Aghion et al. (1999), Bardhan et al. (1999), etc.<br />
Galor <strong>and</strong> Zeira(1993)<br />
An equilibrium model <strong>of</strong> open economies with overlapping generations <strong>and</strong> inter-generational altruism.<br />
Individuals live for two periods. In the first they may either invest in human capital <strong>and</strong> acquire education<br />
or else work as unskilled. In the second period they work as skilled or unskilled—according to their<br />
education level, consume <strong>and</strong> leave bequests.<br />
u = α log c + (1-α) log b, 0
<strong>Inequality</strong> in Income/Assets → <strong>Growth</strong> 3<br />
Figure 1: <strong>Poverty</strong>-<strong>Growth</strong>-<strong>Inequality</strong> <strong>Triangle</strong><br />
<strong>Growth</strong><br />
Increases in<br />
Mean Income Level<br />
Trade-<strong>of</strong>f ?<br />
Development Governance<br />
Institutions<br />
(common factors?)<br />
<strong>Inequality</strong><br />
Distribution <strong>of</strong> Income<br />
Distribution <strong>of</strong> Assets<br />
Elasticity <strong>of</strong> <strong>Poverty</strong> <strong>Reduction</strong> 'Pro-Poor' Elasticity <strong>of</strong> <strong>Poverty</strong> <strong>Reduction</strong><br />
w.r.t. <strong>Growth</strong><br />
w.r.t. Distribution<br />
<strong>Poverty</strong><br />
<strong>Reduction</strong> in<br />
Absolute <strong>Poverty</strong><br />
Empirical Studies (<strong>Inequality</strong> in initial Income/Consumption is bad for growth)<br />
Alesina <strong>and</strong> Rodrick(1994), Clarke(1995), Bridsall et al. (1995), Benabou (1996),<br />
Perotti(1996), Forbes (1998), Deininger <strong>and</strong> Squire(1998), Li <strong>and</strong> Zou (1998),<br />
Barro (1999), Deininger <strong>and</strong> Olinto (2000), Easterly(2002)<br />
This led to fear that the “empirical regularity” <strong>of</strong> a negative inequality-growth<br />
relationship may be similar to the famous Kuznets curve—very robust in a cross<br />
section but disappearing once country level fixed effects were introduced (Deininger <strong>and</strong><br />
Squire 1998). (p.8)<br />
13<br />
<strong>Inequality</strong> in Income/Assets → <strong>Growth</strong> 4<br />
Figure 1: <strong>Poverty</strong>-<strong>Growth</strong>-<strong>Inequality</strong> <strong>Triangle</strong><br />
<strong>Growth</strong><br />
Increases in<br />
Mean Income Level<br />
Trade-<strong>of</strong>f ?<br />
Development Governance<br />
Institutions<br />
(common factors?)<br />
<strong>Inequality</strong><br />
Distribution <strong>of</strong> Income<br />
Distribution <strong>of</strong> Assets<br />
Elasticity <strong>of</strong> <strong>Poverty</strong> <strong>Reduction</strong> 'Pro-Poor' Elasticity <strong>of</strong> <strong>Poverty</strong> <strong>Reduction</strong><br />
w.r.t. <strong>Growth</strong><br />
w.r.t. Distribution<br />
<strong>Poverty</strong><br />
<strong>Reduction</strong> in<br />
Absolute <strong>Poverty</strong><br />
Empirical Studies (<strong>Inequality</strong> in initial Assets is bad for growth)<br />
Deininger <strong>and</strong> Olinto (2000) uses assets (l<strong>and</strong>) rather than income (<strong>and</strong> a GMM estimator) in a panel<br />
study <strong>of</strong> interrelationship between inequality <strong>and</strong> growth. (261 observations from 103 countries)<br />
Deininger <strong>and</strong> Olinto (2000) find evidence that asset inequality—but not income inequality—has a<br />
significant <strong>and</strong> relatively large negative impact on growth. <strong>The</strong>y also find that a highly unequal<br />
distribution <strong>of</strong> assets reduces the effectiveness <strong>of</strong> educational interventions (as it reduces<br />
attractiveness/returns to investment in human capital.)<br />
Use <strong>of</strong> a micro panel data <strong>of</strong> harm-household for rural areas in four provinces <strong>of</strong> southern China, spanning<br />
the period 1985-90, covering 6651 farm households living in 131 counties. Ravallion (1998) finds a<br />
significant <strong>and</strong> negative effect <strong>of</strong> local asset distribution on individuals’ consumption growth. Comparing<br />
the coefficient attached to the initial inequality in assets, individual micro estimation <strong>of</strong> consumption<br />
growth returns almost three times larger negative impacts <strong>of</strong> asset inequality on consumption path, as<br />
compared to that in country aggregate consumption growth regression. Pointing to the needs <strong>of</strong> micro<br />
studies.<br />
14<br />
7
Elasticity <strong>of</strong> <strong>Poverty</strong> <strong>Reduction</strong> w.r.t. <strong>Growth</strong><br />
<strong>Growth</strong><br />
Increases in<br />
Mean Income Level<br />
Trade-<strong>of</strong>f ?<br />
Development Governance<br />
Institutions<br />
(common factors?)<br />
<strong>Inequality</strong><br />
Distribution <strong>of</strong> Income<br />
Distribution <strong>of</strong> Assets<br />
Elasticity <strong>of</strong> <strong>Poverty</strong> <strong>Reduction</strong> 'Pro-Poor' Elasticity <strong>of</strong> <strong>Poverty</strong> <strong>Reduction</strong><br />
w.r.t. <strong>Growth</strong><br />
w.r.t. Distribution<br />
<strong>Poverty</strong><br />
<strong>Reduction</strong> in<br />
Absolute <strong>Poverty</strong><br />
<strong>Poverty</strong> Rate (headcouunt) <strong>Poverty</strong> Gap Squared <strong>Poverty</strong> Gap<br />
Ravallion <strong>and</strong> Chen (1996) 1987-1994 42 -2.6 (half <strong>of</strong> mean income)<br />
-3.1 (1$PPP a day) -3.7<br />
Bruno, Ravallion, <strong>and</strong> Squire (1996 1984-1993 20 -2.12 (1$PPP a day) -3.46<br />
India 40years 33 HS -1.33 (Indian poverty line) -2.26<br />
Adams (2003) 1980-1999 50 cos. 101 obs. -2.6 (1$PPP a day) -3 -3.4<br />
This indicate that the gains are not confined to those near the poverty line.<br />
(Bruno, Ravallion, <strong>and</strong> Squire,1996, p.10).<br />
15<br />
Figure 4 : <strong>Growth</strong> is good for the poor<br />
Source: Dollar <strong>and</strong> Kraay (2007), Figure 1<br />
16<br />
8
Elasticity <strong>of</strong> <strong>Poverty</strong> <strong>Reduction</strong> w.r.t. Distribution 1<br />
<strong>Growth</strong><br />
Increases in<br />
Mean Income Level<br />
Trade-<strong>of</strong>f ?<br />
Development Governance<br />
Institutions<br />
(common factors?)<br />
<strong>Inequality</strong><br />
Distribution <strong>of</strong> Income<br />
Distribution <strong>of</strong> Assets<br />
Elasticity <strong>of</strong> <strong>Poverty</strong> <strong>Reduction</strong> 'Pro-Poor' Elasticity <strong>of</strong> <strong>Poverty</strong> <strong>Reduction</strong><br />
w.r.t. <strong>Growth</strong><br />
w.r.t. Distribution<br />
<strong>Poverty</strong><br />
<strong>Reduction</strong> in<br />
Absolute <strong>Poverty</strong><br />
Bourguignon(2003)<br />
1980s-1990s 50 cos. 114 periods <strong>Poverty</strong> Rate (headcount, 1$PPP a day)<br />
Rate <strong>of</strong> change in <strong>Poverty</strong> Rate on Rate <strong>of</strong> change in Survey Means --- -1.65<br />
Rate <strong>of</strong> change in <strong>Poverty</strong> Rate on Rate <strong>of</strong> change in Survey Means & Gini --- -2.01 & 4.72<br />
Use <strong>of</strong> Cross Terms -- As expected, both a lesser level <strong>of</strong> development <strong>and</strong> a higher level <strong>of</strong> inequality reduce the growth<br />
elasticity <strong>of</strong> poverty.<br />
Bruno, Ravallion, <strong>and</strong> Squire (1998)<br />
1984-1993 20cos. <strong>Poverty</strong> Rate (headcount, 1$PPP a day)<br />
Rate <strong>of</strong> change in <strong>Poverty</strong> Rate on Rate <strong>of</strong> change in Survey Means & Gini --- -2.28 & 3.86<br />
Elasticity <strong>of</strong> <strong>Poverty</strong> <strong>Reduction</strong> w.r.t Distribution is Two Times Larger as compared to<br />
Elasticity <strong>of</strong> <strong>Poverty</strong> <strong>Reduction</strong> w.r.t <strong>Growth</strong> !!<br />
17<br />
Elasticities <strong>of</strong> <strong>Poverty</strong> <strong>Reduction</strong> – Crossing Effects<br />
<strong>Growth</strong><br />
Increases in<br />
Mean Income Level<br />
Trade-<strong>of</strong>f ?<br />
Development Governance<br />
Institutions<br />
(common factors?)<br />
<strong>Inequality</strong><br />
Distribution <strong>of</strong> Income<br />
Distribution <strong>of</strong> Assets<br />
Elasticity <strong>of</strong> <strong>Poverty</strong> <strong>Reduction</strong> 'Pro-Poor' Elasticity <strong>of</strong> <strong>Poverty</strong> <strong>Reduction</strong><br />
w.r.t. <strong>Growth</strong><br />
w.r.t. Distribution<br />
<strong>Poverty</strong><br />
<strong>Reduction</strong> in<br />
Absolute <strong>Poverty</strong><br />
Ravallion (2005) “<strong>Inequality</strong> is Bad for the Poor”<br />
Rate <strong>of</strong> poverty reduction = [-9.33*(1-<strong>Inequality</strong> index)3.031 ] * Ordinary growth rate<br />
Applied to 62 sample cos.<br />
As Gini increases from 20 to 60, the Elasticity <strong>of</strong> <strong>Poverty</strong> <strong>Reduction</strong> w.r.t. <strong>Growth</strong> declines from -4.3 to<br />
-0.6.<br />
18<br />
9
Figure 5: Exp<strong>and</strong>ed Analyses on the <strong>Poverty</strong>-<strong>Growth</strong>-<strong>Inequality</strong> <strong>Triangle</strong><br />
Globalization<br />
Trade Integration<br />
Financial Integration<br />
HR Integration<br />
<strong>Growth</strong><br />
Increases in<br />
Mean Income Level<br />
Trade-<strong>of</strong>f ?<br />
Development Governance<br />
Institutions<br />
(country specific)<br />
<strong>Inequality</strong><br />
Distribution <strong>of</strong> Income<br />
Distribution <strong>of</strong> Assets<br />
Elasticity <strong>of</strong> <strong>Poverty</strong> <strong>Reduction</strong> 'Pro-Poor' Elasticity <strong>of</strong> <strong>Poverty</strong> <strong>Reduction</strong><br />
w.r.t. <strong>Growth</strong><br />
w.r.t. Distribution<br />
Globalization<br />
<strong>Poverty</strong><br />
<strong>Reduction</strong> in<br />
Absolute <strong>Poverty</strong><br />
Source: Author<br />
19<br />
Figure 6 : <strong>Poverty</strong> incidence in China <strong>and</strong> India, 1981-2001<br />
Source : Ravallion (2005), Figure 12<br />
20<br />
10
Figure 7 : <strong>Inequality</strong> <strong>and</strong> average income in India<br />
Source : Bruno, Ravallion, <strong>and</strong> Squire (1996), Figure 1<br />
21<br />
Figure 8 : <strong>Inequality</strong> over time in India (more recent years)<br />
Source : Ravallion (2005), Figure 9<br />
22<br />
11
Figure 9 : Income inequality in rural <strong>and</strong> urban areas <strong>and</strong> nationally (China)<br />
Source : Ravallion <strong>and</strong> Chen (2004), Figure 5<br />
23<br />
<strong>The</strong> <strong>Poverty</strong>-<strong>Growth</strong>-<strong>Inequality</strong> <strong>Triangle</strong><br />
<strong>The</strong> End …..<br />
24<br />
12


