

Report
Report
Report

Create successful ePaper yourself
Turn your PDF publications into a flip-book with our unique Google optimized e-Paper software.
T OURISM AND TRAVEL RELATED SERVICES 119<br />
from South Asia – Pakistan – which is likely to create a<br />
little over one million jobs. In the WTTC study of 2003,<br />
Bangladesh too figured as one of the 10 countries that<br />
were likely to generate maximum number of travel and<br />
tourism jobs. However, it does not find its place in the<br />
studies of later years whereas India and Pakistan have<br />
consistently maintained their positions.<br />
On a relative scale India with an annualised<br />
growth rate of 8.6% ranks third in the list of top ten<br />
countries of the world expected to grow their travel<br />
and tourism demand fastest between 2006 and 2015<br />
(WTTC 2006). Even when the WTTC took the<br />
projection until 2017 instead of 2015 there was not<br />
much change in the India’s position and the results<br />
show that the People’s Republic of China, Montenegro<br />
and India are at the top of the list, with demand in the<br />
respective countries growing each year at a rate<br />
of 9.1%, 8.6% and 7.9% (WTTC 2007). These<br />
countries have consistently ranked in the top three<br />
positions over the past four years, consolidating<br />
their growth year on year. Their strong foothold in<br />
terms of performance is underscored by a sustained<br />
expansion in their travel and tourism industries as a<br />
result of focused strategic development and targeted<br />
investment.<br />
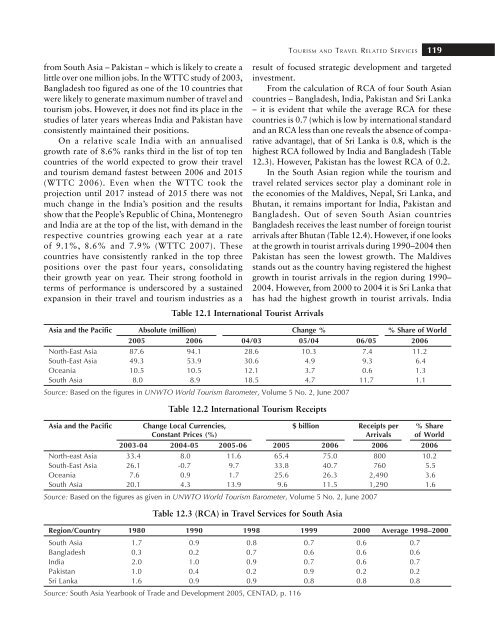
From the calculation of RCA of four South Asian<br />
countries – Bangladesh, India, Pakistan and Sri Lanka<br />
– it is evident that while the average RCA for these<br />
countries is 0.7 (which is low by international standard<br />
and an RCA less than one reveals the absence of comparative<br />
advantage), that of Sri Lanka is 0.8, which is the<br />
highest RCA followed by India and Bangladesh (Table<br />
12.3). However, Pakistan has the lowest RCA of 0.2.<br />
In the South Asian region while the tourism and<br />
travel related services sector play a dominant role in<br />
the economies of the Maldives, Nepal, Sri Lanka, and<br />
Bhutan, it remains important for India, Pakistan and<br />
Bangladesh. Out of seven South Asian countries<br />
Bangladesh receives the least number of foreign tourist<br />
arrivals after Bhutan (Table 12.4). However, if one looks<br />
at the growth in tourist arrivals during 1990–2004 then<br />
Pakistan has seen the lowest growth. The Maldives<br />
stands out as the country having registered the highest<br />
growth in tourist arrivals in the region during 1990–<br />
2004. However, from 2000 to 2004 it is Sri Lanka that<br />
has had the highest growth in tourist arrivals. India<br />
Table 12.1 International Tourist Arrivals<br />
Asia and the Pacific Absolute (million) Change % % Share of World<br />
2005 2006 04/03 05/04 06/05 2006<br />
North-East Asia 87.6 94.1 28.6 10.3 7.4 11.2<br />
South-East Asia 49.3 53.9 30.6 4.9 9.3 6.4<br />
Oceania 10.5 10.5 12.1 3.7 0.6 1.3<br />
South Asia 8.0 8.9 18.5 4.7 11.7 1.1<br />
Source: Based on the figures in UNWTO World Tourism Barometer, Volume 5 No. 2, June 2007<br />
Table 12.2 International Tourism Receipts<br />
Asia and the Pacific Change Local Currencies, $ billion Receipts per % Share<br />
Constant Prices (%) Arrivals of World<br />
2003-04 2004-05 2005-06 2005 2006 2006 2006<br />
North-east Asia 33.4 8.0 11.6 65.4 75.0 800 10.2<br />
South-East Asia 26.1 -0.7 9.7 33.8 40.7 760 5.5<br />
Oceania 7.6 0.9 1.7 25.6 26.3 2,490 3.6<br />
South Asia 20.1 4.3 13.9 9.6 11.5 1,290 1.6<br />
Source: Based on the figures as given in UNWTO World Tourism Barometer, Volume 5 No. 2, June 2007<br />
Table 12.3 (RCA) in Travel Services for South Asia<br />
Region/Country 1980 1990 1998 1999 2000 Average 1998–2000<br />
South Asia 1.7 0.9 0.8 0.7 0.6 0.7<br />
Bangladesh 0.3 0.2 0.7 0.6 0.6 0.6<br />
India 2.0 1.0 0.9 0.7 0.6 0.7<br />
Pakistan 1.0 0.4 0.2 0.9 0.2 0.2<br />
Sri Lanka 1.6 0.9 0.9 0.8 0.8 0.8<br />
Source: South Asia Yearbook of Trade and Development 2005, CENTAD, p. 116


