Create successful ePaper yourself
Turn your PDF publications into a flip-book with our unique Google optimized e-Paper software.
MIDTERM EXAM 1<br />
100 points total (6 questions)<br />
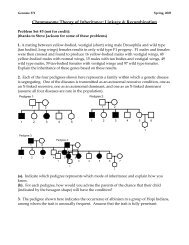
Problem 1. (20 points) In this pedigree, colorblindness is represented by horizontal hatching, and is<br />
determined by an X-linked recessive gene (g); the dominant allele for color-vision is (G). Hemophilia is<br />
represented by vertical hatching and is determined by the X-linked recessive gene (h); the dominant allele<br />
for normal blood clotting is (H).<br />
colorblind<br />
hemophilia<br />
husband<br />
mailman<br />
both<br />
P, R, or ?: _?_ _P_ _P_ _R_ _P_<br />
(a). What is the genotype of the female in generation 2. Show the arrangement of alleles on the X-<br />
chromosomes below.<br />
hG Hg<br />
or X h,G /X H,G<br />
(b). Indicate whether each child in the third generation received a parental combination of alleles (with a<br />
P) or a recombinant combination of alleles (with an R) from the mother. If it cannot be determined,<br />
indicate with a (?)<br />
(c). When the husband walks in on his wife and the mailman, he becomes so infuriated that he<br />
immediately files for divorce and takes his three kids to live in another state with him; he forbids his three<br />
children to see or even talk with their cheating mother. The mother, finding out during the divorce trial<br />
that she is pregnant with the mailman’s child, rushes to marry him. Together, the new couple has a total<br />
of two children (as shown in the above pedigree). Yet, the mother and mailman’s always keep the secret<br />
of the mother’s previous family from their children. However, when the female child (offspring of the<br />
mother and the mailman/2nd husband) meets the colorblind male (offspring of the mother and her first<br />
husband) at college, they fall in love, elope, and are currently expecting their first child.<br />
What is the probability that this child will be colorblind?<br />
Male = X g Y = 50%<br />
Female = X g X g = 50%<br />
What is the probability that this child will have hemophilia?<br />
X H,G /Y<br />
X H,G /X h,g<br />
Male = X h Y = 50%<br />
1
Female = X h X h = 0%<br />
2
Problem 2 (20 points) You acquire a female tabby cat (not orange or silver; see the projection in class)<br />
and a solid black male cat.<br />
(a). What can you say about the genotypes of the two cats with respect to the Agouti (A/a), orange<br />
(X O /X o ), and I (I/i) genes? Use a “?” to indicate every allele that you are uncertain about.<br />
Female tabby cat genotype: A? X o X o ii<br />
Male black cat genotype: aa X o ??<br />
(b). Your two cats mate with each other and the first litter of kittens produces 2 tabby kittens that look<br />
just like the mother, 2 silver tabby kittens and 1 black kitten. Now what can you say about the genotypes<br />
of the parent cats?<br />
Female tabby cat genotype: Aa X o X o ii<br />
Male black cat genotype: aa X o Ii<br />
(c). Your two cats produce a total of 48 more kittens over the years. Shortly after the first litter of<br />
kittens, however, you got a new neighbor who owns a male black cat that you find out is an aa ii<br />
homozygote. As your tabby cat produces litters year after year, you begin to wonder if she has been<br />
having an affair with the next-door cat. Tabulating all the kittens your tabby cat has produced gives data<br />
shown in the table below:<br />
Kitten phenotype Expected (E) Observed (O) (O-E) 2 (O-E) 2 /E<br />
Standard tabby 12 19 49 4.1<br />
Silver tabby 12 6 36 3<br />
Black 24 23 1 0<br />
Fill in the “Expected” column in the table above based on the hypothesis that your tabby has been mating<br />
exclusively with YOUR black male cat. Be sure to show how you arrived at these values.<br />
Use χ 2 analysis to evaluate your hypothesis:<br />
χ 2 value = _7.1_________ # of degrees of freedom = _2__________ P value = __0.025________<br />
(d). What do you conclude about the parentage of the kittens (BE SPECIFIC)?<br />
The P value is below 0.05 so the odds of a chance deviation from my hypothesis of this magnitude is<br />
extremely remote. Therefore I reject the hypothesis and conclude that some of the kittens were likely the<br />
result of matings with the next-door cat.<br />
(e). Why could you NOT have hypothesized that the neighbor’s cat had fathered SOME of the kittens,<br />
and test that hypothesis by χ 2 analysis?<br />
Because you do not know how many kittens were produced by the next door neighbor’s cat. Without this<br />
information you cannot define the expected outcome.<br />
3
Problem 3. (25 points) From experiments discussed in quiz section 5 you learned the following about the<br />
inheritance pattern of bristle length, eye shape, and body color in Drosophila:<br />
Bristle length: The long bristle phenotype (L) is dominant to short bristles (l).<br />
Eye shape: The half-moon eye phenotype (H) is dominant to round eyes (h).<br />
Body color: The gray body color phenotype (G) is dominant to amber body color (g).<br />
Additionally, you learned that the genes responsible for all three of these traits reside on the X-<br />
chromosome and that the body color gene (G) and bristle length gene (L) are linked to a polymorphic<br />
DNA marker (here designated M). The linkage relationships are shown below.<br />
G<br />
M<br />
17cM L M<br />
35cM<br />
Both the body color gene (G) and the bristle length gene (L) are linked to the marker, but it is not known<br />
if the two genes are linked to each other, and their order relative to the marker (M). To further evaluate<br />
their linkage relationship, you examine the progeny of the same female/male pair that was examined in<br />
lab. (Recall that the female was a long, round, gray fly and the male was a long, half-moon, amber fly.)<br />
Suppose that when these flies were mated, the progeny had the phenotypes for bristle length, body color,<br />
and eye shape as listed below.<br />
Cross: long, round, gray female x long, half-moon, amber male<br />
Phenotype # Females # Males Total<br />
Long, gray, round 0 249 249<br />
Long, gray, half-moon 502 0 502<br />
Long, amber, round 0 253 253<br />
Long, amber, half-moon 498 0 498<br />
Short, gray, round 0 247 247<br />
Short, gray, half-moon 0 0 0<br />
Short, amber, round 0 251 251<br />
Short, amber, half-moon 0 0 0<br />
TOTAL 1000 1000 2000<br />
(a). Using the data in the table above, draw out the genetic order of the body color gene (G), bristle length<br />
gene (L), and the marker (M), and indicate the distances between each gene and the marker, and the<br />
distance between the two genes.<br />
Since the body color gene (G) and bristle length gene (L) are both linked to the same molecular marker<br />
there are two possible maps that are consistent with the known linkage relationships to the marker:<br />
4
G<br />
17cM<br />
M<br />
35cM<br />
L<br />
52cM<br />
OR<br />
L<br />
18cM<br />
G<br />
17cM<br />
M<br />
35cM<br />
The data above indicate that the G and L genes are segregating independently. Therefore, these genes<br />
must be 50cM or more apart. This indicates that the first genetic map is correct.<br />
(b). What does the data in the table above say about the linkage relationship between the genes?<br />
This says that the G and L genes are unlinked.<br />
Information about the location of the half-moon gene (H) on the X-chromosome is still not known.<br />
Suppose you want to see if it is linked to the body color gene (G). You identify the mutation causing the<br />
recessive short bristle trait, and observe that it creates a restriction enzyme site (see below). You create a<br />
probe that is complementary to this gene that can be used in Southern blot analysis.<br />
probe<br />
2kb<br />
5kb<br />
3kb<br />
G<br />
g<br />
= restriction site<br />
You take one of your long, gray, half-moon female progeny (from the previous cross) that is<br />
heterozygous for all genes and mate it to a test cross male.<br />
(c). What is the genotype of the FEMALE used in this testcross? Indicate dominant and recessive genes<br />
on each X chromosome (you should be able to deduce this genotype from the cross that produced this<br />
female).<br />
l<br />
h<br />
G<br />
L<br />
H<br />
g<br />
You extract DNA from the female and testcross male used in this cross, as well as all female offspring<br />
from this cross that have half-moon eyes. You proceed to perform the restriction digest and probe for the<br />
body color gene. Representative results are shown below:<br />
5
parents<br />
half-moon female progeny derived from the cross<br />
5kb<br />
2kb<br />
(d). Assuming the results shown above are representative of results obtained with the remaining halfmoon<br />
female offspring, what does this information suggest about the linkage relationship between the G<br />
and H genes? If they are linked, what map distance separates the genes?<br />
There appear to be six parental types and 4 recombinant types (circled) among the half-moon female<br />
progeny. Since the recombinant types are found less often than the parental types these results are<br />
consistent with linkage between the molecular marker and the Half-moon trait. Because the RFLP<br />
corresponds to the body color trait (G), these results indicate that G and half-moon (H) are linked. The<br />
map distance separating the G and H genes is calculated as follows:<br />
4/10(100) = 40cM<br />
(e). Draw the genetic map that is consistent with this data and that from the first part of this problem. Be<br />
sure to show the L, G, and H genes and M marker on the map and the linkage distances separating these<br />
genes/markers. Indicate the two possible locations for the half-moon gene (H) that are consistent with<br />
this data.<br />
H<br />
40cM<br />
G<br />
17cM<br />
M<br />
35cM<br />
L<br />
OR<br />
G<br />
17cM<br />
M<br />
35cM<br />
H<br />
L<br />
40cM<br />
Problem 4. (15 total points) You are studying aging in fruit flies and have generated six different<br />
homozygous long-lived fly mutants (you may assume that each of these mutant strains bears a mutation<br />
affecting only ONE gene). You now wish to determine how many genes these six mutants represent and<br />
proceed to set up pairwise crosses with all of the homozygous mutants. Results of this analysis are shown<br />
in the table below (where the intersection represents the phenotype of the offspring resulting from a<br />
particular cross):<br />
Mut 1 Mut 2 Mut 3 Mut 4 Mut 5 Mut 6 WT<br />
6
Mut 1 - + - - + + +<br />
Mut 2 - + + + - +<br />
Mut 3 - - + + +<br />
Mut 4 - + + +<br />
Mut 5 - + +<br />
Mut 6 - +<br />
+ indicates all offspring have normal lifespan.<br />
- indicates all offspring are long-lived.<br />
WT = a wild type strain of flies.<br />
(a). How many complementation groups do these mutations represent?<br />
These mutations represent 3 complementation groups<br />
(b). Describe which mutations fall into each complementation group.<br />
One complementation group consists of the mutations 1, 3 and 4<br />
Another group consists of the mutations 2 and 6<br />
The third group consists of mutation 5<br />
(c). In more recent experiments you isolate another long-lived fly mutant (Mut 7) and proceed to cross<br />
this mutation to your previously characterized long-lived mutants with the following results:<br />
Mut 1 Mut 2 Mut 3 Mut 4 Mut 5 Mut 6 WT<br />
Mut 7 - - - - - - -<br />
+ indicates all offspring have normal lifespan.<br />
- indicates all offspring are long-lived.<br />
WT = a wild type strain of flies.<br />
What are these results telling you?<br />
When you cross Mut 7 to WT you get long-lived mutants. This tells you that Mut 7 is a dominant<br />
mutation. Therefore, you would expect to see the long-lived phenotype with whatever you cross this<br />
mutant to (i.e., it fails to complement everything it is crossed to). This is why dominant mutations cannot<br />
be used in complementation experiments.<br />
ANSWER EITHER ONE OF THE FOLLOWING TWO QUESTIONS (if you answer both, you<br />
will receive the statistical average of the two scores):<br />
Problem 5. (20 total points) The following graph illustrates the time course of DNA repair in E. coli<br />
following UV-light induced DNA damage. Each curve on the graph represents the result of a particular<br />
experiment carried out using either wild type or UV-sensitive E. coli mutants.<br />
7
(1)<br />
DNA<br />
damage<br />
per kb<br />
(2)<br />
(3)<br />
UV light<br />
Time<br />
Given your knowledge of UV-induced DNA damage repair in E. coli, choose the curve (1, 2, or 3) from<br />
the above graph that most closely resembles the outcome you would expect from the E. coli cell types and<br />
experimental conditions described in the table below (you can use the same curve multiple times):<br />
E. coli Cell Type<br />
wild type<br />
wild type<br />
uvrA mutant<br />
phr mutant<br />
Experimental Conditions<br />
in blue ( 300-500nm ) light<br />
in dark<br />
in dark<br />
in blue ( 300-500nm ) light<br />
Corresponding Curve (1, 2, or 3)<br />
8
Problem 6. (20 points) E. coli strains bearing a mutation of the deoxyadenosine methylase (dam - ) show<br />
elevated mutation rates relative to wild type cells, owing to a defect in mismatch repair (for reasons<br />
discussed in class). However, the production of very high levels of the wild type enzyme in E. coli cells<br />
also results in increased mutation rates relative to wild type E. coli strains. From your knowledge of the<br />
normal role this enzyme plays in mismatch repair processes, propose an explanation for this finding (a<br />
diagram may help immensely).<br />
Increased methylating activity could decrease the time during which the newly polymerized DNA is<br />
hemimethylated. The mismatch repair enzymes would then have less of an opportunity to find a<br />
hemimethylated strand of DNA to use as a guide to distinguish between parental and daughter DNA<br />
strands. As a result, fewer mismatches would be repaired, and for those that are repaired fewer would be<br />
repaired in the correct fashion and the mutation rate would increase.<br />
9