SOLAR GENERATION - Greenpeace
SOLAR GENERATION - Greenpeace
SOLAR GENERATION - Greenpeace

You also want an ePaper? Increase the reach of your titles
YUMPU automatically turns print PDFs into web optimized ePapers that Google loves.
OECD Pacific<br />
PV market. The tariff should decrease annually in relation to<br />
progress in reducing production costs. This phased programme<br />
should lead to a self-sufficient market and much lower costs for<br />
PV installations.<br />
An export market will also become increasingly important for<br />
the expanding PV industry in Germany, and will be vital to<br />
maintain the market development assumed in this scenario. In<br />
March 2001 a new export initiative was launched by German<br />
PV manufacturers and dealers, coordinated by the Fraunhofer<br />
Institute for Solar Energy Systems. The aim of this initiative is<br />
to provide better information and develop new mechanisms to<br />
expand the use of off-grid applications.<br />
Japan offers by far the largest and most developed PV market in<br />
this region. The Japanese target is to reach almost 4.8 GWp<br />
installed capacity by the year 2010. Since 2001 the market has<br />
grown by 75%, a growth rate based on a strong national PV<br />
support programme in which the residential sector plays an<br />
important role. Japan also has a clear policy of linking domestic<br />
demand to an expanding industrial sector. Alongside this<br />
regional leader, a smaller but increasingly important market is<br />
expected to develop in Australia. The scenario shows that, with<br />
annual growth rates on a substantial but realistic level, the<br />
region will eventually become the strongest market in the<br />
world.<br />
CASE STUDY: <strong>SOLAR</strong> <strong>GENERATION</strong> IN AUSTRALIA<br />
Australia has the potential to develop its own large solar PV<br />
industry and become a significant force in the Asia Pacific<br />
region. In the 1980s Australia led the world both in research<br />
and development and installed capacity of PV. Due to a lack of<br />
federal or state government support and a meaningful policy<br />
framework, this position was lost, but against the background<br />
of government action in Japan and Germany to create a PV<br />
market, Australia now has the opportunity to rebuild.<br />
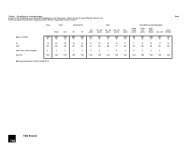
Table 4.7: Cumulative installed PV power in Australia by sub-market<br />
Sub-market /<br />
application<br />
31<br />
Dec.<br />
1992<br />
kWp<br />
31<br />
Dec.<br />
1993<br />
kWp<br />
31<br />
Dec.<br />
1994<br />
kWp<br />
31<br />
Dec.<br />
1995<br />
kWp<br />
31<br />
Dec.<br />
1996<br />
kWp<br />
31<br />
Dec.<br />
1997<br />
kWp<br />
31<br />
Dec.<br />
1998<br />
kWp<br />
31<br />
Dec.<br />
1999<br />
kWp<br />
31<br />
Dec.<br />
2000<br />
kWp<br />
31<br />
Dec.<br />
2001<br />
kWp<br />
31<br />
Dec.<br />
2002<br />
kWp<br />
31<br />
Dec.<br />
2003<br />
kWp<br />
off-grid domestic 1,560 2,030 2,600 3,270 4,080 4,860 5,960 6,820 9,110 10,960 12,140 13,590<br />
off-grid non<br />
domestic<br />
grid connected<br />
distributed<br />
grid connected<br />
centralized<br />
5,760 6,865 8,080 9,380 11,520 13,320 15,080 16,360 17,060 19,170 22,740 26,060<br />
5 20 30 80 200 850 1,490 2,390 2,800 3,400 4,630<br />
20 20 320 630 650 650 650 850 1,350<br />
Total 7,320 8,900 10,700 12,700 15,700 18,700 22,520 25,320 29,210 33,580 39,130 45,630<br />
Notes: 1. Grid connected centralized systems include flat plate and concentrator PV power stations connected both to main and to diesel grid systems, with their own substation.<br />
These include several large building rooftop systems. 2. A variety of small modules (< 40 Wp) are also used extensively around Australia, typically for consumer appliances and lighting.<br />
Table 4.8: Solar market in Australia to 2020<br />
Year MW MWh tCOc<br />
Market Volume<br />
in US$m<br />
Jobs<br />
2003 7 28,266 16,960 25 201<br />
2005 9 52,290 31,374 32 289<br />
2010 107 436,751 262,051 270 3,303<br />
2020 2,597 13,214,057 7,928,434 3,540 79,786<br />
Total 2000 t0 2020 9,331 46,947,838 28,168,703<br />
37