SOLAR GENERATION - Greenpeace
SOLAR GENERATION - Greenpeace
SOLAR GENERATION - Greenpeace

You also want an ePaper? Increase the reach of your titles
YUMPU automatically turns print PDFs into web optimized ePapers that Google loves.
PART FOUR: THE <strong>SOLAR</strong> FUTURE<br />
The EPIA Road Map<br />
The European Photovoltaic Industry Association (EPIA),<br />
representing the majority of the European PV industry, published<br />
a new road map in 2004. This manifesto outlines the European<br />
PV industry’s priorities for achieving the objectives of the<br />
European Union in relation to installed PV capacities. EPIA has<br />
devised a programme of specific actions which the European<br />
industry, in collaboration with other key stakeholders from the<br />
research, policy, finance, electricity, construction and other<br />
sectors, should adopt in order for Europe to capitalise on the<br />
global PV market.<br />
The EPIA road map highlights the key obstacles and issues that<br />
must be resolved before PV can contribute substantially both to<br />
European and global energy supply. It is intended to serve as a<br />
guide for the European industry, including research priorities, up<br />
to 2010 and beyond, and as a framework for political action to<br />
help realise solar electricity’s potential to become a major<br />
contributor to electricity generation during this century.<br />
(www.epia.org)<br />
CASE STUDY: <strong>SOLAR</strong> <strong>GENERATION</strong> IN GERMANY<br />
Germany is currently the key player in the European PV market.<br />
As a result of the support provided by the Renewable Energy<br />
Law, together with the 100,000 roofs programme (available<br />
until mid 2003), the average annual growth rate between 2000<br />
and 2005 is expected to be 30%. Following the conclusion of the<br />
roofs programme in 2003, however, the annual growth rate is<br />
assumed to drop to 25% between 2006 and 2009 and to 20%<br />
between 2010 and 2020.<br />
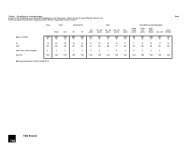
Table 4.6 summarises the findings of a case study on Germany<br />
in which we looked at the potential increase (at five year<br />
intervals) in installed capacity, as well as electricity generation,<br />
carbon savings, jobs created and the total value of the PV<br />
market. The results show that the electricity output from PV<br />
generation could reach 3.2 TWh by 2010. This is equivalent to<br />
the output of a centralised coal-fired power plant. By 2015 solar<br />
electricity would cover more than 1.5% of Germany’s electricity<br />
demand and by 2020 more than 3.5%. The cumulative installed<br />
capacity would reach 18,477 MW by 2020.<br />
Within the next 20 years the German PV industry could create<br />
80,000 jobs in installation, service and maintenance alone. If<br />
all the modules were manufactured in Germany itself this<br />
would create up to 50,000 additional jobs.<br />
Government policy and programmes<br />
Following a 1,000 roofs programme in the 1990s, the 100,000<br />
roofs programme was introduced in 1999, a programme that<br />
provided low interest loans for the purchase of PV systems. By<br />
itself, this programme had a limited success, and the solar<br />
boom in Germany only started with the introduction of the<br />
Renewable Energy Law in April 2000, which provided premium<br />
tariffs for solar electricity. Until mid 2003 the 100,000 roofs<br />
programme and the premium tariff system operated in parallel.<br />
After the ending of the 100,000 roofs programme, the feed-in<br />
tariff was revised at the beginning of 2004 in order to<br />
compensate for the fact that low interest loans were no longer<br />
available. These new and higher premium feed-in tariffs<br />
triggered an even stronger solar electricity boom in Germany.<br />
Estimates for new capacity expected to be installed during<br />
2004 range up to 300 MWp.<br />
Apart from the attractive feed-in tariff payments there are<br />
several factors responsible for the success of this support<br />
scheme.<br />
• The level of the feed-in tariff is high enough to make solar<br />
electricity a viable choice for the investor.<br />
• The utility is obliged to buy solar electricity at the fixed tariff.<br />
• The extra costs for solar electricity are not paid by the state but<br />
by all electricity customers, resulting in a very limited additional<br />
financial burden (in 2003 the extra cost per household was ¤12).<br />
• The system favours the installation of high quality solar<br />
electricity units and the owner has a strong incentive to both<br />
maintain the system and maximise energy output for at least 20<br />
years.<br />
• The tariff is fixed for 20 years, which means security of planning<br />
for investors.<br />
• At the beginning of each year the feed-in tariff is reduced by 5%,<br />
but only for solar electricity systems newly installed that year. For<br />
existing systems the tariff remains the same. This feature aims to<br />
reflect the expected price decrease in solar electricity and provides<br />
an important incentive for the PV industry to reduce its<br />
costs.<br />
• The support scheme has led to financial pay back periods of<br />
between 13 and 15 years, leaving the owner with a surplus after<br />
20 years.<br />
If the Solar Generation scenario is to be realised then the feedin<br />
tariffs available under the Renewable Energy Law, need to be<br />
maintained until 2020 in order to avoid a collapse of the solar<br />
Table 4.6: Solar market in Germany to 2020<br />
Year MW MWh tCOc<br />
Market Volume<br />
in dm<br />
Jobs<br />
2003 139 347,500 208,500 473 4,265<br />
2005 320 806,900 484,140 953 9,900<br />
2010 644 3,288,096 1,972,858 1,404 19,869<br />
2020 2,604 18,316,491 10,989,895 3,076 80,380<br />
Total 2000 t0 2020 18,477 15,016,932 66,964,140<br />
36