SOLAR GENERATION - Greenpeace
SOLAR GENERATION - Greenpeace
SOLAR GENERATION - Greenpeace

You also want an ePaper? Increase the reach of your titles
YUMPU automatically turns print PDFs into web optimized ePapers that Google loves.
Table 4.4: Fall in Price of PV electricity in selected cities 2000-2020<br />
Region<br />
kWh/<br />
( year*<br />
kWp )<br />
2005<br />
¤/<br />
kWh<br />
2010<br />
¤/<br />
kWh<br />
2015<br />
¤/<br />
kWh<br />
2020<br />
¤/<br />
kWh<br />
Berlin 900 0.40 0.30 0.26 0.19<br />
Paris 1000 0.36 0.27 0.24 0.18<br />
Washington 1200 0.30 0.23 0.20 0.15<br />
Hongkong 1300 0.28 0.21 0.18 0.13<br />
Sydney 1400 0.26 0.19 0.17 0.13<br />
Mumbai 1400 0.26 0.19 0.17 0.13<br />
Bangkok 1600 0.23 0.17 0.15 0.11<br />
Dubai 1800 0.20 0.15 0.13 0.10<br />
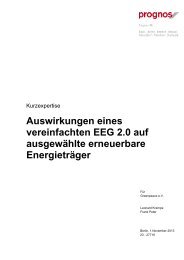
Figure 4.3: Global Investment in new PV prduction facilities<br />
80,000<br />
70,000<br />
60,000<br />
50,000<br />
40,000<br />
30,000<br />
20,000<br />
10,000<br />
Module Shipment worldwide [MW]<br />
Additional production capacity needed [MW]<br />
Investment production facilities [¤m]<br />
Source: PV 2010<br />
Investment Market Volume [¤m]<br />
Total investment [¤m]<br />
2005<br />
2010 2015 2020<br />
shows that the global value of the solar power market will<br />
have reached more than $ 70 billion by the end of the scenario<br />
period. Investment in new production facilities will reach $ 13.2<br />
billion by 2020. The overall market volume for PV systems will<br />
increase to $ 62 billion. Just over $ 9.6 billion of that value will<br />
be located in Europe, $ 8.7 billion in the Pacific region and $ 5.6<br />
billion in Africa.<br />
4. Carbon Dioxide Reductions<br />
A reduction in the levels of carbon dioxide being emitted into the<br />
world’s atmosphere is the most important environmental<br />
benefit from solar power generation. Carbon dioxide is the gas<br />
largely responsible for exacerbating the greenhouse effect,<br />
leading to the disastrous consequences of global climate change.<br />
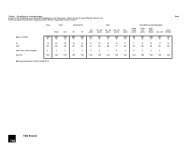
Table 4.5: Value of regional PV market in Million ¤<br />
Year<br />
OECD<br />
Europe<br />
OECD<br />
N. America<br />
OECD<br />
Pacific<br />
Latin<br />
America<br />
East Asia<br />
South<br />
Asia<br />
China<br />
Middle<br />
East<br />
Africa ROW Total<br />
2003 625 220 798 129 39 52 98 23 77 14 2,075<br />
2004 1,001 247 890 157 49 57 128 27 90 15 2,661<br />
2005 1,073 278 1,043 191 62 69 150 31 105 17 3,019<br />
2006 1,258 378 1,272 234 78 87 183 47 133 21 3,691<br />
2007 1,477 515 1,553 285 99 110 224 71 168 25 4,527<br />
2008 1,734 702 1,896 348 126 140 274 107 214 31 5,572<br />
2009 2,037 956 2,317 425 159 178 334 160 271 38 6,875<br />
2010 2,348 1,169 2,616 540 217 242 456 204 357 50 8,199<br />
2011 2,708 1,431 2,955 687 297 331 622 259 471 66 9,827<br />
2012 3,123 1,752 3,339 873 405 452 850 329 620 87 11,830<br />
2013 3,602 2,144 3,773 1,110 553 617 1,160 419 818 115 14,311<br />
2014 4,154 2,624 4,262 1,410 755 842 1,584 532 1,078 151 17,392<br />
2015 4,790 3,211 4,814 1,792 1,030 1,149 2,161 676 1,420 199 21,242<br />
2016 5,521 3,927 5,435 2,276 1,406 1,567 2,948 858 1,871 262 26,071<br />
2017 6,359 4,801 6,133 2,889 1,917 2,137 4,020 1,090 2,463 345 32,154<br />
2018 7,321 5,865 6,916 3,665 2,612 2,912 5,478 1,383 3,240 454 39,846<br />
2019 8,421 7,160 7,793 4,647 3,556 3,965 7,458 1,753 4,260 597 49,610<br />
2020 9,679 8,734 8,775 5,886 4,838 5,395 10,147 2,220 5,596 785 62,054<br />
33