SOLAR GENERATION - Greenpeace
SOLAR GENERATION - Greenpeace
SOLAR GENERATION - Greenpeace

You also want an ePaper? Increase the reach of your titles
YUMPU automatically turns print PDFs into web optimized ePapers that Google loves.
PART FOUR: THE <strong>SOLAR</strong> FUTURE<br />
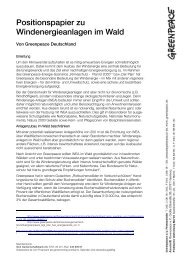
Figure 4.1: Growth in world solar market by application<br />
25 [MW peak]<br />
20<br />
15<br />
Grid connected<br />
Remote Industrial<br />
Off-grid rural (mainly DC)<br />
Consumer Appl.<br />
Table 4.3: Employment in PV related jobs world wide<br />
Year<br />
Jobs in<br />
Production<br />
Jobs in<br />
installation,<br />
retailing<br />
Jobs in<br />
maintenance<br />
Total<br />
2003 8,144 17,451 2,354 27,949<br />
2004 9,027 22,568 3,106 34,701<br />
2005 9,733 29,199 4,079 43,011<br />
2006 12,589 37,768 5,338 55,695<br />
10<br />
5<br />
2007 14,657 48,856 6,967 70,480<br />
2008 18,961 63,203 9,073 91,237<br />
2009 24,531 81,769 11,799 118,099<br />
2010 27,950 104,813 16,822 149,585<br />
2000<br />
2005<br />
2010 2015 2020<br />
2011 35,907 134,651 23,738 194,296<br />
2012 46,240 173,401 33,230 252,871<br />
By 2040, the penetration of solar generation would be even<br />
deeper. Assuming that overall global power consumption had<br />
by then increased from 25,578 to 36,000 TWh, the solar<br />
contribution would equal 21% of the world’s electricity output.<br />
This would place solar power firmly on the map as an<br />
established energy source.<br />
2. Employment<br />
More jobs are created in the installation and servicing of PV<br />
systems than in their manufacture. Based on information<br />
provided by the industry, it has been assumed that today’s 17<br />
jobs per MW in production will be reduced to 15 in 2010,<br />
decreasing to 10 jobs per MW between 2010 and 2020. About<br />
30 jobs per MW will be created during the process of installation,<br />
retailing and providing other local services up to 2010, reducing<br />
to 26 jobs per MW between 2010 and 2020. As far as maintenance<br />
is concerned it is assumed that with the more efficient business<br />
structures and larger systems of the industrialised world, about<br />
one job will be created per installed MW. Since developing<br />
world markets will play a more significant role beyond 2010,<br />
however, the proportion of maintenance work is assumed to<br />
steadily increase up to 2 jobs per MW by 2020.<br />
The result is that by 2020, an estimated 2.25 million full time<br />
jobs would have been created by the development of solar<br />
power around the world. Over half of those would be in the<br />
installation and marketing of systems<br />
2013 59,701 223,880 46,234 329,815<br />
2014 77,294 289,852 64,029 431,175<br />
2015 100,364 376,366 88,370 565,100<br />
2016 130,727 490,226 121,673 742,625<br />
2017 170,834 640,629 167,268 978,731<br />
2018 224,017 840,065 229,764 1,293,846<br />
2019 294,815 1,105,555 315,561 1,715,931<br />
2020 389,438 1,460,391 412,920 2,262,749<br />
3. Costs and Investment<br />
The falling cost of PV cells and modules has been a crucial<br />
factor in the recent development of the technology. An<br />
indication of the potential for increased efficiency in the<br />
production of cells has been given in Part Two, together with<br />
the likely shift in favour of cheaper thin film technologies.<br />
In this scenario it is projected that the price per Wp for<br />
additional production sites will drop from today’s $ 1.69 to $ 1.12<br />
by 2010. Between 2010 and 2020 a further price decrease is<br />
anticipated. On the basis that the current progress ratio is<br />
maintained, an ex-works price of ¤ 2/Wp for crystalline<br />
modules will be achieved by 2010.<br />
In terms of delivered electricity, it is possible to make<br />
predictions for the output from grid-connected systems. The<br />
results are given for an average consumer in some of the major<br />
cities of the world (see Table 4.4). These show that by 2020 the<br />
cost of solar electricity in the most insolated regions - the<br />
Middle East, Asia, South America and Australasia - will have<br />
more than halved to as little as 10-13 S cents/kWh in the best<br />
conditions. This would make PV power competitive with typical<br />
electricity prices paid by end consumer households.<br />
Of equal importance in relation to falling costs is the level of<br />
investment in manufacturing capacity. Here the scenario<br />
32