SOLAR GENERATION - Greenpeace
SOLAR GENERATION - Greenpeace
SOLAR GENERATION - Greenpeace

Create successful ePaper yourself
Turn your PDF publications into a flip-book with our unique Google optimized e-Paper software.
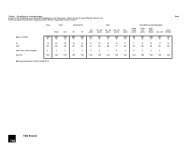
Table 4.2: Projected growth of world solar power market up to 2020<br />
Year<br />
Annual Installed<br />
Capacity [MW]<br />
Annual Growth Rate<br />
[%]<br />
Estimated Annual PV<br />
Electricity Production<br />
[MWh]<br />
Estimated Reduction<br />
of COc [tCOc]<br />
Estimated Jobs<br />
1995 Market datas 79 12.3 539,148 323,488 4,343<br />
from EPIA, all<br />
other figures<br />
1996 calculated<br />
89 13.5 661,246 396,747 4,932<br />
1997 126 41.6 834,103 500,461 6,908<br />
1998 153 21.1 1,044,000 626,400 8,410<br />
1999 201 31.9 1,319,748 791,848 10,950<br />
2000 259 38.0 1,675,065 1,005,039 13,665<br />
2001 334 28.9 2,214,220 1,328,532 16,778<br />
2002 439 31.4 2,802,000 1,681,200 22,472<br />
2003 594 35.3 3,582,897 2,149,738 27,949<br />
2004 815 approx. 37.0 4,471,497 2,682,898 34,702<br />
2005 985 28.0 5,739,803 3,443,882 43,011<br />
2006 1,283 28.0 7,405,441 4,443,265 55,696<br />
2007 1,675 28.0 9,599,060 5,759,436 70,479<br />
2008 2,192 28.0 12,496,836 7,498,101 91,237<br />
2009 2,877 28.0 16,337,415 9,802,449 118,099<br />
2010 3,634 35.0 21,206,382 12,723,829 149,585<br />
2011 4,609 35.0 27,403,933 16,442,360 194,296<br />
2012 5,870 35.0 35,326,026 21,195,615 252,871<br />
2013 7,511 35.0 45,497,490 27,298,494 329,815<br />
2014 9,656 35.0 58,617,385 35,170,431 431,174<br />
2015 12,475 35.0 75,621,343 45,372,806 565,100<br />
2016 16,199 35.0 97,767,586 58,660,552 742,625<br />
2017 21,146 35.0 126,755,998 76,053,599 978,731<br />
2018 27,753 35.0 164,893,480 98,936,088 1,293,846<br />
2019 36,622 35.0 215,324,289 129,194,573 1,715,930<br />
2020 48,590 35.0 282,351,761 169,411,057 2,262,749<br />
2000 to 2020 205,518 1,215,755,982 730,266,385 9,410,810<br />
satisfy the current electricity needs of 10% of the expanded<br />
European Community (EU 25).<br />
The global installed capacity of solar power systems would<br />
reach 205 GWp by 2020. More than half of this would be in the<br />
grid-connected market, mainly in industrialised countries.<br />
Assuming that 80% of these systems are installed on residential<br />
buildings, and their average size is 3 kWp, each serving the<br />
needs of three people, the total number of people by then<br />
generating their own electricity from a grid-connected solar<br />
system would reach 93 million. In Europe alone there would be<br />
roughly 31 million people receiving their supply from gridconnected<br />
solar electricityB.<br />
In the non-industrialised world approximately 30 GWp of solar<br />
capacity is expected to have been installed by 2020 in the rural<br />
electrification sector. Here the assumption is that as an average<br />
a 100 Wp stand alone system will cover the basic electricity<br />
needs of 3-4 persons per dwelling. Since system sizes are much<br />
smaller and the population density greater, this means that up<br />
to 950 million people in the developing countries would by<br />
then be using solar electricity. This would represent a major<br />
breakthrough for the technology from its present emerging<br />
status.<br />
1. Average European household: 2.5 people with a consumption of 3,800 kWh per year<br />
31