SOLAR GENERATION - Greenpeace
SOLAR GENERATION - Greenpeace
SOLAR GENERATION - Greenpeace

You also want an ePaper? Increase the reach of your titles
YUMPU automatically turns print PDFs into web optimized ePapers that Google loves.
GREENPEACE · EUROPEAN PHOTOVOLTAIC INDUSTRY ASSOCIATION<br />
<strong>SOLAR</strong> <strong>GENERATION</strong><br />
<strong>SOLAR</strong> ELECTRICITY FOR OVER 1 BILLION PEOPLE<br />
AND 2 MILLION JOBS BY 2020<br />
1<br />
OCTOBER 2004
CONTENTS<br />
Foreword . . . . . . . . . . . . . . . . . . . . . . . . . . . . . . . . . . . . . . . . . . . . . . . . . . . . . . . 3<br />
Executive Summary . . . . . . . . . . . . . . . . . . . . . . . . . . . . . . . . . . . . . . . . . . . . . . . . 6<br />
Part One: Solar Basics . . . . . . . . . . . . . . . . . . . . . . . . . . . . . . . . . . . . . . . . . . . . . . . 9<br />
Part Two: The Solar Power Market . . . . . . . . . . . . . . . . . . . . . . . . . . . . . . . . . . . . . . 15<br />
Part Three: The Solar Race . . . . . . . . . . . . . . . . . . . . . . . . . . . . . . . . . . . . . . . . . . . . 21<br />
Part Four: The Solar Future . . . . . . . . . . . . . . . . . . . . . . . . . . . . . . . . . . . . . . . . . . . 29<br />
Part Five: Winners and Losers in the Solar Generation . . . . . . . . . . . . . . . . . . . . . . . . . 45<br />
Note: The currency used in this report is mainly the Euro (¤) with the US dollar in some sections on<br />
non-European countries. It is assumed that, averaged over long timescales, the two currencies have an<br />
exchange rate of 1:1.<br />
2
FOREWORD<br />
The European Commission’s Directorate-General for Enterprise sees the photovoltaic industry<br />
as a key high-technology sector and has been a major contributor to the creation of a European<br />
Photovoltaic Technology Platform. This initiative will help secure the innovation, high<br />
investment and strong collaboration between research and industry required by the sector and<br />
also help take Europe closer to the Lisbon goal of becoming “the most competitive and dynamic<br />
knowledge-based economy in the world, capable of sustainable economic growth with more<br />
and better jobs and greater social cohesion”.<br />
Climate change is a key challenge that needs to be tackled by competitive eco-technologies. The<br />
European Union has played a leading role in defining the Kyoto Protocol. The forthcoming<br />
implementation of the emissions trading instrument will pave the way to greater use of<br />
renewable sources and to more rational use of energy. Photovoltaic technology, which converts<br />
the sun’s energy directly into electricity, will contribute to the reduction of emissions in the<br />
medium to long term, not only through cleaner projects in Europe, but also in developing<br />
countries through the transfer of technology.<br />
The sun provides more than 10,000 times the energy humanity consumes, meaning that there<br />
are few limits to the potential of photovoltaic technologies. For the last five years, the<br />
photovoltaic sector has experienced one of the highest growth rates worldwide (over 30% in<br />
2003) and for the 20 next years, the average production growth rate is estimated to be between<br />
27% and 34% annually. Currently the cost of electricity produced using photovoltaic technology<br />
is above that for traditional energy sources, but this will fall with technological progress and<br />
more efficient production processes.<br />
This EPIA / <strong>Greenpeace</strong> blueprint traces possible future developments in the photovoltaic sector<br />
over the coming decades, foreseeing significant benefits for the environment, but also for<br />
society: the photovoltaic sector might employ more than 2 million people by 2020.<br />
These developments will only occur if governments and the public at large welcome this<br />
technology. I am convinced this publication will promote this process and look forward to<br />
photovoltaic technology starting to play the role it deserves in establishing sustainable<br />
development for our benefit and that of future generations.<br />
Günter Verheugen<br />
European Commission Vice President,<br />
Commissioner for Enterprise and Industry<br />
3
FOREWORD<br />
This report demonstrates that there are no technical, economic or resource barriers to supplying<br />
1.1% of the world’s electricity needs from solar power alone by 2020; and this against the<br />
challenging backdrop of a projected near doubling of electricity demand by that date. Solar<br />
energy is a success story. It already supplies electricity to several hundred thousand people,<br />
provides employment for over 10,000 people and generates business worth more than<br />
¤ 3 billion annually<br />
In the future, the pace of change and progress could be even more rapid as the solar industry<br />
unlocks its hidden promise.<br />
By the end of 2003 more than 2,400 Megawatts (MW) of solar photovoltaic power had been<br />
installed world wide, generating enough electricity to power more than 700,000 households<br />
with an average European consumption. As outlined in the opening chapters, the success of the<br />
industry to date has been largely created by the efforts of just three countries - Japan, Germany<br />
and the USA. It is obvious that if other countries matched these efforts, the impact would be far<br />
greater. This underlines the fact that today’s technology is merely the tip of the iceberg, and a<br />
huge potential remains untapped. Solar power is capable of continuing its successful history<br />
over the next two decades if a positive political and regulatory framework is implemented, one<br />
that removes the obstacles and market distortions that currently constrain the industry’s real<br />
potential.<br />
The benefits of solar power are compelling: environmental protection, economic growth, job<br />
creation, secure and distributed generation, diversity of fuel supply and rapid deployment, as<br />
well as the global potential for technology transfer and innovation. The underlying advantage<br />
of solar energy is that the fuel is free, abundant and inexhaustible. The total amount of energy<br />
from the sun that reaches the earth’s surface every year is enough to provide for annual global<br />
energy consumption 10,000 times over. Yet these benefits remain largely untapped; most<br />
energy decisions taken today overlook solar power as a modular technology which can be<br />
rapidly deployed to generate electricity close to the point of consumption. Phasing in solar<br />
photovoltaics therefore requires a shift from centralised to decentralised power production,<br />
allowing far greater control to individual consumers.<br />
There is now a solid international consensus on the threat of dangerous climate change and<br />
that business-as-usual in the energy sector is not an option any more; the world must move<br />
into a clean energy economy. The rapidly increasing demand for fossil fuels has already in 2004<br />
propelled the price of crude oil above US$ 50 per barrel for the first time, and has demonstrated<br />
that production of “cheap” fossil fuels can no longer grow as fast as demand. Economies that<br />
have not prepared themselves for diversification of their energy mix will particularly be<br />
affected by these developments in world oil markets. Solar power is a prime choice in<br />
developing an affordable, feasible, global power source that is able to substitute for fossil fuels<br />
in all climate zones around the world.<br />
The European Photovoltaic Industry Association (EPIA) and <strong>Greenpeace</strong> have produced this new<br />
edition of Solar Generation in order to update our understanding of the contribution that solar<br />
power can make to the world’s energy supply. The report is a practical blueprint to show that<br />
4
solar power is capable of supplying electricity to more than 1 billion people within two decades,<br />
even if we nearly double our overall electricity use in that time.<br />
This clear industrial and political commitment to the expansion of the PV industry implies that<br />
the current surge of activity in the solar electricity sector represents merely a foretaste of the<br />
massive transformation and expansion that this sector will bear witness to in the coming<br />
decades.<br />
This joint initiative adopted the title “Solar Generation” because it aims to define the role that<br />
solar electricity will play in the lives of a global population born today as it develops into a<br />
major energy consumption group and starts to enter the job market. The aim has been to<br />
examine how solar electricity will be perceived from both a consumer and business point of<br />
view within the time scale of a generation. The report highlights the triple benefits which solar<br />
energy offers the world - for the environment, for industry and for economic and social<br />
development.<br />
The international conference “Renewables 2004” held in June 2004 in Bonn was a small but<br />
important step towards an expansion of renewable energies world wide, responding to the call<br />
of the Johannesburg summit to increase the share of renewable energy and to keep up the<br />
momentum generated by the Johannesburg Renewable Energy Coalition. The European Union<br />
has played an important role in this process, following the recommendation of a preparatory<br />
regional conference to Renewables 2004 held in Berlin in January 2004 to:<br />
“...urge EU institutions to start a political process of setting ambitious, time bound targets for<br />
increasing the share of renewable energy in final energy consumption addressing the medium<br />
(2020) and long term time frames in due time to the Renewables 2004 in Bonn. A target value of<br />
at least 20% of gross inland energy consumption by 2020 for the EU is achievable.”<br />
This number could be even higher if coupled with stronger energy efficiency policies. Targets<br />
for renewable energy act as a powerful catalyst for governments to develop the necessary<br />
framework conditions for investments in renewable energy technologies. A powerful example<br />
is the EU Directive on the Promotion of Electricity from Renewable Energy Sources, which sets<br />
national indicative targets for all EU Member States. The targets have initiated political actions<br />
throughout the entire European Union to put in place framework conditions for renewable<br />
energies. Targets are an important first step in developing the clean energy sources of tomorrow<br />
that will contribute substantially to climate protection, but they must be followed by concrete<br />
political action.<br />
Reports are a useful guide, but it is people who change the world by their actions. We encourage<br />
politicians and policymakers, global citizens, energy officials, companies, investors and other<br />
interested parties to support solar power by taking concrete steps which will help ensure that<br />
more than a billion people will get electricity from the sun, harnessing the full potential of<br />
solar power for our common good.<br />
October 2004<br />
EPIA<br />
<strong>Greenpeace</strong><br />
Michel Viaud<br />
Secretary-General<br />
European Photovoltaic Industry<br />
Association (EPIA)<br />
Sven Teske<br />
Renewables Director<br />
<strong>Greenpeace</strong> International<br />
5
EXECUTIVE SUMMARY<br />
GLOBAL STATUS OF <strong>SOLAR</strong> PHOTOVOLTAICS<br />
The solar electricity market is booming. In the year 2003 the<br />
cumulative installed capacity of solar photovoltaic (PV) systems<br />
around the world passed the landmark figure of 2,400 MWp.<br />
Global shipments of PV cells and modules have been growing at<br />
an average annual rate of more than 35% for the past few<br />
years.<br />
Such has been the growth in the solar electricity industry that it<br />
is now worth more than an annual ¤ 3 billion.<br />
Competition among the major manufacturers has become<br />
increasingly intense, with new players entering the market as<br />
the potential for PV opens up. The world wide photovoltaics<br />
industry, particularly in Europe and Japan, is investing heavily<br />
in new production facilities and technologies. At the same time,<br />
political support for the development of solar electricity has led<br />
to far-reaching promotion frameworks being put in place in a<br />
number of countries, notably Germany and Japan.<br />
Since the first edition of Solar Generation was produced in 2001,<br />
the global market has continued to expand at the rate then<br />
predicted. While some countries, such as the United States,<br />
have lagged behind their expected development, others such as<br />
Germany have exceeded expectations. There is also evidence of<br />
new enthusiasm for solar power in some of its most promising<br />
potential world markets, such as China.<br />
as wide an audience as possible the message that solar<br />
electricity will bring socio-economic, industrial and<br />
environmental benefits to regions which proactively encourage<br />
its uptake.<br />
<strong>SOLAR</strong> <strong>GENERATION</strong>:<br />
A PROJECTION TO 2020<br />
Numerous analyses about the potential market development of<br />
solar photovoltaics have been published in the past. The aim<br />
here has been to compile a detailed quantitative knowledge<br />
base, coupled with clearly defined and realistic assumptions<br />
from which extrapolations could be made on the likely<br />
development of the solar electricity market up to 2020 and<br />
beyond. The results which have emerged from this extensive<br />
analysis point to a technology that will make a major impact on<br />
the everyday adult lives of the population born today.<br />
Clearly, this transformation will not happen by itself. It will<br />
require the far reaching commitment of both consumers and<br />
industry, as well as significant political will. The level of<br />
commitment needed, however, has already been demonstrated<br />
in those countries which show the greatest growth in their<br />
solar electricity industries. We must learn from those lessons<br />
and adapt and deploy the corresponding catalysts on a global<br />
level if solar electricity is to play a major role in the lives of the<br />
next generation.<br />
<strong>SOLAR</strong> <strong>GENERATION</strong>:<br />
METHODOLOGY AND ASSUMPTIONS<br />
This clear commercial and political commitment to the<br />
expansion of the PV industry means that the current surge of<br />
activity in the solar electricity sector represents merely a<br />
foretaste of the massive transformation and expansion<br />
expected to occur over the coming decades. The target:<br />
realisation of a common goal of substantially increasing the<br />
penetration of solar electricity into the global energy mix while<br />
also cutting greenhouse gas emissions.<br />
Much work still needs to be done to turn potential into reality.<br />
One crucial step is to bring a far broader range of actors into the<br />
sector, particularly in the investment finance, marketing and<br />
retailing areas. At the same time, there is a need to transmit to<br />
Taking its lead from success stories like those in Japan and<br />
Germany, this EPIA/<strong>Greenpeace</strong> report looks forward to what<br />
solar power could achieve - given the right market conditions<br />
and an anticipated fall in costs - over the first two decades of<br />
the twenty first century. As well as projections for installed<br />
capacity and energy output it makes assessments of the level of<br />
investment required, the number of jobs which would be<br />
created and the crucial effect which an increased input from<br />
solar electricity will have on greenhouse gas emissions.<br />
This scenario for the year 2020, together with an extended<br />
projection forwards to 2040, is based on the following core<br />
inputs.<br />
6
• PV market development over recent years both globally and in<br />
specific regions<br />
• National and regional market support programmes<br />
• National targets for PV installations and manufacturing<br />
capacity<br />
• The potential for PV in terms of solar irradiation, the availability<br />
of suitable roof space and the demand for electricity in areas not<br />
connected to the grid<br />
The following assumptions have been employed:<br />
Market growth rates: The average annual growth rate of the<br />
worldwide PV market up to 2009 is projected to be 27%, then<br />
rising to 34% between 2010 and 2020. Although initial growth<br />
is expected to be fastest in the grid-connected sector, by 2010<br />
the off-grid sector will play a steadily increasing role.<br />
Electricity generation: Figures for the growth in global<br />
electricity demand up to 2020 (on which comparisons with<br />
expected PV development are based) are taken from projections<br />
by the International Energy Agency. These show total world<br />
power demand increasing to 25,578 Terawatt hours (TWh) by<br />
2020.<br />
Carbon dioxide savings: Over the whole scenario period it is<br />
estimated that an average of 0.6 kg of COc would be saved per<br />
kilowatt-hour of output from a solar generator.<br />
Projection to 2040: For the period 2020-2040 a moderate<br />
annual growth rate of 15% has been assumed, as well as a very<br />
conservative lifetime of 25 years for PV modules.<br />
The scenario is also divided in two ways - into the four main<br />
global market divisions (consumer applications, grid-connected,<br />
remote industrial and off-grid rural), and into the regions of the<br />
world as defined in projections of future electricity demand<br />
made by the International Energy Agency. These regions are<br />
OECD Europe, OECD Pacific, OECD North America, Latin America,<br />
East Asia, South Asia, China, the Middle East, Africa and the Rest<br />
of the World.<br />
These key results are:<br />
Global Solar Electricity Output in 2020: 282 TWh<br />
= 10% of EU-25 electricity demand in 2003<br />
= 1.1% of global electricity demand<br />
Global Solar Electricity Output in 2040: 7442 TWh<br />
= 21% of global electricity demand<br />
Detailed Projections for 2020:<br />
PV systems capacity<br />
Grid-connected consumers<br />
Off-grid consumers<br />
Employment potential<br />
Investment value<br />
Prices for grid connected<br />
PV systems<br />
Cumulative carbon savings<br />
205 GWp<br />
93 million world wideB<br />
31 million in Europe<br />
950 million world wideC<br />
2.25 million full-time jobs world wide<br />
¤ 62 billion per annum<br />
Reduction to ¤ 2 per Wp<br />
730 million tonnes of COc<br />
1 Calculation basis: 2.5 persons per household, with an annual consumption of 3,800 kWh<br />
2 Calculation basis: A 100 W solar system will cover the basic energy needs of 3-4 people<br />
<strong>SOLAR</strong> <strong>GENERATION</strong>:<br />
PV’S CONTRIBUTION TO GLOBAL ELECTRICITY SUPPLY<br />
The EPIA/<strong>Greenpeace</strong> scenario shows that by the year 2020, PV<br />
systems could be generating approximately 282 TWh of<br />
electricity around the world. This means that enough solar<br />
power would be produced globally in twenty years’ time to<br />
satisfy the electricity needs of 10% of the entire EU-25 (2003<br />
figure). Put another way, this would represent the annual<br />
output from 76 coal-fired power plants.<br />
Global installed capacity of solar power systems would reach<br />
205 GWp by 2020. About half of this would be in the gridconnected<br />
market, mainly in industrialised countries.<br />
Assuming that 80% of these systems are installed on residential<br />
buildings, and their average size is 3 kWp, the total number of<br />
people by then generating their own electricity from a gridconnected<br />
solar system would reach 93 million. In Europe alone<br />
there would be roughly 31 million people receiving their supply<br />
from solar electricity generation.<br />
Although the key markets are located now mainly in the<br />
industrialised world, a global shift will result in a significant<br />
share - 30 GWp - being taken by the developing world in 2020.<br />
<strong>SOLAR</strong> <strong>GENERATION</strong>:<br />
KEY RESULTS OF THE EPIA/GREENPEACE ANALYSIS<br />
The key results of the EPIA/<strong>Greenpeace</strong> scenario clearly show<br />
that, even from a relatively low baseline, solar electricity has<br />
the potential to make a major contribution to both future<br />
global electricity supply and the mitigation of climate change.<br />
7
EXECUTIVE SUMMARY<br />
achieving greater penetration of solar electricity into the<br />
energy mix at local, national, regional and global levels.<br />
A number of key political actions are required:<br />
Since system sizes are much smaller and the population density<br />
greater, this means that up to a billion people in developing<br />
countries would by then be using solar electricity. This would<br />
represent a major breakthrough for the technology from its<br />
present emerging status.<br />
By 2040, the penetration of solar generation would be even<br />
greater. Assuming that overall global power consumption had<br />
by then increased from 25,578 to 36,000 TWh, the solar<br />
contribution would equal 21% of the world’s electricity output.<br />
This would place solar power firmly on the map as an<br />
established energy source.<br />
<strong>SOLAR</strong> <strong>GENERATION</strong>:<br />
PV’S CONTRIBUTION TO INDUSTRY, EMPLOYMENT<br />
AND THE ENVIRONMENT<br />
• Firstly, an annual world PV market growth of 3.7 GWp+ by 2010<br />
will only be achieved through the extension of best practice<br />
support schemes, appropriately adapted to local circumstances,<br />
to encourage the uptake of solar electricity amongst consumers.<br />
The German and Japanese experiences highlight the impact<br />
which such actions can have on the global photovoltaics<br />
industry.<br />
• Secondly, the inherent barriers to the take-up of solar power -<br />
and the subsidies available to fossil and nuclear fuels which<br />
currently penalise renewable sources - must be removed.<br />
• Thirdly, a variety of legally enforced mechanisms must be<br />
implemented which secure and accelerate the new market for<br />
solar photovoltaics. Particularly in industrialised and emerging<br />
economies, the introduction or expansion of premium feed-in<br />
tariffs with guaranteed lifetimes must be a cornerstone of all<br />
future promotion mechanisms for solar electricity.<br />
Our goal now must be to mobilise the necessary industrial,<br />
political and end-user commitment to this technology and,<br />
more importantly, the service it provides. We must redouble our<br />
efforts to ensure that the generation born today benefits from<br />
all the socio-economic and environmental benefits that solar<br />
electricity offers.<br />
For the solar production industry, global annual shipments of<br />
PV modules will rise from 750 MWp in 2003 to more than<br />
48,000 MWp in 2020. This represents an increase by a factor of<br />
64.<br />
For the job seekers of the 2020 generation, this would represent<br />
a major contribution towards their employment prospects. On<br />
the assumption that more jobs are created in the installation<br />
and servicing of PV systems than in their manufacture, the<br />
result is that by 2020, more than 2.25 million full time jobs<br />
would have been created by the development of solar power<br />
around the world. The majority of those would be in installation<br />
and marketing.<br />
By 2020 solar PV would also have had one other important<br />
effect. In environmental terms, it would have reduced annual<br />
COc emissions by 169 million tonnes. This reduction is<br />
equivalent to the emissions from all 45 million cars currently<br />
operating in Germany, or 76 coal-fired power plants. Cumulative<br />
COc savings from solar electricity generation between 2003 and<br />
2020 will have reached a level of more than 730 million tonnes.<br />
POLICY RECOMMENDATIONS<br />
In order to supply up to a billion people with solar electricity by<br />
the year 2020, and go on to achieve a global electricity share of<br />
21% by 2040, a major shift in energy policy will be needed.<br />
Experience over the past few years has demonstrated the<br />
effectiveness of joint industrial and political commitment to<br />
8
PART ONE<br />
<strong>SOLAR</strong> BASICS
PART ONE: <strong>SOLAR</strong> BASICS<br />
THE <strong>SOLAR</strong> POTENTIAL<br />
There is more than sufficient solar radiation available around<br />
the world to satisfy a vastly increased demand for solar power<br />
systems. The proportion of the sun’s rays which reaches the<br />
earth’s surface is enough to provide for global energy<br />
consumption 10,000 times over. On average, each square metre<br />
of land is exposed to enough sunlight to produce 1,700 kWh of<br />
power every year.<br />
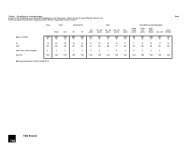
Figure 1.1: Global variations in irradiation<br />
2500<br />
50<br />
0<br />
-50<br />
-150 -100 -50 0 50 100 150<br />
Source: Gregor Czisch, ISET, Kassel, Germany<br />
The statistical information base for the solar energy resource is<br />
equally solid. The US National Solar Radiation database, for<br />
example, has logged 30 years of solar radiation and<br />
supplementary meteorological data from 237 sites in the USA.<br />
The greater the available solar resource at a given location the<br />
larger the quantity of electricity generated. Tropical regions<br />
offer a better resource than more temperate latitudes. The<br />
average irradiation in Europe is about 1,000 kWh per square<br />
metre, for example, compared with 1,800 kWh in the Middle<br />
East.<br />
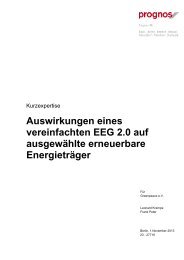
Figure 1.2 shows the estimated potential energy output from<br />
solar PV generators in different parts of the world. The<br />
calculation used here takes into account the average efficiency<br />
of modules and converters as well as the correct angle to the<br />
sun required at different latitudes.<br />
In terms of final demand, the report “Solar Electricity in 2010”<br />
(European Photovoltaic Industry Association, 2001) shows that<br />
the market segment grid-connected PV rooftop systems, the<br />
most dynamic growth area in the market, has the potential to<br />
generate an average of 16% of electricity consumption across<br />
the OECD (industrialised) countries. This is about the same as<br />
today’s contribution from hydro power.<br />
[kWh / (m 2 )]<br />
Figure 1.2: Energy potential from PV around the world<br />
50<br />
0<br />
2000<br />
1500<br />
1000<br />
300<br />
250<br />
200<br />
-50 150<br />
-150 -100 -50 0 50 100 150<br />
Source: Gregor Czisch, ISET, Kassel, Germany<br />
[kWh / (m 2 )]<br />
100<br />
WHAT IS PHOTOVOLTAIC ENERGY?<br />
The word “photovoltaic” is a marriage of two words - “photo”,<br />
meaning light, and “voltaic”, meaning electricity. So<br />
photovoltaic technology, the scientific term used to describe<br />
solar energy, involves the generation of electricity from light.<br />
The secret to this process is the use of a semi-conductor material<br />
which can be adapted to release electrons, the negatively<br />
charged particles which form the basis of electricity. The most<br />
common semi-conductor material used in photovoltaic (PV)<br />
cells is silicon, an element most commonly found in sand.<br />
All PV cells have at least two layers of such semi-conductors,<br />
one positively charged and one negatively charged. When light<br />
shines on the semi-conductor, the electric field across the<br />
junction between these two layers causes electricity to flow,<br />
generating DC current. The greater the intensity of the light, the<br />
greater the flow of electricity.<br />
A photovoltaic system does not therefore need bright sunlight<br />
in order to operate. It also generates electricity on cloudy days,<br />
with its energy output proportionate to the density of the<br />
clouds. Due to the reflection of sunlight, days with only a few<br />
clouds can even result in higher energy yields than days with a<br />
completely blue sky.<br />
Solar PV is quite different from a solar thermal system, where<br />
the sun’s rays are used to generate heat, usually for hot water in<br />
a house, swimming pool etc.<br />
The Advantages of Solar Power<br />
• The fuel is free<br />
• No moving parts to wear out or break down<br />
• Minimal maintenance required to keep the system running<br />
• Modular systems can be quickly installed anywhere<br />
• Produces no noise, harmful emissions or polluting gases<br />
PV Technology<br />
The most important parts of a PV system are the cells which<br />
form the basic building blocks, the modules which bring<br />
together large numbers of cells into a unit, and, in some<br />
situations, the inverters used to convert the electricity<br />
generated into a form suitable for everyday use.<br />
10
PV Cells and Modules<br />
PV cells are generally made either from crystalline silicon,<br />
sliced from ingots or castings or from grown ribbons, or thin<br />
film, deposited in thin layers on a low cost backing. The<br />
majority of module production (89% in 2003) has so far involved<br />
the former, while future plans will also have a strong focus on<br />
the latter. Thin film technology based on silicon and other<br />
materials is expected to gain a by far larger share of the PV<br />
market in the future. This technology offers several advantages<br />
such as low material consumption, low weight and a smooth<br />
visual appearance.<br />
Crystalline silicon<br />
Crystalline silicon is still the mainstay of most power modules.<br />
Although in some technical parameters not the ideal material<br />
for solar cells, it has the benefit of being widely available, well<br />
understood and uses the same technology developed for the<br />
electronics industry. Efficiencies of more than 20% have been<br />
obtained with silicon cells in the laboratory, but production<br />
cells are currently averaging 13-17% efficiency. The theoretical<br />
limit for crystalline modules approaches 30%.<br />
Thin film<br />
Thin film modules are constructed by depositing extremely<br />
thin layers of photosensitive materials on a low cost backing<br />
such as glass, stainless steel or plastic. This results in lower<br />
production costs compared to the more material intensive<br />
crystalline technology. This price advantage is counter balanced<br />
at the moment, however, by substantially lower efficiency rates<br />
and less experience of the modules’ lifetime performance.<br />
Three types of thin film modules are commercially available at<br />
the moment. These are manufactured from amorphous silicon<br />
(a-Si), copper indium diselenide (CIS, CIGS) and cadmium<br />
telluride (CdTe). All of these have active layers in the thickness<br />
range of less than a few microns. This approach allows higher<br />
automation once a certain production volume is reached, while<br />
they all use an integrated approach to the module architecture.<br />
This is less labour intensive compared to the assembly of<br />
crystalline modules by interconnecting a number of individual<br />
cells. At approximately 6% in 2003, the market share of thin<br />
film technology is still fairly low, but can be expected to<br />
increase in the future.<br />
Figure 1.3: Market shares of different cell technologies<br />
sold in 2003 (installed capacity)<br />
mono c-Si<br />
33,2%<br />
ribbon-/sheet<br />
c-Si 4,3%<br />
CIS 0,7%<br />
a-Si 4,5%<br />
CdTe 1%<br />
poly c-Si 56,3%<br />
Amongst these three commercially available thin film<br />
technologies, a-Si is the most important in terms of production<br />
and installation (4.5% of the total market in 2003).<br />
Multicrystalline thin film on glass (CSG) is a promising thin<br />
film technology under development, but not yet available on a<br />
commercial scale. Microcrystalline technology, in particular<br />
the combination of amorphous silicon and microcrystalline<br />
silicon (a-Si/µ-Si) is another approach with encouraging results.<br />
The efficiency world record for cells with this technology is<br />
currently 14.7%, while modules are already commercially<br />
available with an efficiency of 10% stabilized. The aim is to<br />
increase this level to 12% in 2005.<br />
Other cell types<br />
Concentrator cells focus light from a large area onto a small<br />
area of photovoltaic material using an optical concentrator<br />
(such as a Fresnel lens), thus minimising the quantity of PV<br />
cells required. The two main drawbacks with concentrator<br />
systems are that they cannot make use of diffuse sunlight and<br />
must always be directed towards the sun with a tracking<br />
system.<br />
Spheral solar technology uses minute silicon beads bonded to<br />
an aluminium foil matrix. This offers a big cost advantage<br />
because of the reduced requirement for silicon. Two companies,<br />
from Canada and Japan, are planning to commercialise<br />
modules with spheral solar cells, with one of them already<br />
predicting a module efficiency of 11%. This represents an<br />
excellent example of the rapid technical progress in<br />
photovoltaics. When the first edition of Solar Generation was<br />
published in 2001, the development of spheral cells was not<br />
even at a stage that allowed a detailed prediction of its<br />
commercial availability.<br />
Modules<br />
Modules are clusters of PV cells incorporated into a unit, usually<br />
by soldering them together under a sheet of glass. They can be<br />
adapted in size to the proposed site, and quickly installed. They<br />
11
PART ONE: <strong>SOLAR</strong> BASICS<br />
are also robust, reliable and weatherproof. Module producers<br />
usually guarantee their performance for 20-25 years.<br />
When a PV installation is described as having a capacity of 3<br />
kWp(eak), this refers to the output of the system under standard<br />
testing conditions (STC), allowing comparison between<br />
different modules. In central Europe a 3 kWp rated solar<br />
electricity system, with a module area of approximately 27<br />
square metres, would produce enough power to meet the<br />
electricity demand of an energy conscious household.<br />
Table 1.1: Module efficiencies<br />
Type Typical module efficiency (%)<br />
Monocrystalline silicon [mono c-Si] 12-15<br />
Multicrystalline silicon [multi c-Si] 11-14<br />
Amorphous silicon [a-Si] 5-7<br />
Cadmium telluride [CdTe] 6-7.5<br />
CIS 9-9.5<br />
a-Si/µ-Si 10<br />
Source: International Energy Agency (IEA) Photovoltaic Power Systems Programme<br />
Inverters<br />
Inverters are used to convert the direct current (DC) power<br />
generated by a PV generator into alternating current (AC)<br />
which is compatible with the local electricity distribution<br />
network. This is essential for grid-connected PV systems.<br />
Inverters are offered in a wide range of power classes, from a<br />
few hundred Watts through the most frequently used range of<br />
several kWp (3-6 kWp) up to central inverters for large scale<br />
systems with 100 kWp and above.<br />
Components for Stand-alone PV Systems<br />
Stand-alone (off-grid) PV systems contain a battery, still today<br />
frequently of the lead acid type, in order to store the energy for<br />
future use. New high quality batteries designed especially for<br />
solar applications, with life times of up to 15 years, are now<br />
available. However the lifetime of the battery strongly depends<br />
on the battery management and the user behaviour. The<br />
battery is connected to the PV array via a charge controller. The<br />
charge controller protects the battery from over charge or<br />
discharge, and can also provide information about the state of<br />
the system or enable metering and pre-payment for the<br />
electricity used. If AC output is needed, an inverter is required<br />
to convert the DC power from the array.<br />
In countries with a premium feed-in tariff, which is<br />
considerably higher that the usual tariff paid by the customer<br />
to the utility, usually all electricity produced is fed into the<br />
public grid and sold to the utility. This is the situation in<br />
countries such as Germany or Spain.<br />
Grid Support<br />
A system can be connected to the local electricity network as<br />
well as a back-up battery. Any excess solar electricity produced<br />
after the battery has been charged is then sold to the network.<br />
Ideal for use in areas of unreliable power supply.<br />
Off-Grid<br />
Completely independent of the grid, the system is connected to<br />
a battery via a charge controller, which stores the electricity<br />
generated and acts as the main power supply. An inverter can<br />
be used to provide AC power, enabling the use of normal<br />
appliances without mains power. Typical off-grid applications<br />
are industrial applications such as repeater stations for mobile<br />
phones or rural electrification. Rural electrification means<br />
either small solar home systems (SHS) covering basic electricity<br />
needs or solar mini grids, which are larger solar electricity<br />
systems providing electricity for several households.<br />
Hybrid System<br />
A solar system can be combined with another source of power<br />
- a biomass generator, a wind turbine or diesel generator - to<br />
ensure a consistent supply of electricity. A hybrid system can be<br />
grid connected, stand alone or grid support.<br />
THE BENEFITS OF <strong>SOLAR</strong> POWER<br />
Photovoltaic power systems offer many unique benefits above<br />
and beyond simple energy delivery. That is why comparisons<br />
with conventional electricity generation - and more particularly<br />
comparison with the unit energy costs of conventional<br />
generation - are not always valid. If the amenity value of the<br />
energy service that PV provides, or other non-energy benefits,<br />
could be appropriately costed, it is clear that the overall<br />
economics of PV generation would be dramatically improved in<br />
numerous applications, even in some grid-connection<br />
situations.<br />
TYPES OF PV SYSTEM<br />
Grid Connected<br />
The most popular type of solar PV system for homes and<br />
businesses in the developed world. Connection to the local<br />
electricity network allows any excess power produced to be sold<br />
to the utility. Electricity is then imported from the network<br />
outside daylight hours. An inverter is used to convert the DC<br />
power produced by the system to AC power for running normal<br />
electrical equipment.<br />
12
Climate Change and Fuel Choices<br />
Carbon dioxide is responsible for more than 50% of the man-made<br />
greenhouse effect, making it the most important contributor to<br />
climate change. It is produced mainly by the burning of fossil fuels.<br />
Natural gas is the most environmentally sound of the fossil fuels<br />
because it produces roughly half the quantity of carbon dioxide<br />
and less of other polluting gases than coal. Nuclear power<br />
produces very little COc, but has other major safety, security,<br />
proliferation and pollution problems associated with its operation<br />
and waste products.<br />
The consequences of climate change already apparent today<br />
include:<br />
• The proportion of COc in the atmosphere has risen by about<br />
one third since industrialisation began.<br />
• The number of natural disasters has trebled since the 1960s.<br />
According to insurance company Munich Re the resulting<br />
economic damage has increased by a factor of nine.<br />
• The eight warmest years over the last 130 were recorded during<br />
the past 11.<br />
• The mass of inland glaciers has been halved since<br />
industrialisation began.<br />
• Rainfall in temperate and northern latitudes has increased by<br />
5% since 1950.<br />
• According to a UN study, the economic damage of climate<br />
change will reach an annual figure of $ 300 billion by 2050.<br />
• Sea levels have risen by 10-20 centimetres in the last 100 years,<br />
9-12 cm of this in the last fifty.<br />
• According to a WHO study, as many as 160,000 people are<br />
already dying each year as a result of climate change.<br />
• According to a study published in Nature (January 2004), a<br />
mid-range level of warming could result in the extinction of<br />
1,000,000 terrestrial species by the middle of this century.<br />
Because of the time lapse between emissions and their effects, the<br />
full consequences of the climate change to which we have already<br />
committed the planet have still to emerge over the coming<br />
decades, bringing increased danger to the stability of the world’s<br />
economy and lifestyle. To effectively stem the greenhouse effect,<br />
emissions of COc must therefore be greatly reduced. Scientists<br />
believe that only a quarter of the fossil energy reserves which can<br />
be developed commercially today ought to be allowed to be<br />
burned if ecosystems are not to go beyond the point at which they<br />
are able to adapt.<br />
Space-saving installation<br />
PV is a simple, low risk technology which can be installed<br />
virtually anywhere there is available light. This means there is<br />
a huge potential for the use of roofs or facades on public, private<br />
and industrial buildings. PV modules can be used as part of a<br />
building’s envelope, providing protection from wind and rain<br />
or serving to shade the interior. During their operation such<br />
systems can also help reduce buildings’ heating loads or assist<br />
in ventilation through convection.<br />
Other places where PV can be installed include the sound barriers<br />
along communication links such as motorways. To satisfy<br />
a significant part of the electricity needs of the industrialised<br />
world there is therefore no need to exploit otherwise undisturbed<br />
areas.<br />
Improving the electricity network<br />
For power companies and their customers, PV has the advantage<br />
of providing relatively quick and modular deployment. This can<br />
offset investment in major new plant and help to strengthen<br />
the electricity network, particularly at the end of the<br />
distribution line. Since power is generated close to the point of<br />
use, such distributed generators reduce transmission losses,<br />
can improve service reliability for customers and help limit<br />
maximum demand.<br />
Protecting the environment<br />
Solar power involves none of the polluting emissions or<br />
environmental safety concerns associated with conventional<br />
generation technologies. There is no pollution in the form of<br />
exhaust fumes or noise during operation. Decommissioning a<br />
system is unproblematic.<br />
Most importantly, in terms of the wider environment, there are<br />
no emissions of carbon dioxide - the main gas responsible for<br />
global climate change (see paragraph “Climate Change and<br />
Fuel Choices”) - during the operation of a PV system. Although<br />
indirect emissions of COc occur at other stages of the life-cycle,<br />
these are significantly lower than the avoided emissions. Solar<br />
power can therefore make a substantial contribution towards<br />
international commitments to reduce emissions of greenhouse<br />
gases and their contribution to climate change (see paragraph<br />
“The Climate Change Imperative”).<br />
Enabling economic development<br />
PV offers important social benefits in terms of job creation,<br />
energy independence and rural development. Significantly,<br />
much of the employment creation is at the installation point<br />
(installers and service engineers), giving a boost to local<br />
economies.<br />
13
PART ONE: <strong>SOLAR</strong> BASICS<br />
The Climate Change Imperative<br />
The growing threat of global climate change resulting from the<br />
build-up of greenhouse gases in the earth’s atmosphere has forced<br />
national and international bodies into action. Starting from the<br />
Rio Earth Summit in 1992 a series of targets have been set both for<br />
reducing greenhouse gas emissions and increasing the take-up of<br />
renewable energy, including solar power. Ten years later, however,<br />
the World Summit for Sustainable Development in Johannesburg<br />
still failed to agree on legally binding targets for renewables,<br />
prompting the setting up of a “coalition of the willing”. The<br />
European Union and more than a dozen nations from around the<br />
world expressed their disappointment with the Summit’s inaction<br />
by issuing a joint statement called “The Way Forward on<br />
Renewable Energy”. Later renamed the Johannesburg Renewable<br />
Energy Coalition, more than 85 countries had joined by the time of<br />
the Renewables 2004 conference in Bonn.<br />
The 1997 Kyoto Protocol, now ratified by 124 nations, has<br />
meanwhile committed the world’s industrialised countries to<br />
reducing their emissions of greenhouse gases by an average of 5%<br />
from their 1990 level. Kyoto will not come into force unless it is<br />
ratified by countries responsible for 55% of industrialised nations’<br />
greenhouse gas emissions. In June 2004 the proportion had<br />
reached 44%, with Russia’s 17% waiting to tip the balance. In<br />
October 2004, however, the Russian government announced it<br />
would ratify the Kyoto Protocol, bringing it into force in early<br />
2005.<br />
Other climate change prompted<br />
commitments include:<br />
The European Union has set a target to double the proportion of<br />
energy in the 15 member states (before the latest enlargement)<br />
provided from renewable sources. The aim is for 12% renewable<br />
energy by 2010. This includes a specific target to achieve 3 GWp of<br />
PV capacity. The EU also has a target for 1 million solar roofs as<br />
part of its renewable energy “Campaign for Take-Off”. Other<br />
countries around the world have similar targets for large numbers<br />
of grid-integrated PV systems (see Part Three: The Solar Race).<br />
Solar power can be easily installed in remote and rural areas,<br />
places which may not be targeted for grid connection for many<br />
years. Installation of transmission and distribution lines are<br />
avoided and remote communities can reduce reliance on<br />
energy imports.<br />
Energy payback<br />
A popular belief still persists that PV systems cannot ‘pay back’<br />
their energy investment within the expected lifetime of a solar<br />
generator - about 25 years. This is because the energy used,<br />
especially during the production of solar cells, is seen to far<br />
outweigh the electricity eventually generated.<br />
Data from recent studies shows, however, that present-day<br />
systems already have an energy payback time (EPBT) - the time<br />
taken for power generation to compensate for the energy used<br />
in production - of 3 to 4 years, well below their expected<br />
lifetime. With increased cell efficiency and a decrease in cell<br />
thickness, as well as optimised production procedures, it is<br />
feasible that the EPBT for grid-connected PV will decrease to<br />
two years or less for crystalline silicon modules and to one year<br />
or less for thin film modules.<br />
14
PART TWO<br />
THE <strong>SOLAR</strong> POWER MARKET
PART TWO: THE <strong>SOLAR</strong> POWER MARKET<br />
Solar power is booming. By the end of 2003 the cumulative<br />
installed capacity of all PV systems around the world had<br />
reached the landmark figure of 2,400 MWp. This compares with<br />
a figure of 1,200 MWp at the end of 2000, reflecting a doubling<br />
of the total installed capacity in just three years. Shipments of<br />
PV cells and modules around the world have been growing at<br />
an average annual rate of more than 35% since 1998.<br />
Such has been the growth in the solar industry that sales are<br />
now worth an annual ¤ 3 billion. Competition among the major<br />
manufacturers has become increasingly intense, with new<br />
players entering the market as the potential for PV opens up.<br />
Although the expansion in recent years has been primarily in<br />
the grid-connected sector, the international PV demand side<br />
market divides up into four clear sectors. These market<br />
categories are used throughout this report.<br />
DEMAND SIDE MARKET SECTORS<br />
Consumer goods and services<br />
Applications<br />
Solar cells or modules are used in a wide range of consumer<br />
products and small electrical appliances, including watches,<br />
calculators and toys, and to provide power for services such as<br />
water sprinklers, road signs, lighting and phone boxes.<br />
Typical of a new development is the use of PV to control air<br />
conditioning in cars. A small system integrated in the roof<br />
keeps the temperature inside at a constant level by operating a<br />
ventilator when the car is parked, especially in the sun during<br />
summertime. This results in lower peak temperatures inside<br />
the car and a much cheaper air conditioning system due to a<br />
lower requirement for power. Manufacturers may also be able<br />
to save on the cost of expensive heat resistant materials in the<br />
vehicle’s interior.<br />
Market development<br />
In the year 2003 this sector accounted for roughly 35 MWp,<br />
about 5% of global annual production. As demand for a mobile<br />
electricity supply increases, it is likely to continue to grow,<br />
especially with the attraction of innovative low cost solar<br />
electricity technologies such as organic solar cells. In 2004<br />
Siemens announced the development of an organic solar cell<br />
with 5% efficiency.<br />
Grid-connected systems<br />
Applications<br />
PV can be installed on top of a roof or integrated into the roofs<br />
and facades of houses, offices and public buildings. Private<br />
houses are a major growth area for roof systems as well as for<br />
BIPV (Building Integrated PV), with the average capacity of<br />
domestic systems in Germany now above 5 kWp. For<br />
comparison, a 3 kWp solar electricity system in southern<br />
Germany delivers more than 2,700 kWh/year, sufficient to<br />
supply up to 100% of the electricity needs of an energy<br />
conscious household.<br />
PV is also used increasingly as a design feature by architects,<br />
replacing elements in a building’s envelope. Solar roof tiles or<br />
slates can replace conventional materials, for instance. Flexible<br />
thin film modules can even be integrated into vaulted roofs,<br />
while semi-transparent modules allow for an interesting<br />
mixture of shading and daylight. PV can also be used to supply<br />
peak power to the building on hot summer days when air<br />
conditioning systems need most energy, thus helping to reduce<br />
the maximum electricity load.<br />
If a solar electricity system is recognised as an integral part of a<br />
building, then the money spent on decorative materials for<br />
facades, such as marble, can instead be invested in solar<br />
modules. Solar power doubles up as both an energy producer<br />
and a building material. For prominent businesses it can<br />
provide the public face of their environmental commitment.<br />
Distributed generation using solar facades or roofs can also<br />
provide benefits to a power utility by avoiding grid replacement<br />
or strengthening and potentially reducing maximum demand<br />
for conventional electricity, especially in countries with a high<br />
cooling load.<br />
Large scale grid-connected PV arrays have not so far become a<br />
major part of the market, mainly because of the difficulty in<br />
finding enough space in built-up areas. In Europe, however, it<br />
was estimated in 1998 that the potential for integrating PV into<br />
noise barriers then planned for construction alongside<br />
motorways and railways was as high as 1,100 MWp. Sundrenched<br />
desert regions present good opportunities in the<br />
longer term, especially as module prices continue to fall, for<br />
instance in the south west United States, Africa and Mongolia.<br />
In Germany, large scale ground based systems in the megawatt<br />
class have become a new market in recent years. This offers a<br />
new source of income for farmers, who can rent their land to<br />
investors in large PV systems and with the advantage of a<br />
secure revenue for at least 20 years.<br />
Market development<br />
This sector is the current motor of the PV boom, with most<br />
development taking place in the OECD countries. More and<br />
more national governments see PV as an important technology<br />
for the future and have already established, or are in the process<br />
of establishing, support programmes. While in 1994 only 20% of<br />
new capacity was grid-connected, this had grown to over 70%<br />
by 2003.<br />
Examples of market stimulation programmes include Japan’s<br />
70,000 rooftop proposal, the 100,000 roofs initiative in<br />
Germany, the current Renewable Energy Law in Germany, and<br />
the million solar roofs programme in the United States, which<br />
includes both PV and solar thermal applications. These support<br />
programmes will continue to provide an impetus for market<br />
growth for some years to come, and are likely to be followed by<br />
similar initiatives in other countries (see Part Three: The Solar<br />
Race).<br />
16
The other side of the grid-connected domestic market is the<br />
control which PV systems allow the consumer over their power<br />
supply. Not only is electricity generated at the point of demand<br />
but the consumer is effectively transformed into the operator of<br />
his or her own power station. As international power markets<br />
steadily liberalise this is likely to have increasingly important<br />
market implications.<br />
Off-grid electrification<br />
Applications<br />
PV provides vital power for communities in the developing<br />
world who have no access to mains electricity. About 1.7 billion<br />
people around the world currently live without basic energy<br />
services.<br />
Among the uses made of solar electricity in off grid situations<br />
are for domestic lighting, solar lanterns, TV sets, water<br />
pumping, refrigerators and providing lighting for shops, health<br />
centres or small market places.<br />
PV has the potential to deliver much more than just electricity<br />
for lighting or improved health care, however. By providing the<br />
power supply for computers, for example, it can enable people<br />
not just to have access to information through the internet, but<br />
to improve their economic situation through better marketing<br />
of products or buying goods at more reasonable prices.<br />
Market development<br />
Apart from its clear social advantages, the economic<br />
justification for using PV is through the avoided fuel costs,<br />
usually expensive diesel, or by comparison with the cost of<br />
extending the grid. For subsistence level communities the<br />
initial stumbling block is often the capital cost of the system.<br />
But although numerous rural development programmes have<br />
been initiated in developing countries, supported both by multi<br />
and bilateral assistance programmes, the impact has so far<br />
been relatively small.<br />
There is also a major need to provide clean drinking water in<br />
the developing world. The World Health Organisation estimates<br />
that 10,000 children die each day from water-borne diseases.<br />
Solar-powered water purification systems and pumps are<br />
easily transportable, easy to maintain and simple to use and, as<br />
part of rural health initiatives, could be an important tool in the<br />
fight against disease.<br />
Off-grid industrial<br />
Applications<br />
Industrial uses for off grid solar power are mainly in the<br />
telecommunications field, especially to link remote rural areas<br />
to the rest of the country. In India, for example, more than a<br />
third of the PV capacity is devoted to the telecommunications<br />
sector. Repeater stations for mobile phones powered by PV or<br />
hybrid systems (PV/diesel) also have a large potential.<br />
Other applications include traffic signals, marine navigation<br />
aids, security phones, weather or pollution monitors, remote<br />
lighting, highway signs and waste water treatment plants.<br />
Market development<br />
Apart from avoided fuel costs, for example by totally or partly<br />
replacing a diesel engine, industrial PV systems offer high<br />
reliability and minimal maintenance. This can dramatically<br />
reduce operation and maintenance costs, particularly in very<br />
remote or inaccessible locations.<br />
The demand for off-grid industrial PV systems is expected to<br />
continue to expand over the next decade and beyond, especially<br />
in response to the continued growth of the telecommunications<br />
industry. Mobile telephone masts and repeater stations offer a<br />
particularly large potential, especially in countries with low<br />
population densities. Providing communications services to<br />
rural areas in developing countries as part of social and<br />
economic development packages will also be a major future<br />
market opportunity for photovoltaics.<br />
PV Around the World<br />
• A 1.1 MWp solar electricity system was installed on the roofs of<br />
the new trade fair building in Munich, Germany in 2002.<br />
Together with an existing 1 MWp system this now represents<br />
the largest roof mounted solar electricity system in the world,<br />
providing electricity for more than 700 households.<br />
• Senegal’s countryside is being transformed by projects run by<br />
the Senegalese Agency for Rural Electrification, a government<br />
department formed in 2001. With workers busily putting up<br />
solar panels and poles to connect them to the grid, the project<br />
aims to raise the percentage of Senegal’s 324 rural counties<br />
with electricity from nine to 15% by 2005, and to at least 60%<br />
within 20 years.<br />
• If the home team isn’t winning at the new Stade de Suisse in<br />
Berne, Switzerland there will at least be a tour of the<br />
stadium’s PV system to take the fans’ minds off the game. On<br />
the roof, BKW FMB Energy is building a 1.3 MW solar plant and<br />
energy platform to power the building and its surrounding<br />
complex.<br />
• A solar pergola with a capacity of 444 kWp was installed in<br />
Barcelona, Spain to mark the 2004 World Forum of Cultures.<br />
This unique landmark shows the added value which solar<br />
electricity technology can contribute to an urban<br />
environment.<br />
• A 400 kWp ground based systems using thin film modules<br />
was connected to the grid in Waltenhofen near Munich,<br />
Germany in December 2003. A landmark in innovation for the<br />
solar electricity market, only 6 months later a 1 MWp ground<br />
based system with the same technology was installed in<br />
Buttenwiesen, southern Germany, demonstrating the rapid<br />
development in this market segment.<br />
• A 5 MW PV array with 33,500 modules was opened in<br />
September 2004 on a former dump site for lignite coal ash in<br />
Espenhain, Germany. The output will be fed into the grid to<br />
serve 1,800 homes, and will displace the emission of 3,700<br />
tonnes of COc each year<br />
17
PART TWO: THE <strong>SOLAR</strong> POWER MARKET<br />
SUPPLY SIDE MANUFACTURE<br />
Solar Cell and Module Production<br />
The manufacture of solar cells and modules is presently<br />
concentrated in three key areas - Europe, Japan and the United<br />
States. Japan leads the world, with solar cell shipments reaching<br />
more than 365 MWp in 2003, a 48% increase over the previous<br />
year. This corresponds to 48% of total world production. Europe<br />
came second in 2003 with 202 MWp, a 43% increase over the<br />
previous year, and corresponding to 27% of world production.<br />
Production in the United States reached only 109 MW, however,<br />
a decrease of 6%, with the global share of US production falling<br />
dramatically from 21% in 2002 to 14% in 2003.<br />
The rest of the world, with its key players in Australia and India,<br />
produced 85 MWp in 2003. Of particular interest is how<br />
production capacity in China will develop over the next few<br />
years. The Chinese company Suntech announced an expected<br />
cell production capacity of 75 MWp by the end of 2004 and<br />
further expansion to 150 MWp in 2005. Overall, the growth of<br />
global PV shipments since 1995 can be seen in Table 2.2.<br />
The leading manufacturers of solar cells can be seen in Table 2.1.<br />
Although until a few years ago the market was dominated by<br />
BP Solar, a subsidiary of the multinational oil company, this<br />
situation has radically changed with the entry of new Japanese<br />
and European players. In 2003, the two leading producers of PV<br />
cells/modules were Sharp and Kyocera, both Japanese<br />
companies. Sharp further strengthened its position as leading<br />
cell producer with an increase in production to 197 MWp, which<br />
corresponds to roughly 25% of world production. A breakdown<br />
of the main companies’ involvement in regional and country<br />
markets can be seen in Table 2.1. The latest world market survey<br />
by trade magazine Photon International (April 2004) records<br />
298 types of modules being produced by 78 different<br />
manufacturers in more than a dozen different countries.<br />
Europe has seen an expansion in production from traditional<br />
cell producers such as RWE Schott Solar, which increased its cell<br />
production from 29.5 MWp in 2002 to 44 MWp in 2003, and<br />
Isofoton, which increased from 27 MWp in 2002 to 35.2 MWp in<br />
2003. New players in the market are also showing impressive<br />
growth rates. The German company Q-Cells, for example,<br />
expanded its production from 9 MWp (2002) to 28.2 MWp<br />
(2003), while Deutsche Cell expanded from 1 MWp (2002) to 17<br />
MWp (2003).<br />
An important issue for manufacturers, especially smaller<br />
companies who do not have the backing of a multinational<br />
parent, is being able to match the opening of new production<br />
capacity with expected demand. Investors need a planning<br />
horizon that goes beyond a typical factory’s write-off period of<br />
five to seven years. Some smaller companies have nonetheless<br />
been able to obtain investment from public share ownership,<br />
often through one of the increasing number of green<br />
investment funds.<br />
This is why the relative stability of systems like the German<br />
Renewable Energy Law (see Part Three: The Solar Race) has<br />
proved crucial to business commitment. In anticipation of a<br />
flourishing market, Germany has seen a steady increase in both<br />
solar cell and module manufacture from 1995 onwards. During<br />
the period of the 100,000 roofs programme, from 1999 to 2003,<br />
more than ¤ 1 billion was invested in new production facilities.<br />
Further encouraged by the Renewable Energy Law, updated in<br />
2004, production of cells increased from 32 MWp (2001) to 110<br />
MWp (2003) and of modules from 31 MWp (2001) to 80 MWp<br />
(2003). It is anticipated that cell production will increase to 500<br />
MWp, and module production to 380 MWp, by the end of 2006.<br />
For comparison, in the same period (2001-3) Japanese<br />
production of solar cells rose from 170 to 365 MWp and of<br />
modules from 172 to 400 MWp.<br />
Figure 2.1: Development of solar manufacture in Germany<br />
120 [MW/yr]<br />
100<br />
80<br />
60<br />
40<br />
20<br />
32<br />
Cell<br />
Module<br />
Germany Cell & Module Production<br />
110<br />
2001<br />
2002<br />
2003<br />
Source: International Energy Agency – Photovoltaic Power Systems Programme<br />
Figure 2.2: Development of solar manufacture in Japan<br />
500 [MW/yr] Japan Cell & Module Production<br />
400<br />
300<br />
200<br />
100<br />
170<br />
Cell<br />
Module<br />
57<br />
244<br />
365<br />
2001<br />
2002<br />
2003<br />
Source: International Energy Agency – Photovoltaic Power Systems Programme<br />
MANUFACTURING AND OPERATING COSTS<br />
The cost of manufacturing both solar cells and modules and<br />
other components has been falling steadily. As a result, the<br />
price of PV systems has fallen by an average of 5% per annum<br />
over the last 20 years. It is expected that this rate of price<br />
decrease can be maintained in the future.<br />
Prices for PV systems vary between countries and according to<br />
the level of market development in different regions of the<br />
world, but an average price estimate for a turnkey solar<br />
electricity system of a few kWp capacity would be ¤ 6000/kWp<br />
for grid connected systems and about ¤ 8,500 for stand-alone<br />
systems. This would result in life-cycle running costs for solar<br />
electricity ranging from ¤ 0.25/kWh up to ¤ 1/kWh, depending<br />
on the available insolation and financial assumptions. These<br />
costs make PV an economically advantageous choice in a large<br />
variety of applications where no mains electricity is available.<br />
By contrast, the grid-connected market must still depend for<br />
the moment on government incentive programmes. In Japan,<br />
18
Table 2.1: PV cell manufacture – leading producers by region<br />
Region Total shipments in 2003 Growth from 2002 Leading producers Shipments in 2003<br />
Europe 202.3 MWpeak 43.5% RWE-Schott Solar (Germany) 40.0 MWpeak<br />
Isofoton (Spain)<br />
Q-Cells (Germany)<br />
Deutsche Cell (Germany)<br />
Photowatt-France (France)<br />
BP Solar (Spain)<br />
Ersol (Germany)<br />
Shell (Germany/ Netherlands)<br />
Sunways (Germany)<br />
Astro Power (Spain)<br />
Antec (Germany)<br />
35.2 MWpeak<br />
28.2 MWpeak<br />
17.0 MWpeak<br />
17.0 MWpeak<br />
15.5 MWpeak<br />
9.0 MWpeak<br />
9.0 MWpeak<br />
6.7 MWpeak<br />
5.5 MWpeak<br />
5.0 MWpeak<br />
United States 109.0 MWpeak - 5.7% Shell Solar 53.0 MWpeak<br />
Astro Power<br />
BP Solar<br />
USSC<br />
RWE Schott Solar<br />
24.2 MWpeak<br />
13.4 MWpeak<br />
7.0 MWpeak<br />
4.0 MWpeak<br />
Japan 365.4 MWpeak 47.8% Sharp 197.9 MWpeak<br />
Kyocera<br />
Mitsubishi Electric<br />
Sanyo<br />
Kaneka<br />
Mitsubishi Heavy Industries<br />
72.0 MWpeak<br />
42.0 MWpeak<br />
35.0 MWpeak<br />
13.5 MWpeak<br />
3.0 MWpeak<br />
Rest of the World 85.3 MWpeak 54.9% BP Solar (Australia) 26.0 MWpeak<br />
Motech (Taiwan)<br />
BP Solar (India)<br />
Suntech (China)<br />
17.0 MWpeak<br />
14.0 MWpeak<br />
9.0 MWpeak<br />
Note: This table includes most manufacturers with production over 3 MWp in 2003. Source: Photon 04/2004<br />
Table 2.2: Growth in world PV production 1995-2003 [MWpeak]<br />
Region 1995 1996 1997 1998 1999 2000 2001 2002 2003*<br />
Japan 16.40 21.20 35.00 49.00 80.00 128.60 171.22 251.07 365.4<br />
Europe 20.10 18.80 30.40 33.50 40.00 60.66 86.38 135.05 202.3<br />
US 34.75 38.85 51.00 53.70 60.80 74.97 100.32 120.60 109.0<br />
ROW 6.35 9.75 9.40 18.70 20.50 23.42 32.62 55.05 85,3<br />
Total 77.60 88.60 125.80 154.90 201.30 287.65 390.54 561.70 762. 0<br />
Source: PV News, *Photon<br />
19
PART TWO: THE <strong>SOLAR</strong> POWER MARKET<br />
however, where subsidies were cut dramatically by 50% in<br />
March 2004, the level of applications for PV systems to the New<br />
Energy Foundation continued to remain at the same level in the<br />
immediate aftermath of the cut. This suggests that the market<br />
has already reached a substantial level of sustainability as a<br />
result of the former incentive programmes, a pattern which can<br />
be expected to repeat itself in other countries with expanding<br />
markets.<br />
As with any technology the development of a learning curve<br />
leads to cost reductions. In the case of PV the cost decrease is<br />
expected to be around 20% every time the total installed<br />
capacity is doubled.<br />
TECHNOLOGY IMPROVEMENTS<br />
The production of PV cells is constantly improving as a result of<br />
both technology advances and changing industrial processes.<br />
About 60% of installation costs are represented by the module,<br />
15% by the inverter and 25% by balance of system components<br />
and assembly of the unit.<br />
EPIA’s aims for further improvements include:<br />
As larger PV cell and module factories come into operation, the degree of<br />
automation in the production process is increasing. A number of European<br />
solar cell producers have developed highly automated solar cell plants<br />
since 2001. The fact that the 1999 cell production capacity in Europe was<br />
just 80 MW, while the 2003 production capacity in Germany alone was<br />
110 MWp, clearly indicates the potential for automisation and major<br />
improvements in the production process.<br />
Conventional methods of cell production produce a wafer from bulk<br />
silicon crystal through a cost-intensive and material-inefficient sawing<br />
process. Losses during the transition from ingot to solar cell reach about<br />
50%, mainly in the form of saw slurry. One way of eliminating the sawing<br />
step is to grow ribbons of multicrystalline silicon which are already wafer<br />
thin and the correct width for use as PV cells. This method is being<br />
pioneered by RWE Schott Solar at one of its factories. EPIA has adopted the<br />
following technological aims in this field for 2010 (2020):<br />
• Material (Si) consumption for mono crystallline-Silicon from 16 g/Wp<br />
to 10 g/Wp (continuing to 8 g/Wp)<br />
• Ribbons from 10 g/Wp to 6 g/Wp (continuing to 5 g/Wp)<br />
• Wafer thickness from 300 µm to 180 µm (continuing to 100 µm)<br />
• Kerf loss in the sawing process from 250 µm to 160 µm (continuing to<br />
150 µm)<br />
Since the first solar cell was developed 50 years ago major improvements<br />
in efficiency have been achieved. With much potential still to be exploited,<br />
EPIA has defined the following aims for the European PV industry up to<br />
2010 (2020):<br />
• Efficiency increase for monocrystalline silicon from 16.5% to 20%<br />
(continuing to 22%)<br />
• Efficiency increase for multicrystalline silicon from 14.5% to 18%<br />
(continuing to 20%)<br />
• Ribbon efficiency from 14% to 17% (continuing to 19%)<br />
Improvement in the lifetime of solar modules is another road to further<br />
reducing solar electricity prices. EPIA’s aim is to expand their lifetime to 35<br />
years, for example by longer lifetime encapsulation material or new<br />
module architectures.<br />
Thin film cells, constructed by depositing extremely thin layers of<br />
photosensitive materials on a low cost backing, offer the potential for<br />
significant cost reductions. Firstly, material and energy costs should be<br />
lower because much less semiconductor material is required and much<br />
lower temperatures are needed during manufacture. Secondly, labour<br />
costs are reduced and mass production prospects improved because,<br />
unlike thick crystalline technologies where individual cells have to be<br />
mounted in frames and wired together, thin films are produced as large,<br />
complete modules.<br />
EPIA has defined two targets for thin film technology up to 2010 (2020):<br />
• Thin film aiming at efficiencies between 10% and 12% (a-Si/µc-Si, CIS<br />
and CdTe) (continuing to 15%)<br />
• Building integrated PV (BIPV) with low cost per mC, price reduction of<br />
50% (continuing with an additional 50%)<br />
20
PART THREE<br />
THE <strong>SOLAR</strong> RACE
PART THREE: THE <strong>SOLAR</strong> RACE<br />
As the vast potential of solar power as a clean energy source<br />
begins to emerge, national governments around the world have<br />
started to support its development through both research and<br />
market support. Pursuing their regional and international<br />
commitments to combat the effects of climate change, a<br />
number of countries have given strong backing to an emerging<br />
solar market. Importantly, they have also persuaded their<br />
general publics that there are important social and<br />
environmental benefits to be captured.<br />
The argument in countries like Japan and Germany is<br />
straightforward: by offering market incentives for the installation<br />
and operation of solar arrays, a dynamic relationship is<br />
created between market promotion and industrial growth,<br />
eventually encouraging a flourishing manufacturing base and<br />
export potential. The environmental dividend is a cleaner<br />
planet. These are the leaders in a solar race which will soon see<br />
others joining the pursuit.<br />
Germany<br />
• PV capacity end 2003: 416 MWp<br />
• Support system: Premium price per kWh, financing opportunities<br />
from the German Bank for Reconstruction<br />
Germany is the European leader in solar energy. Having already<br />
developed the world’s largest installed capacity of electricity<br />
generating wind turbines, Europe’s most populous state is now<br />
looking to push photovoltaics into an equally prominent<br />
position.<br />
In terms of installed capacity, Germany overtook the USA in<br />
2001 to achieve second position globally behind Japan. At the<br />
end of 2003 total capacity had reached 416 MWp, with 130 MWp<br />
installed last year alone. In the 2001 edition of Solar Generation<br />
it was ambitiously estimated that the country could achieve a<br />
figure of 438 MWp by 2004. This has in fact been almost reached<br />
by the end of 2003, and with the expectation that more than<br />
650 MWp will be installed by the end of 2004.<br />
In the background to this success is the German Social<br />
Democrat/Green government’s Kyoto-led commitment to<br />
reduce its emissions of greenhouse gases by 21% over the period<br />
1990 to 2008-11. This will be achieved by a mixture of shifting<br />
energy production towards cleaner sources and a programme<br />
of energy efficiency. Two successive pieces of legislation have<br />
been crucially important in supporting the first of these aims -<br />
the 100,000 roofs programme started in 1999 and the 2000<br />
Renewable Energy Law, updated in 2004. One result is that the<br />
wind energy industry has seen a capacity of over 15,000 MW<br />
installed, representing roughly 5% of electricity supply, and an<br />
Figure 3.1: Installed PV in Germany by sub-market<br />
400<br />
Source: IEA- PVPS<br />
Cumulative installed PV-Power<br />
300<br />
250<br />
grid-connected centralized<br />
grid-connected distributed<br />
off-grid non-domestic<br />
off-grid domestic<br />
200<br />
Cumulative installed PV Power [MWpeak]<br />
150<br />
100<br />
50<br />
31 Dec.<br />
1992<br />
31 Dec.<br />
1993<br />
31 Dec.<br />
1994<br />
31 Dec.<br />
1995<br />
31 Dec.<br />
1996<br />
31 Dec.<br />
1997<br />
31 Dec.<br />
1998<br />
31 Dec.<br />
1999<br />
31 Dec.<br />
2000<br />
31 Dec.<br />
2001<br />
31 Dec.<br />
2002<br />
31 Dec.<br />
2003<br />
22
estimated 45,000 jobs created in less than a decade. The<br />
German solar industry has now started a similar boom for PV.<br />
THE ROOFTOP PROGRAMMES<br />
Germany has been a pioneer in grid-connected PV, with an<br />
extremely effective “1,000 Rooftop Programme” running from<br />
1990 to 1995. More than 2,250 rooftop installations were<br />
connected to the grid during this period, with an average<br />
capacity of 2.6 kW per roof. In 1995, total system costs averaged<br />
® 12.27/W and produced an average 700 kWh per kW installed<br />
over the year.<br />
At the end of this programme the German PV market suffered a<br />
significant breakdown, however, and <strong>Greenpeace</strong> and other<br />
organisations started extensive lobbying work to encourage a<br />
follow-up. <strong>Greenpeace</strong> launched a solar pioneer programme in<br />
1995 and has continued since then with extensive information<br />
work in favour of solar PV. Between 1995 and 1999 about 40<br />
cities and towns also implemented their own “rate based”<br />
incentive schemes. These allowed residential customers to sell<br />
electricity from their rooftop PV systems to the utility for up to<br />
¤ 1.02/kWh. The purchase price was usually supported by a 1%<br />
levy on electricity sales, mostly introduced after a vote among<br />
local electricity customers. This support was eventually<br />
superseded by the national Renewable Energy Law.<br />
In 1999, a new five year programme was launched to promote<br />
the installation of PV on 100,000 German roofs, with a budget<br />
of ¤ 460m. The aim was to develop a total generating capacity<br />
of 300 MWp. For both private households and businesses the<br />
incentive came through a guaranteed ten year low interest loan<br />
(1.9% per annum), and with no repayments in the first two<br />
years. Such loans were considered a proven method of avoiding<br />
PV’s currently high start-up investment costs.<br />
Although initial reaction to the “100,000 Roofs” programme<br />
was disappointing, the new Renewable Energy Law (REL)<br />
introduced in April 2000 accelerated the market dramatically.<br />
Under the REL, anyone who installed a solar generation system<br />
received a buy-back rate of ¤ 0.5 per kWh over 20 years. This<br />
payment then reduced by 5% each year from 2001 onwards for<br />
newly installed systems, a fall intended to mirror the<br />
anticipated reduction in the price of PV.<br />
This combination of the solar roof programme and the REL has<br />
proved a potent mix. Such was the overwhelming response that<br />
the 2000 PV loans budget of ¤ 92m was already used up by the<br />
almost 4,000 applications approved during the first quarter of<br />
the year. Thousands more applications had to be postponed due<br />
to lack of funds. During 2000 alone more than 8,000 systems<br />
were approved, with a total capacity of 41.66 MW. The average<br />
size also increased to 5.18 kWp, with over 100 plants in the 50 to<br />
120 kWp range - a sign that the market was moving into the<br />
business/industrial sector. With the ending of the 100,000<br />
roofs programme the Renewable Energy Law was revised (see<br />
table below). There are also still possibilities to receive a low<br />
interest rate loan for investment in a PV system, for example<br />
under the COc abatement programme.<br />
The outcome of the 100,000 roofs programme (1999-2003) with<br />
support from the 2000 Renewable Energy Law is impressive:<br />
• 345.5 MWp installed<br />
• Total investment by customers ¤ 1.77 billion<br />
• Market volume increase from 12 MWp in 1999 to 130 MWp in<br />
2003<br />
• PV system price reduction of 20%<br />
• Investment by the PV industry of ¤ 1 billion<br />
FUTURE PROSPECTS<br />
The German government, strongly supported by public opinion,<br />
clearly considers PV to be a viable long term option for bulk<br />
production of carbon-free power. Public funding of R&D, about<br />
¤ 17,25m in 2003, is therefore likely to continue. Its focus will be<br />
firstly on reducing the costs of solar cell and module production,<br />
and secondly on improving the efficiency and reliability of<br />
systems.<br />
Most importantly, the Renewable Energy Law has provided a<br />
secure, medium-term planning base for investment, at the<br />
same time helping to move the technology forward from smallscale<br />
manufacturing for niche markets to mass production for a<br />
broad range of applications.<br />
Table 3.1: PV feed-in tariffs under REL from 2004 in Euro-cents per kWh<br />
Year 2004 2005 2006 2007 2008<br />
Roof 57.40 54.53 51.80 49.21 46.75<br />
Above 30 kW 54.60 51.87 49.28 46.82 44.48<br />
Above 100 kW 54.00 51.30 48.74 46.30 43.99<br />
Facade bonus 5.00 5.00 5.00 5.00 5.00<br />
Open space 45.70 43.42 40.60 37.96 35.49<br />
Note: Rates reduce by 5% per year from 2005 onwards, by 6.5% per year for PV in open space/fields from 2006 onwards<br />
23
PART THREE: THE <strong>SOLAR</strong> RACE<br />
The Rest of Europe<br />
• Spain has an overall target to double its proportion of<br />
renewable energy to 12% by 2010. The 1998 feed-in law was<br />
revised in March 2004, with some significant changes and new<br />
conditions which should be excellent tools for getting the PV<br />
market moving. These include:<br />
- 41.4 ¤ cents/kWh up to system sizes of 100 kWp (until 150<br />
MWp installed, then new calculation of the tariff for further<br />
systems)<br />
- 21.6 ¤ cents/kWh for system sizes above 100 kWp (until 200<br />
MWp installed, then new calculation of the tariff for further<br />
systems)<br />
- payment period fixed at 25 years, then reduced to 80%.<br />
• Italy launched a solar roof programme in 2001, but success has<br />
been very limited. The Italian parliament has decided to<br />
introduce a premium feed-in tariff, but the level of the tariff<br />
and other conditions have not yet been defined.<br />
• Luxemburg has an extremely attractive support system, with<br />
investment support and up to 45 ¤ cents/kWh feed-in tariff.<br />
• The United Kingdom had 5.9 MWp of capacity installed by the<br />
end of 2003, mostly the result of capital grants totalling ¤ 56<br />
million offered by the government.<br />
• After several years of regional programmes, Austria introduced<br />
a national feed-in tariff at the beginning of 2003. Due to the<br />
very limited installed capacity (15 MWp) supported, applications<br />
were accepted for a period of less than one month.<br />
• In Greece the implementation of a feed in tariff for PV is under<br />
discussion.<br />
• Other European countries are also pursuing solar programmes,<br />
mainly targeted at the grid-connected sector.<br />
USA<br />
• PV capacity end 2003: 275 MWp<br />
• Support system: Federal tax credit plus separate state incentives;<br />
Million Solar Roofs Initiative.<br />
Since 1995 the US PV industry has been growing at an average<br />
annual rate in excess of 20%. Both the industry and the<br />
government’s Department of Energy see this trend continuing<br />
or accelerating in the future as PV becomes more established as<br />
a preferred technology in key markets. The manufacturing<br />
Figure 3.2: Installed PV in the United States by sub-market<br />
280<br />
Source: IEA- PVPS<br />
260<br />
240<br />
220<br />
200<br />
grid-connected centralized<br />
grid-connected distributed<br />
off-grid non-domestic<br />
off-grid domestic<br />
Cumulative installed PV Power [MWpeak]<br />
180<br />
160<br />
140<br />
120<br />
100<br />
80<br />
31 Dec.<br />
1992<br />
31 Dec.<br />
1993<br />
31 Dec.<br />
1994<br />
31 Dec.<br />
1995<br />
31 Dec.<br />
1996<br />
31 Dec.<br />
1997<br />
31 Dec.<br />
1998<br />
31 Dec.<br />
1999<br />
31 Dec.<br />
2000<br />
31 Dec.<br />
2001<br />
31 Dec.<br />
2002<br />
31 Dec.<br />
2003<br />
24
industry’s goal is to sustain a 30 to 35% annual growth over the<br />
next 20 years. In terms of installations, PV has reached a level of<br />
275 MWp, with 63 MWp being installed during 2003.<br />
Access to PV systems is growing fast in California, but is limited<br />
in the rest of the country. Over 80% of systems have been<br />
installed in California, where more than 4 out of 5 people favour<br />
doubling the state’s supply of renewable energy sources by<br />
2010. Other states, including Arizona, Connecticut, Maine,<br />
Massachusetts, Nevada, New Jersey, New Mexico, Pennsylvania,<br />
Texas and Wisconsin have introduced Renewable Portfolio<br />
Standard programs, which have increased renewable energy<br />
use, but have had a limited impact on PV development.<br />
The US PV production market is largely in the hands of<br />
multinational companies. AstroPower has been bought by<br />
General Electric, while the biggest US producers, Shell Solar and<br />
BP Solar, account for nearly two thirds of solar cell production.<br />
ECONOMICS<br />
There is no national price incentive programme for PV, as in<br />
Germany, and support is largely dependent on individual state<br />
initiatives. “Commercial” PV (not domestic) is eligible for a<br />
federal 10% tax credit, but this has not been enough by itself to<br />
stimulate the market.<br />
Various support measures have been considered by the US<br />
Congress. The 2001 National Energy Security Policy Act, for<br />
instance, would have offered a 15% residential solar tax credit of<br />
up to $ 2,000 and a buy-down payment starting at $ 3 per watt<br />
of installed capacity. The buy-down (capital subsidy)<br />
programme already operating in California, which offers $ 3 per<br />
watt, resulted last year in 400 grid-connected systems of 2-4<br />
kW capacity being installed.<br />
The US PV industry has also benefited from state incentives and<br />
policies designed to increase the use of renewable energy. A<br />
number of initiatives beneficial to solar power, including green<br />
pricing schemes (where consumers agree to pay extra for a<br />
supply of renewable electricity), renewables portfolio<br />
standards (commitment that a specific percentage of the state’s<br />
power should come from renewables), and system benefit<br />
charges (where a levy is made on all electricity users to fund<br />
renewables) have been passed by individual states. In addition,<br />
more than 35 states have introduced net metering, where the<br />
power utility agrees to pay the same amount for the output<br />
from a solar system as consumers pay for their supply.<br />
RESEARCH AND DEVELOPMENT PROGRAMS<br />
The US Department of Energy directs research focused on<br />
increasing domestic capacity by lowering the cost of delivered<br />
electricity and improving the efficiency of PV modules and<br />
systems.<br />
Specific goals up to 2006 are to:<br />
• Reduce the direct manufacturing cost of PV modules by 30% to<br />
$ 1.75/W<br />
• Establish greater than 20 year lifetimes for PV systems by<br />
improving the reliability of balance-of-system components and<br />
reducing recurring costs by 40%<br />
• Work with the PV industry to facilitate achievement of its<br />
roadmap goals of 1 GW cumulative US sales (export and<br />
domestic) by 2006<br />
• Ensure that the National Solar Program shares the costs in areas<br />
of fundamental research, technology development and advanced<br />
materials and devices<br />
The total federal budget for the photovoltaic component of the<br />
National PV Subprogram totalled $ 64 million in 2003, with<br />
additional Congressional funding of $ 10.7 million for the<br />
Million Solar Roofs Program, an inverter initiative and various<br />
specific PV installations.<br />
FUTURE PROSPECTS<br />
Government projections suggest that solar PV will be the<br />
fastest growing source of generation in the US over the next 20<br />
years, with its use expanding at a rate of more than 19% per<br />
year up to 2020. All renewables, including geothermal, biomass<br />
and wind, could be providing 8% of the country’s electricity<br />
over the same time scale.<br />
The US PV industry has meanwhile presented a longer term<br />
strategy which looks further ahead than the five year cycles of<br />
the government’s PV programme. Marking out a 20 year<br />
roadmap for research, technology and market priorities, this<br />
framework assumes a world wide annual growth rate of 25% up<br />
to 2020, and with the goal of reaching a 40% share for US<br />
module manufacturers. By 2020, this means that the US<br />
industry could be supplying at least 6 GW to be installed world<br />
wide, with 15 GW installed in the US itself. On that basis the PV<br />
industry would be approaching a turnover of $ 10 billion a year,<br />
creating tens of thousands of jobs and enormous environmental<br />
benefits.<br />
The future for PV in the US is crucially dependent, however, on<br />
the ongoing stance on energy issues taken by the Bush<br />
administration, especially over climate change. At the time of<br />
writing the US has still refused to sign up to the latest<br />
international agreement resulting from the Kyoto Protocol,<br />
which details how developed countries will reduce their<br />
greenhouse gas emissions.<br />
On current trends US Americans are expected to use 27% more<br />
energy in 2020 compared to 1998, with electricity use increasing<br />
the fastest. Without a significant commitment to energy<br />
efficiency and renewable energy, high electricity consumption<br />
could result in 1,000 new power plants being built by 2020, the<br />
vast majority powered by fossil fuels.<br />
Meanwhile, the United States has tumbled from its position as<br />
a leader in the solar industry. In 1995 the US produced 45% of<br />
the world’s solar cells, but the lack of a national policy<br />
promoting solar energy has held growth down. Without the<br />
support of state governments such as California (see box), the<br />
country would have fallen even further behind.<br />
25
PART THREE: THE <strong>SOLAR</strong> RACE<br />
State Initiatives in the US<br />
Solar Initiatives in California<br />
California is driving the US market for solar energy almost entirely<br />
because of incentive programs offered through the state’s<br />
electricity suppliers. The main subsidy programs are the California<br />
Energy Commission’s Emerging Renewables Program - which<br />
offers $ 3 per watt towards capital costs and resulted in 3,200 solar<br />
installations in 2003 - the California Public Utility Commission’s<br />
Self-Generation Incentive Program and programs run by Los<br />
Angeles Department of Water and Power and Sacramento<br />
Municipal Utility District. PV installations under these and a<br />
handful of other small programs reached 14 MW in 2002 and 26<br />
MW in 2003, with a total of nearly 79 MW installed by June 2004.<br />
The California Energy Commission has also simplified the rules<br />
and tariffs for net metering, and reduced the paperwork for<br />
interconnection requirements for grid-connected photovoltaic<br />
systems.<br />
San Diego: The city of San Diego has committed to a first-of-itskind<br />
clean energy initiative to meet the city’s growing electricity<br />
demand. Under this plan, San Diego will generate 50 MW of clean<br />
energy over the next ten years to meet the region’s projected<br />
energy shortfalls and stop another energy crisis. The City is<br />
expected to meet the majority of that demand with solar power.<br />
This is the first time a major US city council has initiated such a<br />
plan as the solution to its energy needs, and was a major victory<br />
for the <strong>Greenpeace</strong> Clean Energy Now team.<br />
San Francisco: In November 2001, San Francisco voters approved a<br />
$ 100 million revenue bond for renewable energy and energy<br />
efficiency that pays for itself from the savings, costing taxpayers<br />
nothing. The bond pays for solar panels, wind turbines and energy<br />
efficiency measures for public buildings. The money that would<br />
have gone to buy electricity from power plants instead goes to<br />
finance the bond.<br />
University of California: The university is committed to install 10<br />
MW of solar units across its ten campus network. <strong>Greenpeace</strong> was<br />
instrumental in securing this commitment.<br />
Other State Initiatives<br />
• The state of New Jersey offers a $ 5.50/Wp subsidy for<br />
photovoltaic systems. The Clean Energy Rebate Program has<br />
budgeted $ 16.2 million up to 2008. The program has supported<br />
(or reserved incentives for) 91 projects totalling over 3,300 kW<br />
of power.<br />
• Illinois: LLed by the strong "Brightfields” program in Chicago,<br />
where abandoned ”brownfield" factory sites are converted to<br />
either photovoltaic manufacturing plants (owned and operated<br />
by Spire Corporation) or installed photovoltaic systems. The<br />
state of Illinois passed the largest subsidy in the United States<br />
for photovoltaic systems, $ 6/Wp. Over 1 MW of PV was installed<br />
in the state in 2002.<br />
• New York: New York has agreed over $ 50 million to support<br />
new industry, new installations and studies to accelerate<br />
commercialisation of photovoltaic systems. New York increased<br />
the photovoltaic subsidy to $ 5/W in May 2002 for gridconnected<br />
systems.<br />
• Virginia: Virginia offers a $ 0.75/W cash rebate for installed<br />
photovoltaic modules produced in the state. This program is<br />
capped at $ 6 million per year.<br />
• Connecticut: The Connecticut Clean Energy fund has allocated<br />
$ 5.3 million in subsidies, with $ 5.75/Wp offered for residential<br />
PV systems.<br />
• Nevada: The Nevada Demonstration Program offers up to $ 5/<br />
W for residential, small businesses, Indian tribes and schools.<br />
The program has $ 20 million to distribute over 3 years.<br />
• North Carolina: Carolina offers a 35% tax credit for photovoltaic<br />
system installations.<br />
• Ohio: Support for 50 public schools to have photovoltaic<br />
systems/training modules installed.<br />
Japan<br />
• PV capacity end 2003: 860 MWp<br />
• Support system: Various government programmes, including<br />
grants for domestic PV roofs, and net metering support provided<br />
by utilities<br />
Renewable energy is seen as an indispensable part of Japanese<br />
climate change policy and carbon reduction targets, as well as<br />
an emerging technology to be exploited. Various supportive<br />
policies to encourage growth in the renewables market have<br />
been introduced by the government, including significant solar<br />
research and development programmes from the 1970s<br />
onwards. These policies have received backing from across the<br />
spectrum of public bodies, academics, NGOs and the business<br />
community. Japan now has PV systems on thousands of<br />
schools, hospitals, factories, warehouses, offices, houses and<br />
railway stations.<br />
By the end of 2003 a total of 860 MWp had been installed in<br />
Japan, with government plans for 4.8 GWp by 2010, an<br />
ambitious target requiring an annual growth rate of 30%. The<br />
annual growth rate since 1998 has been up to 45%, however. If<br />
the current trend continues, 70 to 80% of installations in Japan<br />
will be rooftop systems with an average size of 3.8 kWp.<br />
The national Japanese programme is aimed at rapid expansion<br />
in the number of units coupled with a decreasing percentage of<br />
subsidy. The overall goal is to stimulate production, bring prices<br />
down, create market awareness and leave Japanese industry<br />
with a fully economic market which will encourage competitive<br />
exports to the rest of the world. In pursuit of these objectives,<br />
the budget for the residential PV system dissemination<br />
programme was cut from $ 223 million in 2002 to $ 100 million<br />
in 2003, and by a further 50% this year. This reduced the subsidy<br />
per kWp from $ 862/kWp in 2003 to $ 430/kWp in 2004. Even so,<br />
the market has continued to grow, the number of subsidy<br />
applications increased during 2003, while the price for PV<br />
26
Figure 3.3: Installed PV in Japan by sub-market<br />
Source: IEA- PVPS<br />
800<br />
700<br />
grid-connected centralized<br />
grid-connected distributed<br />
off-grid non-domestic<br />
off-grid domestic<br />
600<br />
500<br />
Cumulative installed PV Power [MWpeak]<br />
400<br />
300<br />
200<br />
100<br />
31 Dec.<br />
1992<br />
31 Dec.<br />
1993<br />
31 Dec.<br />
1994<br />
31 Dec.<br />
1995<br />
31 Dec.<br />
1996<br />
31 Dec.<br />
1997<br />
31 Dec.<br />
1998<br />
31 Dec.<br />
1999<br />
31 Dec.<br />
2000<br />
31 Dec.<br />
2001<br />
31 Dec.<br />
2002<br />
31 Dec.<br />
2003<br />
installed capacity has continued to fall to a present level of<br />
about $ 6,500/kWp. One specific result is that the National<br />
Institute of Advanced Industrial Science and Technology in<br />
Tsukuba, Ibaraki has installed PV demonstration facilities<br />
amounting to over 1 MWp. This is the largest ever in Japan,<br />
providing 1 GWh of clean electricity and a COc reduction of 300<br />
tons annually.<br />
GOVERNMENT SUPPORT<br />
The Japanese government has focussed large financial<br />
resources on the PV market in order to establish internationally<br />
competitive mass production. Comprehensive financial, tax<br />
and system support measures are used to promote solar and<br />
other “new energy” (renewable) technologies which are already<br />
established but not yet commercially competitive.<br />
Most of this funding - for a mixture of R&D, demonstration<br />
programmes and market incentives - has been made available<br />
since 1980 through NEDO, the New Energy and Industrial<br />
Technology Development Organisation and the New Energy<br />
Foundation. Japanese PV budgets grew almost linearly from<br />
$ 20 million in 1980 to $ 240 million in 2004.<br />
The following programmes are in place for PV promotion and<br />
technological development.<br />
Table 3.2: Japanese PV support<br />
programmes<br />
Residential PV system dissemination<br />
programme<br />
Field test projects on PV power generation<br />
systems for industrial and other applications<br />
Field test projects on advanced PV power<br />
generation technologies<br />
Research and development of PV generation<br />
technologies<br />
International cooperative Demonstration<br />
Acceleration<br />
Demonstration development of centralised<br />
grid-connected PV system<br />
Budget for FY2004<br />
in $ million<br />
50.5<br />
1.3<br />
48.4<br />
62.9<br />
20.3<br />
Total 240.5<br />
While most of the budgets had been cut compared to the<br />
previous year, the two programmes covering advanced PV<br />
power generation technologies and centralised grid-connected<br />
PV systems have seen an increase of almost 90% compared to<br />
2003.<br />
57.1<br />
27
PART THREE: THE <strong>SOLAR</strong> RACE<br />
Japan’s national programmes for renewables during 2004<br />
include:<br />
• RPS Law (2003) obliges electric utilities to achieve a target for<br />
1.35% of their electricity supply to come from renewable energy<br />
sources, including solar, by 2010.<br />
• The Regional New Energy Introduction Project aims to accelerate<br />
the introduction of new energy (renewable) technologies by<br />
supporting regional government projects. Half of system<br />
installation costs are subsidised.<br />
• The Subsidy Programme for New Energy Industrialists supports<br />
businesses which plan to introduce new energy, including PV.<br />
• The programme for development of regional new energy visions<br />
helps local government and related bodies to create visions for<br />
facilitating promotion of renewable energy at local levels.<br />
ECONOMICS<br />
Japan has had an aggressive PV R&D programme since the late<br />
1970s, with virtually all funds directed at developing an<br />
industry capable of competing in the world market, and with<br />
cost reductions that would also serve the domestic market.<br />
In the past five years PV system costs have reduced by another<br />
33%. In the future it is expected that the average price of a<br />
residential PV system will fall even further, to below $ 4,000/<br />
kWp. Even so, the cost of PV electricity is still presently more<br />
than twice the price of conventional domestic power, which is<br />
exceptionally expensive in Japan. If the added value of solar<br />
systems in environmental terms was monetised for customers,<br />
however, PV would be able to compete much earlier than<br />
expected.<br />
One other factor is the introduction of premium green pricing<br />
for renewable electricity. All ten Japanese regional power<br />
utilities introduced a “Green Power Fund” at a monthly rate of<br />
$ 1-4 from October 2000, with the companies matching this<br />
amount towards the installation of new renewable plants.<br />
Most electric utilities also have net metering systems by which<br />
they buy PV electricity from individual customers. As a result of<br />
the RPS law, however, some utilities have refused to buy at the<br />
same price level when they cannot use credits from the PV<br />
electricity put into the grid by individual customers for<br />
achieving their respective RPS targets. In these cases, the<br />
purchase price has fallen dramatically to 3-5 cents per kWh.<br />
NATIONAL TARGETS<br />
Following the climate change summit at Kyoto in 1997, Japan<br />
announced (in 2001) an accelerated target to install 4,820 MW<br />
of PV by 2010. Projections by the Japan Photovoltaic Energy<br />
Association (JPEA) show that annual installations could reach<br />
1,230 MWp by 2010, with a corresponding market size of $ 4.5<br />
billion. Looking further ahead, the goal set by JPEA is to increase<br />
the annual market to 4,300 MWp by 2020, with a total capacity<br />
of 28,700 MWp installed. For 2030 the goal is to reach an annual<br />
market of 10,000 MWp, with a cumulative installed capacity of<br />
82,800 MWp. By then the PV industry in Japan would have<br />
created 300,000 jobs, the PV installation rate would be at 45%<br />
for detached houses and the price for a kWp PV system would<br />
have fallen below $ 2,000.<br />
The total future potential for PV power generation in Japan is as<br />
much as 173 GW, according to calculations made by the<br />
government agency METI in 2000.<br />
Prime Power<br />
PV has been installed on a new building at the official residence<br />
of the Japanese Prime Minister, a symbol that solar power is<br />
central to the country’s future energy regime.<br />
28
PART FOUR<br />
THE <strong>SOLAR</strong> FUTURE
PART FOUR: THE <strong>SOLAR</strong> FUTURE<br />
THE GREENPEACE/EPIA<br />
“<strong>SOLAR</strong> <strong>GENERATION</strong>” SCENARIO<br />
Methodology & Assumptions<br />
If PV is to have a promising future as a major energy source it<br />
must build on the experiences of those countries which have<br />
already led the way in stimulating the solar energy market. In<br />
this section of the report we look forward to what solar power<br />
could achieve - given the right market conditions and an<br />
anticipated fall in costs - over the first two decades of the<br />
twenty-first century. As well as projections for installed<br />
capacity and energy output we also make assessments of the<br />
level of investment required, the number of jobs which would<br />
be created and the crucial effect which an increased input from<br />
solar electricity will have on greenhouse gas emissions.<br />
Projection to 2040: For the period 2020-2040 a very conservative<br />
lifetime of 25 years has been assumed for PV modules. As a<br />
result, the capacity installed in the first year of the scenario has<br />
been subtracted from the figure for cumulative installed<br />
capacity reached after 25 years. This methodology has then<br />
been applied to all subsequent years.<br />
The scenario is also divided in two ways - into the four global<br />
market divisions (consumer applications, grid-connected,<br />
remote industrial and off-grid rural), and into the regions of the<br />
world as defined in projections of future electricity demand<br />
made by the International Energy Agency. These regions are<br />
OECD Europe, OECD Pacific, OECD North America, Latin America,<br />
East Asia, South Asia, China, the Middle East, Africa and the Rest<br />
of the World.<br />
This scenario for the year 2020, together with an extended<br />
projection forwards to 2040, is based on the following core<br />
inputs.<br />
• PV market development over recent years both globally and in<br />
specific regions<br />
• National and regional market support programmes<br />
• National targets for PV installations and manufacturing<br />
capacity<br />
• The potential for PV in terms of solar irradiation, the availability<br />
of suitable roof space and the demand for electricity in areas not<br />
connected to the grid<br />
THE GREENPEACE/EPIA<br />
“<strong>SOLAR</strong> <strong>GENERATION</strong>” SCENARIO<br />
Key Results<br />
These are the headline findings of the <strong>Greenpeace</strong>/EPIA “Solar<br />
Generation” scenario. They show clearly that, even from a<br />
relatively low baseline, PV electricity has the potential to make<br />
a major contribution to both future electricity supply and the<br />
mitigation of climate change.<br />
Table 4.1: The <strong>Greenpeace</strong>/EPIA “Solar Generation” Scenario<br />
The following assumptions have been employed:<br />
Market growth rates: For Europe, Japan and the US, growth<br />
rates have been based on market development over the last few<br />
years and on targets laid down by some countries for installed<br />
PV capacity by 2010. For other countries the market expectations<br />
are based on their likely take-off as the technology spreads. The<br />
average annual growth rate worldwide up to 2009 is projected<br />
to be 27%, then rising to 34% between 2010 and 2020. Initial<br />
growth is expected to be fastest in the grid-connected sector,<br />
but by 2010 growth rates in the emerging off-grid rural sector<br />
are expected to have overtaken, due to a significant reduction in<br />
costs and the likelihood of competitive electricity production<br />
prices.<br />
Electricity generation: Figures for the growth in global<br />
electricity demand up to 2020, on which comparisons with<br />
expected PV development are based, are taken from projections<br />
by the International Energy Agency. These show total world<br />
demand for power increasing from 15,300 TWh in 2000 to<br />
20,900 TWh in 2010 and 25,579 TWh by 2020.<br />
Global Solar Electricity Output<br />
in 2020:<br />
Global Solar Electricity Output<br />
in 2040:<br />
Detailed Projections for 2020:<br />
PV systems capacity<br />
Grid-connected consumers<br />
Off-grid consumers<br />
Employment potential<br />
Investment value<br />
Prices for grid connected<br />
PV systems<br />
Cumulative carbon savings<br />
282 TWh<br />
= 10% of EU-25 electricity<br />
demand in 2003<br />
= 1.1% of global electricity<br />
demand<br />
7,442 TWh<br />
= 21% of global electricity<br />
demand<br />
205 GWp<br />
93 million world wideB<br />
31 million in Europe<br />
950 million world wideC<br />
2.25 million full-time jobs world<br />
wide<br />
¤ 62 billion per annum<br />
Reduction to ¤ 2 per Wp<br />
730 million tonnes of COc<br />
Carbon dioxide savings: An off-grid solar system which<br />
replaces an average diesel unit will save about 1 kg COc per<br />
kilowatt hour of output. The amount of COc saved by gridconnected<br />
PV systems depends on electricity production in<br />
different countries. The world average figure is 0.6 kg COc per<br />
kilowatt-hour. For the whole scenario period it has therefore<br />
been assumed that PV installations will save on average 0.6 kg<br />
COc per kilowatt hour.<br />
1. Calculation basis: 2.5 persons per household, with an annual consumption of 3,800 kWh<br />
2. Calculation basis: A 100 W solar system will cover the basic energy needs of 3-4 people<br />
1. Power Generation<br />
The <strong>Greenpeace</strong>/EPIA scenario shows that by the year 2020, PV<br />
systems could be generating approximately 282 Terawatt hours<br />
of electricity around the world. This means that enough solar<br />
power would be produced globally in twenty years’ time to<br />
30
Table 4.2: Projected growth of world solar power market up to 2020<br />
Year<br />
Annual Installed<br />
Capacity [MW]<br />
Annual Growth Rate<br />
[%]<br />
Estimated Annual PV<br />
Electricity Production<br />
[MWh]<br />
Estimated Reduction<br />
of COc [tCOc]<br />
Estimated Jobs<br />
1995 Market datas 79 12.3 539,148 323,488 4,343<br />
from EPIA, all<br />
other figures<br />
1996 calculated<br />
89 13.5 661,246 396,747 4,932<br />
1997 126 41.6 834,103 500,461 6,908<br />
1998 153 21.1 1,044,000 626,400 8,410<br />
1999 201 31.9 1,319,748 791,848 10,950<br />
2000 259 38.0 1,675,065 1,005,039 13,665<br />
2001 334 28.9 2,214,220 1,328,532 16,778<br />
2002 439 31.4 2,802,000 1,681,200 22,472<br />
2003 594 35.3 3,582,897 2,149,738 27,949<br />
2004 815 approx. 37.0 4,471,497 2,682,898 34,702<br />
2005 985 28.0 5,739,803 3,443,882 43,011<br />
2006 1,283 28.0 7,405,441 4,443,265 55,696<br />
2007 1,675 28.0 9,599,060 5,759,436 70,479<br />
2008 2,192 28.0 12,496,836 7,498,101 91,237<br />
2009 2,877 28.0 16,337,415 9,802,449 118,099<br />
2010 3,634 35.0 21,206,382 12,723,829 149,585<br />
2011 4,609 35.0 27,403,933 16,442,360 194,296<br />
2012 5,870 35.0 35,326,026 21,195,615 252,871<br />
2013 7,511 35.0 45,497,490 27,298,494 329,815<br />
2014 9,656 35.0 58,617,385 35,170,431 431,174<br />
2015 12,475 35.0 75,621,343 45,372,806 565,100<br />
2016 16,199 35.0 97,767,586 58,660,552 742,625<br />
2017 21,146 35.0 126,755,998 76,053,599 978,731<br />
2018 27,753 35.0 164,893,480 98,936,088 1,293,846<br />
2019 36,622 35.0 215,324,289 129,194,573 1,715,930<br />
2020 48,590 35.0 282,351,761 169,411,057 2,262,749<br />
2000 to 2020 205,518 1,215,755,982 730,266,385 9,410,810<br />
satisfy the current electricity needs of 10% of the expanded<br />
European Community (EU 25).<br />
The global installed capacity of solar power systems would<br />
reach 205 GWp by 2020. More than half of this would be in the<br />
grid-connected market, mainly in industrialised countries.<br />
Assuming that 80% of these systems are installed on residential<br />
buildings, and their average size is 3 kWp, each serving the<br />
needs of three people, the total number of people by then<br />
generating their own electricity from a grid-connected solar<br />
system would reach 93 million. In Europe alone there would be<br />
roughly 31 million people receiving their supply from gridconnected<br />
solar electricityB.<br />
In the non-industrialised world approximately 30 GWp of solar<br />
capacity is expected to have been installed by 2020 in the rural<br />
electrification sector. Here the assumption is that as an average<br />
a 100 Wp stand alone system will cover the basic electricity<br />
needs of 3-4 persons per dwelling. Since system sizes are much<br />
smaller and the population density greater, this means that up<br />
to 950 million people in the developing countries would by<br />
then be using solar electricity. This would represent a major<br />
breakthrough for the technology from its present emerging<br />
status.<br />
1. Average European household: 2.5 people with a consumption of 3,800 kWh per year<br />
31
PART FOUR: THE <strong>SOLAR</strong> FUTURE<br />
Figure 4.1: Growth in world solar market by application<br />
25 [MW peak]<br />
20<br />
15<br />
Grid connected<br />
Remote Industrial<br />
Off-grid rural (mainly DC)<br />
Consumer Appl.<br />
Table 4.3: Employment in PV related jobs world wide<br />
Year<br />
Jobs in<br />
Production<br />
Jobs in<br />
installation,<br />
retailing<br />
Jobs in<br />
maintenance<br />
Total<br />
2003 8,144 17,451 2,354 27,949<br />
2004 9,027 22,568 3,106 34,701<br />
2005 9,733 29,199 4,079 43,011<br />
2006 12,589 37,768 5,338 55,695<br />
10<br />
5<br />
2007 14,657 48,856 6,967 70,480<br />
2008 18,961 63,203 9,073 91,237<br />
2009 24,531 81,769 11,799 118,099<br />
2010 27,950 104,813 16,822 149,585<br />
2000<br />
2005<br />
2010 2015 2020<br />
2011 35,907 134,651 23,738 194,296<br />
2012 46,240 173,401 33,230 252,871<br />
By 2040, the penetration of solar generation would be even<br />
deeper. Assuming that overall global power consumption had<br />
by then increased from 25,578 to 36,000 TWh, the solar<br />
contribution would equal 21% of the world’s electricity output.<br />
This would place solar power firmly on the map as an<br />
established energy source.<br />
2. Employment<br />
More jobs are created in the installation and servicing of PV<br />
systems than in their manufacture. Based on information<br />
provided by the industry, it has been assumed that today’s 17<br />
jobs per MW in production will be reduced to 15 in 2010,<br />
decreasing to 10 jobs per MW between 2010 and 2020. About<br />
30 jobs per MW will be created during the process of installation,<br />
retailing and providing other local services up to 2010, reducing<br />
to 26 jobs per MW between 2010 and 2020. As far as maintenance<br />
is concerned it is assumed that with the more efficient business<br />
structures and larger systems of the industrialised world, about<br />
one job will be created per installed MW. Since developing<br />
world markets will play a more significant role beyond 2010,<br />
however, the proportion of maintenance work is assumed to<br />
steadily increase up to 2 jobs per MW by 2020.<br />
The result is that by 2020, an estimated 2.25 million full time<br />
jobs would have been created by the development of solar<br />
power around the world. Over half of those would be in the<br />
installation and marketing of systems<br />
2013 59,701 223,880 46,234 329,815<br />
2014 77,294 289,852 64,029 431,175<br />
2015 100,364 376,366 88,370 565,100<br />
2016 130,727 490,226 121,673 742,625<br />
2017 170,834 640,629 167,268 978,731<br />
2018 224,017 840,065 229,764 1,293,846<br />
2019 294,815 1,105,555 315,561 1,715,931<br />
2020 389,438 1,460,391 412,920 2,262,749<br />
3. Costs and Investment<br />
The falling cost of PV cells and modules has been a crucial<br />
factor in the recent development of the technology. An<br />
indication of the potential for increased efficiency in the<br />
production of cells has been given in Part Two, together with<br />
the likely shift in favour of cheaper thin film technologies.<br />
In this scenario it is projected that the price per Wp for<br />
additional production sites will drop from today’s $ 1.69 to $ 1.12<br />
by 2010. Between 2010 and 2020 a further price decrease is<br />
anticipated. On the basis that the current progress ratio is<br />
maintained, an ex-works price of ¤ 2/Wp for crystalline<br />
modules will be achieved by 2010.<br />
In terms of delivered electricity, it is possible to make<br />
predictions for the output from grid-connected systems. The<br />
results are given for an average consumer in some of the major<br />
cities of the world (see Table 4.4). These show that by 2020 the<br />
cost of solar electricity in the most insolated regions - the<br />
Middle East, Asia, South America and Australasia - will have<br />
more than halved to as little as 10-13 S cents/kWh in the best<br />
conditions. This would make PV power competitive with typical<br />
electricity prices paid by end consumer households.<br />
Of equal importance in relation to falling costs is the level of<br />
investment in manufacturing capacity. Here the scenario<br />
32
Table 4.4: Fall in Price of PV electricity in selected cities 2000-2020<br />
Region<br />
kWh/<br />
( year*<br />
kWp )<br />
2005<br />
¤/<br />
kWh<br />
2010<br />
¤/<br />
kWh<br />
2015<br />
¤/<br />
kWh<br />
2020<br />
¤/<br />
kWh<br />
Berlin 900 0.40 0.30 0.26 0.19<br />
Paris 1000 0.36 0.27 0.24 0.18<br />
Washington 1200 0.30 0.23 0.20 0.15<br />
Hongkong 1300 0.28 0.21 0.18 0.13<br />
Sydney 1400 0.26 0.19 0.17 0.13<br />
Mumbai 1400 0.26 0.19 0.17 0.13<br />
Bangkok 1600 0.23 0.17 0.15 0.11<br />
Dubai 1800 0.20 0.15 0.13 0.10<br />
Figure 4.3: Global Investment in new PV prduction facilities<br />
80,000<br />
70,000<br />
60,000<br />
50,000<br />
40,000<br />
30,000<br />
20,000<br />
10,000<br />
Module Shipment worldwide [MW]<br />
Additional production capacity needed [MW]<br />
Investment production facilities [¤m]<br />
Source: PV 2010<br />
Investment Market Volume [¤m]<br />
Total investment [¤m]<br />
2005<br />
2010 2015 2020<br />
shows that the global value of the solar power market will<br />
have reached more than $ 70 billion by the end of the scenario<br />
period. Investment in new production facilities will reach $ 13.2<br />
billion by 2020. The overall market volume for PV systems will<br />
increase to $ 62 billion. Just over $ 9.6 billion of that value will<br />
be located in Europe, $ 8.7 billion in the Pacific region and $ 5.6<br />
billion in Africa.<br />
4. Carbon Dioxide Reductions<br />
A reduction in the levels of carbon dioxide being emitted into the<br />
world’s atmosphere is the most important environmental<br />
benefit from solar power generation. Carbon dioxide is the gas<br />
largely responsible for exacerbating the greenhouse effect,<br />
leading to the disastrous consequences of global climate change.<br />
Table 4.5: Value of regional PV market in Million ¤<br />
Year<br />
OECD<br />
Europe<br />
OECD<br />
N. America<br />
OECD<br />
Pacific<br />
Latin<br />
America<br />
East Asia<br />
South<br />
Asia<br />
China<br />
Middle<br />
East<br />
Africa ROW Total<br />
2003 625 220 798 129 39 52 98 23 77 14 2,075<br />
2004 1,001 247 890 157 49 57 128 27 90 15 2,661<br />
2005 1,073 278 1,043 191 62 69 150 31 105 17 3,019<br />
2006 1,258 378 1,272 234 78 87 183 47 133 21 3,691<br />
2007 1,477 515 1,553 285 99 110 224 71 168 25 4,527<br />
2008 1,734 702 1,896 348 126 140 274 107 214 31 5,572<br />
2009 2,037 956 2,317 425 159 178 334 160 271 38 6,875<br />
2010 2,348 1,169 2,616 540 217 242 456 204 357 50 8,199<br />
2011 2,708 1,431 2,955 687 297 331 622 259 471 66 9,827<br />
2012 3,123 1,752 3,339 873 405 452 850 329 620 87 11,830<br />
2013 3,602 2,144 3,773 1,110 553 617 1,160 419 818 115 14,311<br />
2014 4,154 2,624 4,262 1,410 755 842 1,584 532 1,078 151 17,392<br />
2015 4,790 3,211 4,814 1,792 1,030 1,149 2,161 676 1,420 199 21,242<br />
2016 5,521 3,927 5,435 2,276 1,406 1,567 2,948 858 1,871 262 26,071<br />
2017 6,359 4,801 6,133 2,889 1,917 2,137 4,020 1,090 2,463 345 32,154<br />
2018 7,321 5,865 6,916 3,665 2,612 2,912 5,478 1,383 3,240 454 39,846<br />
2019 8,421 7,160 7,793 4,647 3,556 3,965 7,458 1,753 4,260 597 49,610<br />
2020 9,679 8,734 8,775 5,886 4,838 5,395 10,147 2,220 5,596 785 62,054<br />
33
PART FOUR: THE <strong>SOLAR</strong> FUTURE<br />
As the world’s solar electricity production increases, there will<br />
be equivalent reductions in the amount of carbon dioxide<br />
thrown out into the atmosphere. As already explained, PV<br />
systems produce none of the harmful emissions resulting from<br />
fossil fuel power generation. Every solar system installed will<br />
therefore result in the avoidance of generation from a polluting<br />
source.<br />
At the same time, modern solar photovoltaic installations have<br />
a very good energy balance. The COc emissions resulting from<br />
manufacture, installation and servicing over the life-cycle of<br />
solar generators are “paid back” within the first three to four<br />
years of operation for crystalline technology. According to PV<br />
manufacturers this will further decrease. For thin film technologies<br />
energy pay back times of less than one year are<br />
realistic.<br />
Figure 4.5: Annual global CO 2 savings [million tonnes]<br />
180<br />
160<br />
140<br />
120<br />
100<br />
80<br />
60<br />
40<br />
20<br />
2005 2010 2015<br />
2020<br />
The benefit to be obtained from carbon dioxide reductions in a<br />
country’s energy mix is dependent on which other generation<br />
method or energy use solar power is replacing. Where off-grid<br />
systems replace diesel generators, they will achieve COc savings<br />
of about 1 kg per kilowatt hour. Due to their tremendous<br />
inefficiency, the replacement of a kerosene lamp will lead to<br />
even larger savings - up to 350 kg per year from a single 40Wp<br />
module, equal to 25 kg COc per kWh. In the consumer<br />
applications and remote industrial markets, on the other hand,<br />
it is very difficult to identify exact COc savings per kilowatt<br />
hour. As already explained, over the whole scenario period it<br />
was therefore estimated that an average of 0.6 kg COc would be<br />
saved per kilowatt hour of output from a solar generator. This<br />
approach is quite conservative, so higher COc savings may well<br />
be possible.<br />
Cumulative carbon dioxide savings from solar electricity<br />
generation between 2000 and 2020 will reach a level of 664<br />
million tonnes, equivalent to two-thirds of Germany’s COc<br />
emissions in 2000 (or almost as much as the total emissions<br />
from Canada or Brazil).<br />
External costs of Electricity Generation<br />
The external costs to society incurred from burning fossil fuels or<br />
from nuclear generation are not included in most electricity<br />
prices. These costs have both a local and a global component, the<br />
latter mainly related to the eventual consequences of climate<br />
change. There is uncertainty, however, about the magnitude of<br />
such costs, and they are difficult to identify. A respected<br />
European study, the “Extern E” project, has assessed these costs<br />
for fossil fuels within a wide range, consisting of three levels:<br />
• Low: $ 4.3/tonne COc<br />
• Medium $ 20.7 - 52.9/tonne COc<br />
• High: $ 160/tonne COc<br />
Taking a conservative approach, a value for the external costs of<br />
carbon dioxide emissions from fossil fuels could therefore be in<br />
the range of $ 10-20/tonne COc.<br />
The assessment above concludes that solar power reduces<br />
emissions of COc by an average of 0.6 kg/kWh. The resulting<br />
average cost avoided for every kWh produced by solar energy<br />
will therefore be in the range of 0.25 - 9.6 U cents/kWh. These<br />
external costs must be taken into account when comparing<br />
solar systems with other energy sources.<br />
5. Regional Development<br />
The development of the PV market is expected to vary from<br />
region to region around the world. The overall pattern of the<br />
scenario is that while the OECD regions, especially the US, Japan<br />
and Europe, will dominate the global market up to 2010, after<br />
that much faster development is expected to take place in other<br />
regions, especially South Asia and Africa. By 2020 installed PV<br />
capacity in the OECD regions will have fallen to less than half<br />
the world total (see Figures 4.6-4.8).<br />
Figure 4.6: World solar power market by region 2003<br />
OECD<br />
Pacific<br />
39%<br />
2003<br />
Latin America 6%<br />
East Asia 2%<br />
South Asia 2%<br />
China 4%<br />
Middle East 1%<br />
Africa 3%<br />
ROW 1%<br />
By 2020 the Solar Generation scenario shows that the<br />
worldwide expansion of PV would be reducing annual COc<br />
emissions by 169 million tonnes. This reduction is equivalent to<br />
the emissions from all 45 million cars currently operating in<br />
Germany, or the entire COc emissions from the Netherlands.<br />
OECD<br />
N-America 11%<br />
OECD<br />
Europe<br />
31%<br />
34
Figure 4.7: World solar power market by region 2010<br />
OECD Europe<br />
OECD<br />
Pacific<br />
34%<br />
Latin America 6%<br />
East Asia 2%<br />
South<br />
Asia 8%<br />
The European Union’s current target, part of a broader strategy<br />
for renewable energy, is to reach at least 3 GWp of installed PV<br />
power by the year 2010. This scenario demonstrates that this<br />
goal can be exceeded and a capacity of almost 5 GWp in Europe<br />
by 2010 is possible.<br />
OECD<br />
N-America<br />
8%<br />
2010<br />
China 5%<br />
Middle<br />
East 1%<br />
Africa 4%<br />
ROW 1%<br />
Reasons for this optimism include the fact that the PV market<br />
in Germany grew by 56% between 2002 and 2003. This<br />
demonstrates the impressive growth rates which can be<br />
triggered by clearly defined and attractive support mechanisms<br />
such as the German “feed-in tariff” offering fixed premium<br />
prices for renewable energy output.<br />
PREMIUM FEED-IN TARIFFS<br />
Figure 4.8: World solar power market by region 2020<br />
OECD Pacific 14%<br />
OECD<br />
N-America<br />
5%<br />
OECD<br />
Europe<br />
16%<br />
ROW 2%<br />
Africa 10%<br />
Middle East 3%<br />
2020<br />
OECD Europe 31%<br />
China 14%<br />
Latin America 8%<br />
East<br />
Asia<br />
7%<br />
South<br />
Asia<br />
21%<br />
The major driving forces behind the future growth of PV<br />
capacity in each of the most important regions is described<br />
below, together with the conclusions reached in the scenario.<br />
Since the first edition of Solar Generation in 2001 other<br />
European countries have also implemented various incentive<br />
programmes, mostly based on premium tariffs and in some<br />
cases combined with investment subsidies. Spain, Austria, Italy<br />
and Luxembourg have all introduced incentive schemes for<br />
solar electricity, some more successfully than others. Spain<br />
revised its support scheme for solar electricity, which is mainly<br />
based on a premium feed-in tariff, and Italy is about to do so,<br />
also adopting a premium feed-in tariff for solar electricity.<br />
Luxembourg has a combination of feed-in tariff and investment<br />
support, resulting in the highest per capita installed PV capacity<br />
in the world. Greece is also planning to introduce a solar<br />
electricity programme in the near future.<br />
The situation in Europe differs from Japan, which has<br />
experienced a similar solar boom to that in Germany. PV<br />
systems in Japan are mainly sold as part of new houses, offering<br />
the advantage that the costs can become part of the home<br />
mortgage. This system is also possible because the Japanese<br />
construction industry is dominated by a very few large<br />
companies offering standardised houses with standardised PV<br />
systems. By contrast, the construction industry in Germany and<br />
other European countries is much more diverse and the houses<br />
more customer tailored.<br />
Looking at the growth in different European markets over the<br />
past few years it has become evident that premium feed-in<br />
tariffs are the most appropriate tool for creating an eventual<br />
self-sustaining solar electricity market. The development of a<br />
large number of substantial solar electricity markets will be<br />
essential for the long term stability of the European solar<br />
electricity market and for lowering the risk attached to today’s<br />
focus on the German market. A strong demand side in the<br />
European PV market is crucial in order to provide the basis for a<br />
strong and expanding industry. If an installed capacity of 4.7<br />
GWp by the end of 2010 is to be achieved, it must therefore be a<br />
strategic goal to establish a feed-in tariff (full cost rates) for<br />
solar electricity at a European Union level.<br />
35
PART FOUR: THE <strong>SOLAR</strong> FUTURE<br />
The EPIA Road Map<br />
The European Photovoltaic Industry Association (EPIA),<br />
representing the majority of the European PV industry, published<br />
a new road map in 2004. This manifesto outlines the European<br />
PV industry’s priorities for achieving the objectives of the<br />
European Union in relation to installed PV capacities. EPIA has<br />
devised a programme of specific actions which the European<br />
industry, in collaboration with other key stakeholders from the<br />
research, policy, finance, electricity, construction and other<br />
sectors, should adopt in order for Europe to capitalise on the<br />
global PV market.<br />
The EPIA road map highlights the key obstacles and issues that<br />
must be resolved before PV can contribute substantially both to<br />
European and global energy supply. It is intended to serve as a<br />
guide for the European industry, including research priorities, up<br />
to 2010 and beyond, and as a framework for political action to<br />
help realise solar electricity’s potential to become a major<br />
contributor to electricity generation during this century.<br />
(www.epia.org)<br />
CASE STUDY: <strong>SOLAR</strong> <strong>GENERATION</strong> IN GERMANY<br />
Germany is currently the key player in the European PV market.<br />
As a result of the support provided by the Renewable Energy<br />
Law, together with the 100,000 roofs programme (available<br />
until mid 2003), the average annual growth rate between 2000<br />
and 2005 is expected to be 30%. Following the conclusion of the<br />
roofs programme in 2003, however, the annual growth rate is<br />
assumed to drop to 25% between 2006 and 2009 and to 20%<br />
between 2010 and 2020.<br />
Table 4.6 summarises the findings of a case study on Germany<br />
in which we looked at the potential increase (at five year<br />
intervals) in installed capacity, as well as electricity generation,<br />
carbon savings, jobs created and the total value of the PV<br />
market. The results show that the electricity output from PV<br />
generation could reach 3.2 TWh by 2010. This is equivalent to<br />
the output of a centralised coal-fired power plant. By 2015 solar<br />
electricity would cover more than 1.5% of Germany’s electricity<br />
demand and by 2020 more than 3.5%. The cumulative installed<br />
capacity would reach 18,477 MW by 2020.<br />
Within the next 20 years the German PV industry could create<br />
80,000 jobs in installation, service and maintenance alone. If<br />
all the modules were manufactured in Germany itself this<br />
would create up to 50,000 additional jobs.<br />
Government policy and programmes<br />
Following a 1,000 roofs programme in the 1990s, the 100,000<br />
roofs programme was introduced in 1999, a programme that<br />
provided low interest loans for the purchase of PV systems. By<br />
itself, this programme had a limited success, and the solar<br />
boom in Germany only started with the introduction of the<br />
Renewable Energy Law in April 2000, which provided premium<br />
tariffs for solar electricity. Until mid 2003 the 100,000 roofs<br />
programme and the premium tariff system operated in parallel.<br />
After the ending of the 100,000 roofs programme, the feed-in<br />
tariff was revised at the beginning of 2004 in order to<br />
compensate for the fact that low interest loans were no longer<br />
available. These new and higher premium feed-in tariffs<br />
triggered an even stronger solar electricity boom in Germany.<br />
Estimates for new capacity expected to be installed during<br />
2004 range up to 300 MWp.<br />
Apart from the attractive feed-in tariff payments there are<br />
several factors responsible for the success of this support<br />
scheme.<br />
• The level of the feed-in tariff is high enough to make solar<br />
electricity a viable choice for the investor.<br />
• The utility is obliged to buy solar electricity at the fixed tariff.<br />
• The extra costs for solar electricity are not paid by the state but<br />
by all electricity customers, resulting in a very limited additional<br />
financial burden (in 2003 the extra cost per household was ¤12).<br />
• The system favours the installation of high quality solar<br />
electricity units and the owner has a strong incentive to both<br />
maintain the system and maximise energy output for at least 20<br />
years.<br />
• The tariff is fixed for 20 years, which means security of planning<br />
for investors.<br />
• At the beginning of each year the feed-in tariff is reduced by 5%,<br />
but only for solar electricity systems newly installed that year. For<br />
existing systems the tariff remains the same. This feature aims to<br />
reflect the expected price decrease in solar electricity and provides<br />
an important incentive for the PV industry to reduce its<br />
costs.<br />
• The support scheme has led to financial pay back periods of<br />
between 13 and 15 years, leaving the owner with a surplus after<br />
20 years.<br />
If the Solar Generation scenario is to be realised then the feedin<br />
tariffs available under the Renewable Energy Law, need to be<br />
maintained until 2020 in order to avoid a collapse of the solar<br />
Table 4.6: Solar market in Germany to 2020<br />
Year MW MWh tCOc<br />
Market Volume<br />
in dm<br />
Jobs<br />
2003 139 347,500 208,500 473 4,265<br />
2005 320 806,900 484,140 953 9,900<br />
2010 644 3,288,096 1,972,858 1,404 19,869<br />
2020 2,604 18,316,491 10,989,895 3,076 80,380<br />
Total 2000 t0 2020 18,477 15,016,932 66,964,140<br />
36
OECD Pacific<br />
PV market. The tariff should decrease annually in relation to<br />
progress in reducing production costs. This phased programme<br />
should lead to a self-sufficient market and much lower costs for<br />
PV installations.<br />
An export market will also become increasingly important for<br />
the expanding PV industry in Germany, and will be vital to<br />
maintain the market development assumed in this scenario. In<br />
March 2001 a new export initiative was launched by German<br />
PV manufacturers and dealers, coordinated by the Fraunhofer<br />
Institute for Solar Energy Systems. The aim of this initiative is<br />
to provide better information and develop new mechanisms to<br />
expand the use of off-grid applications.<br />
Japan offers by far the largest and most developed PV market in<br />
this region. The Japanese target is to reach almost 4.8 GWp<br />
installed capacity by the year 2010. Since 2001 the market has<br />
grown by 75%, a growth rate based on a strong national PV<br />
support programme in which the residential sector plays an<br />
important role. Japan also has a clear policy of linking domestic<br />
demand to an expanding industrial sector. Alongside this<br />
regional leader, a smaller but increasingly important market is<br />
expected to develop in Australia. The scenario shows that, with<br />
annual growth rates on a substantial but realistic level, the<br />
region will eventually become the strongest market in the<br />
world.<br />
CASE STUDY: <strong>SOLAR</strong> <strong>GENERATION</strong> IN AUSTRALIA<br />
Australia has the potential to develop its own large solar PV<br />
industry and become a significant force in the Asia Pacific<br />
region. In the 1980s Australia led the world both in research<br />
and development and installed capacity of PV. Due to a lack of<br />
federal or state government support and a meaningful policy<br />
framework, this position was lost, but against the background<br />
of government action in Japan and Germany to create a PV<br />
market, Australia now has the opportunity to rebuild.<br />
Table 4.7: Cumulative installed PV power in Australia by sub-market<br />
Sub-market /<br />
application<br />
31<br />
Dec.<br />
1992<br />
kWp<br />
31<br />
Dec.<br />
1993<br />
kWp<br />
31<br />
Dec.<br />
1994<br />
kWp<br />
31<br />
Dec.<br />
1995<br />
kWp<br />
31<br />
Dec.<br />
1996<br />
kWp<br />
31<br />
Dec.<br />
1997<br />
kWp<br />
31<br />
Dec.<br />
1998<br />
kWp<br />
31<br />
Dec.<br />
1999<br />
kWp<br />
31<br />
Dec.<br />
2000<br />
kWp<br />
31<br />
Dec.<br />
2001<br />
kWp<br />
31<br />
Dec.<br />
2002<br />
kWp<br />
31<br />
Dec.<br />
2003<br />
kWp<br />
off-grid domestic 1,560 2,030 2,600 3,270 4,080 4,860 5,960 6,820 9,110 10,960 12,140 13,590<br />
off-grid non<br />
domestic<br />
grid connected<br />
distributed<br />
grid connected<br />
centralized<br />
5,760 6,865 8,080 9,380 11,520 13,320 15,080 16,360 17,060 19,170 22,740 26,060<br />
5 20 30 80 200 850 1,490 2,390 2,800 3,400 4,630<br />
20 20 320 630 650 650 650 850 1,350<br />
Total 7,320 8,900 10,700 12,700 15,700 18,700 22,520 25,320 29,210 33,580 39,130 45,630<br />
Notes: 1. Grid connected centralized systems include flat plate and concentrator PV power stations connected both to main and to diesel grid systems, with their own substation.<br />
These include several large building rooftop systems. 2. A variety of small modules (< 40 Wp) are also used extensively around Australia, typically for consumer appliances and lighting.<br />
Table 4.8: Solar market in Australia to 2020<br />
Year MW MWh tCOc<br />
Market Volume<br />
in US$m<br />
Jobs<br />
2003 7 28,266 16,960 25 201<br />
2005 9 52,290 31,374 32 289<br />
2010 107 436,751 262,051 270 3,303<br />
2020 2,597 13,214,057 7,928,434 3,540 79,786<br />
Total 2000 t0 2020 9,331 46,947,838 28,168,703<br />
37
PART FOUR: THE <strong>SOLAR</strong> FUTURE<br />
Renewable Remote Power Generation Program<br />
The Renewable Remote Power Generation Program was established to<br />
support a reduction in diesel-based electricity generation by providing<br />
up to 50% of the capital costs of off-grid renewable energy installations.<br />
Recently it was extended to “fringe-of-grid”, and selected large projects<br />
will be able to claim up to 70% of their costs. PV makes up 91% of the<br />
installed capacity. The amount allocated to water pumping is limited<br />
to 5% of the total funds provided to each state. Seven RRPGP Programs<br />
are currently operating in five states, with an eighth, the Indigenous<br />
Community Support Program (Bushlight), managed federally across<br />
several states.<br />
Program funds total AUS$ 264 million and are allocated on the basis of<br />
the relevant diesel fuel excise paid in each state or territory by public<br />
generators in financial years 2000/01 to 2003/4. By the end of 2003<br />
AUS$ 25.5 million had been allocated to small projects and a further<br />
AUS$ 14.7 million to major projects. AUS$ 5.9 million had also been<br />
allocated to industry support activities, including test facilities,<br />
standards and certification. By the end of 2003, 2.13 MWp of PV had<br />
been installed in small systems and a further 0.28 MWp in utilityoperated<br />
diesel grid systems. Although the program extends to 2009/<br />
10, it is likely the funds will have been exhausted by then. Currently<br />
some rural communities have difficulty finding matching funding.<br />
Photovoltaic Rebate Program<br />
The PVRP initially provided AUS$ 31 million over a three and a half year<br />
period to meet up to half the PV system capital costs for both grid and<br />
off-grid installations. Although it was recently extended with another<br />
AUS$ 5.8 million, the program will finish by the end of 2004 or mid<br />
2005.<br />
In 2003, 1,025 systems (1.37 MWp) were installed, with AUS$ 6.03<br />
million allocated in rebates. This brought the program total to more<br />
than 4,800 systems (5.4 MWp), with rebates of AUS$ 26.4 million.<br />
Mandatory Renewable Energy Target<br />
A national review of the MRET was conducted in 2003 and among its<br />
recommendations were the following most relevant to PV:<br />
• that the 9,500 GWh target for 2010, maintained until 2020, be<br />
changed to increase to 20,000 GWh by 2020.<br />
• that the shortfall charge be indexed to the Consumer Price Index<br />
from 2010 onwards.<br />
• that the deeming time for PV systems with a rating not more than<br />
10 kW be extended from 5 to 15 years.<br />
• that the eligible threshold for PV generation capacity be increased<br />
from 10 kW to 100 kW<br />
• that a review be undertaken to determine how further<br />
consideration can be given to special assistance for the Australian<br />
PV industry, either through enhancement of MRET or other<br />
measures.<br />
However, in its 2004 Energy Paper the government ruled out any<br />
increases to the size or duration of the target, and no reference was<br />
made to the other recommendations.<br />
Solar Cities<br />
Announced in the 2004 Energy Paper, the Solar Cities program will<br />
provide AUS$ 75 million for three urban areas to directly support<br />
uptake of PV and solar hot water, as well as energy efficiency and<br />
efficient pricing signals. These arrangements would include time-ofday<br />
pricing, interval metering and cost-reflective buy-back<br />
arrangements for electricity. They aim to capture the benefits of PV in<br />
matching peak demand, thus reducing transmission and generation<br />
costs.<br />
Expressions of interest will be called in late 2004, with selection of the<br />
Solar Cities some time after that. However, although this program<br />
should provide valuable information for the PV industry, it is not a<br />
suitable replacement for (an ongoing) PVRP, as it focuses on only three<br />
regions, will not start until 2006-7, runs for only about seven years and<br />
will not provide long term national market transformation.<br />
Policy Outlook<br />
With the PVRP to be terminated, the recommendations of the MRET<br />
Review unlikely to be implemented and the Solar Cities program<br />
providing only limited localised support, the RRPGP will be the only<br />
significant market development program operating in Australia.<br />
However, it applies only to off-grid and fringe-of-grid systems, and the<br />
federal government plans to remove excise on diesel fuel, making it<br />
hard to compete with diesel generators. It is likely therefore that the<br />
Australian PV industry will enter a slump, affecting local installation<br />
more than manufacturing, since in 2003, 64% of locally manufactured<br />
cells and 49% of modules were exported.<br />
What the industry needs is long-term market support to provide<br />
certainty. Current policies are likely to result in a boom/bust cycle.<br />
Research into the capability of PV to reduce exposure to peak loads on<br />
the distribution network and exposure to peak generation prices is<br />
needed. The industry development and employment creation potential<br />
needs to be recognised, especially for exports. Administrative barriers<br />
are not particularly problematic. The most significant barrier to<br />
market expansion is high capital cost.<br />
The Role of Utilities<br />
The attitudes of electricity retailers and grid network operators<br />
(DNSPs) to PV vary. Although most are generally supportive, dealing<br />
with small systems is not cost-effective, and sometimes given low<br />
priority. Some DNSPs have high barriers to entry, such as connection<br />
costs that are much higher than the costs they actually incur, while<br />
others provide connection (including metering) for free. Some retailers<br />
will not reimburse system owners for electricity exported to the grid (in<br />
excess of imports) and claim all Renewable Energy Certificates (RECs),<br />
while others pay more for exported than for imported electricity and<br />
guarantee to pay the system owner the market price for all RECs<br />
(currently offering AUS$ 37/MWh).Some research is currently being<br />
carried out into the benefits that PV has for DNSPs and retailers in<br />
terms of reducing exposure to peak loads on the distribution network<br />
and exposure to peak generation prices. It is hoped that the Solar Cities<br />
program will help quantify these benefits.<br />
The Australian PV Industry<br />
Cell production increased in 2003 from 20.5 to 26.3 MWp and module<br />
production from 7 to 9.6 MWp. Cell production capacity also increased<br />
to 33.5 MWp by the end of 2003, with a further 5 MWp capacity in<br />
concentrator systems.<br />
BP Solar currently operates a 35 MWp facility in Sydney, and plans to<br />
expand this to 40 MWp in 2004/05. Origin Energy is currently building<br />
a $ 20 million 5 MW manufacturing plant in South Australia using<br />
Australian National University developed Sliver® cell technology. If it<br />
meets design objectives it will be expanded to 25 MW. Sliver® cells are<br />
long, narrow, highly efficient and bifacial and enable up to 12-fold<br />
(92%) savings in silicon feedstock and 25-fold (97%) savings in wafers<br />
needed per MW of module production. Because of these advantages<br />
they will significantly reduce the costs of PV.<br />
Pacific Solar had plans to build a 20 MW Crystalline Silicon on Glass PV<br />
factory in 2005, but decided to move it to Germany because of the lack<br />
of a local market.<br />
In 2003, 64% of cells and 49% of modules were exported, while around<br />
30% of modules installed in Australia were imported. The industry has<br />
a net value of around AUS$ 164.8 million. This is made up of AUS$ 95.1<br />
million from the domestic market, AUS $ 106.26 from exports, but less<br />
AUS$ 36.56 for imports of wafers and module components. These<br />
values do not include education, R&D, ongoing operation and<br />
maintenance or BOS exports.<br />
38
the Australian PV industry. This figure could be even higher if<br />
the manufacturers also focused on exports.<br />
In August 2004 the Australian PV industry released its own PV<br />
Road Map. This includes targets and strategies for the different<br />
PV market sectors, and with overall targets for 2010 and 2020 in<br />
terms of installed capacity, employment, market value and COc<br />
abatement. These differ somewhat from the global <strong>Greenpeace</strong>/<br />
EPIA Scenario, for example where specific Australian<br />
assumptions have been taken for the level of carbon reduction.<br />
Government policy and programmes<br />
Australian PV Market Status<br />
Installed capacity has increased from 7.3 MWp in 1992 to 45.6<br />
MWp in 2003, with 6.5 MWp installed during 2003 (4.8 MW offgrid,<br />
1.7 MW on-grid). Installations are dominated by off-grid<br />
applications (87% of the total), with 57% industrial and 30%<br />
residential. The cumulative total to 2003 is made up of off-grid<br />
domestic (30%), off-grid non domestic (57%), grid-connected<br />
distributed (10%) and grid-connected centralised (3%). The size<br />
of systems installed through government support programmes<br />
(see page 38) have remained steady, with grid-connected<br />
systems averaging around 1.5 kWp and off-grid systems around<br />
1.1 kWp. Some larger systems are being installed.<br />
Off grid systems include a 56 kWp system installed at the<br />
remote Aboriginal community of Bulman in 2002 at a cost of<br />
AUS$ 0.9 million and a 225 kWp system installed at a national<br />
park tourist facility in Kings Canyon in 2003 at a cost of<br />
AUS$ 2.9 million.<br />
There are currently three main market development<br />
programmes provided by the government for PV in Australia:<br />
the Renewable Remote Power Generation Program (RRPGP), the<br />
Photovoltaic Rebate Program (PVRP) and the Mandatory<br />
Renewable Energy Target (MRET). The latter sets a national<br />
requirement for power companies to source an increasing<br />
proportion of their electricity from renewable energy. Some<br />
regional authorities provide top-up funds. A Solar Cities<br />
program, announced in June 2004, is expected to begin in<br />
2005.<br />
The Jurisdictional Regulators in the states of New South Wales,<br />
Victoria and South AustraliaB have released rulings stating that<br />
new meters on non-market generatorsC must be able to<br />
measure positive and negative flows of electricity separately.<br />
However, despite this regulation, net metering may still be<br />
legal where all parties agree.<br />
If a system owner wishes to be rewarded for network support<br />
and reduced exposure to peak prices, they must be able to<br />
measure the gross flow of electricity to the grid at specific<br />
times, especially during peak demand. Net metering does not<br />
have this capability, and either interval metering or an inverter<br />
with separate monitoring or data download is required.<br />
Grid-connected systems include:<br />
• The Athletes’ Village which formed part of the Sydney 2000<br />
Olympics complex, now part of the new Sydney suburb of<br />
Newington at Homebush. All 665 permanent houses have 1 kW<br />
grid-connected systems.<br />
• Kogarah Town Square, a recent development of residential,<br />
commercial and retail spaces, public library and car parking, has<br />
a total of 165 kWp of grid-connected PV, made up of 148.6kWp of<br />
amorphous laminate, and 11.4kWp of transparent glass PV.<br />
• Singleton Solar Farm, a 400 kW array built in 1998.<br />
In the <strong>Greenpeace</strong>/EPIA scenario, concerted action by industry<br />
and government would lead to a strong solar PV industry in<br />
Australia, with an increase in production capacity to<br />
approximately 100 MWp by 2010. By 2020 the market volume<br />
would reach 2,500 MWp. Almost 53,000 jobs could be created in<br />
1. Independent Pricing and Regulatory Tribunal (IPART) in NSW; Victorian Essential Services Commission (VESC); Essential Services Commission (ESCOSA) of South Australia.<br />
2. Non-market generators must have their entire output purchased directly by the local retailer or by a customer located at the same connection point. Residential-scale renewable energy<br />
systems are classified as non-market generators.<br />
39
PART FOUR: THE <strong>SOLAR</strong> FUTURE<br />
Government Policy and Programmes<br />
In order for the ambitious target of 4.82 GWp by 2010 to be<br />
realised, appropriate policies must be put in place. Rapid<br />
expansion of PV installations in Japan has been made possible<br />
by a set of efforts by the government, PV manufacturers and<br />
utilities, including net metering schemes. Home applications<br />
have been playing an important role in the PV market in Japan,<br />
representing 90% of installations last year. The subsidy for<br />
home applications, however, has been decreasing and is<br />
scheduled to end in fiscal year 2005. If the promising home<br />
application market is to continue to flourish, either the current<br />
support scheme should be continued or a replacement devised.<br />
All retailers currently pay the same tariff for imported and<br />
exported electricity, except for Australian Inland Energy, which<br />
pays 1 cent more for export. Some retailers may only pay the<br />
wholesale rate for net export. Many of the retailers and<br />
Distributed Network Service Providers (DNSPs) are currently<br />
reviewing their grid-connect arrangements.<br />
One significant issue is that consumers currently pay a monthly<br />
figure of about $ 20 to support the programme, and further<br />
efforts must be made to reduce the cost of PV systems. Reaching<br />
a level of $ 5,000 per kWp would make the price acceptable to<br />
PV installers and could lead to a rapid expansion in home<br />
applications.<br />
CASE STUDY : <strong>SOLAR</strong> <strong>GENERATION</strong> IN JAPAN<br />
Japan is currently the world leader in PV applications and the<br />
EPIA/<strong>Greenpeace</strong> scenario expects this position to be<br />
maintained for a further 15 years. The success of Japan has been<br />
largely attributable to a focus on support for home applications,<br />
accounting for over 70% of the total installed capacity. If<br />
strengthened policies are put in place, the annual growth rate<br />
between 2005 and 2010 is expected to be 30%.<br />
Table 4.9 summarises the findings of the scenario for Japan,<br />
showing future prospects for installed capacity, electricity<br />
generated, avoided COc emissions, the total value of the PV<br />
market and job creation. Installed capacity is projected to reach<br />
well over 5 GWp by 2010, with electricity output of about 5 TWh.<br />
By 2020 it will have exceeded 30 TWh, covering 2.5% of Japan’s<br />
electricity demand and with an installed capacity of over 30<br />
GWp. Over the next 15 years the number of jobs created by the<br />
PV industry in installation and maintenance services would be<br />
more than 126,000.<br />
The Renewable Portfolio Standard enacted by the government<br />
in 2003 should be expanded from its current target of 1.35% by<br />
2010 in order to provide an incentive for increased use of solar<br />
energy. It should also differentiate between (more expensive)<br />
solar generation and other renewable sources such as biomass<br />
and wind.<br />
Overall, energy policy in Japan continues to focus on fossil fuels<br />
and nuclear energy. More attention needs to be given to the use<br />
of renewable energies, including solar, and clearer<br />
commitments made by the government for further expansion.<br />
Table 4.9: Solar market in Japan to 2020<br />
Year MW MWh tCOc<br />
Market Volume<br />
in US$m<br />
Jobs<br />
2003 223 529,400 317,640 757 6,868<br />
2005 321 1,117,592 670,555 956 9,892<br />
2010 1,260 4,958,027 2,974,816 2,748 38,715<br />
2020 4,085 32,568,550 19,541,130 4,826 126,263<br />
Total 2000 t0 2020 31,309 197,975,063 118,785,038<br />
40
OECD North America<br />
Growth rates envisaged in this scenario for the North American<br />
PV market are the most moderate in the industrialised world.<br />
This is a result of the energy policy adopted by the US<br />
government, which is not presently fostering the development<br />
of PV in a serious way. Even though solar irradiation and the<br />
operating conditions in the large North American land mass<br />
are extremely favourable to PV, growth rates are expected to be<br />
moderate. Canada does not play a significant role as yet, with a<br />
total installed capacity of 7 MWp and a growth in 2000 of just<br />
1.3 MWp.<br />
The importance of the US market for the global PV industry will<br />
therefore decrease if there is no shift in policy within the next<br />
few years. While the annual solar power markets in OECD<br />
Europe and OECD Pacific are expected to grow by 30% per year<br />
and exceed 8 GWp by 2020, the market in OECD North America<br />
will by then only be around 0.8 GWp. On the other hand, a<br />
change in the US approach, particularly over climate change,<br />
could dramatically improve future prospects.<br />
CASE STUDY:<br />
<strong>SOLAR</strong> <strong>GENERATION</strong> IN THE UNITED STATES<br />
Because of the key position of the US in the future solar PV<br />
market, two different scenarios have been calculated. The first<br />
assumes “business as usual”, with an annual growth rate of<br />
20% up to 2020. The second “take-off” scenario is based on the<br />
assumption that the US market will make a determined<br />
attempt to catch up with its European competitors.<br />
The first table below shows the expected outcome if the United<br />
States continues with its present lukewarm approach to PV<br />
support. As a result of serious budget cuts and repeated delays<br />
in PV support programmes, the annual growth rate is expected<br />
to remain at 20% throughout the scenario. If the US government<br />
doesn’t invest in PV, then the country’s market will be five<br />
times smaller in 2005 than the EU’s. By 2010 the US solar market<br />
would be even smaller than Germany’s. By 2020 the US would<br />
have a world market share of just 2%.<br />
If the US government decided to establish a nationwide support<br />
scheme similar to those operating in Germany or Japan, then a<br />
different market development would be possible (see Table<br />
4.11). This “take-off” scenario assumes that the US domestic<br />
market will develop along the lines of Europe, with an<br />
ambitious target for 3,500 MWp of cumulative capacity by 2010.<br />
To achieve this strong market growth is required, with the<br />
assumption that after 2010 the annual growth rate would be<br />
the same as in Europe. This dramatic development would have<br />
a serious impact on the world PV market. It would mean that<br />
half of the estimated world market volume would be installed<br />
in the USA, and the industry would create more than 220,000<br />
jobs.<br />
Government Policy and Programmes<br />
The conclusion of the scenario for US federal and state energy<br />
planners is that if the government decided to support the<br />
industry with a national programme, such as a reducing fixed<br />
rate tariff, then the market growth could be equal to that of<br />
Europe. The US PV industry would then be among the world<br />
leaders.<br />
Table 4.10: Solar market in the US to 2020 (business as usual)<br />
Year MW MWh tCOc<br />
Market Volume<br />
in US$m<br />
Jobs<br />
2000 22 41,940 72 86 660<br />
2005 55 658,810 365,535 164 1,688<br />
2010 136 1,724,086 893,494 299 4,200<br />
2015 339 4,414,975 2,207,225 551 10,451<br />
2020 843 11,110,766 5,476,208 1,017 26,006<br />
Table 4.11: Solar market in the US to 2020 (take-off scenario)<br />
Year MW MWh tCOc<br />
Market Volume<br />
in US$m<br />
Jobs<br />
2003 63 514,440 115,560 214 1,934<br />
2005 91 799,042 295,186 270 2,797<br />
2010 521 3,615,470 1,938,102 1,137 16,041<br />
2020 7,187 57,093,702 33,133,738 8,491 221,141<br />
Total 2000 t0 2020 30,209 239,422,451 136,257,233<br />
41
PART FOUR: THE <strong>SOLAR</strong> FUTURE<br />
South Asia<br />
The solar market in South Asia is dominated by India, both on<br />
the supply and demand side. A flourishing domestic PV<br />
industry has developed in the large Indian market, and there is<br />
long term experience of the technology. The high level of<br />
demand for electricity in those areas of the region which are<br />
not connected to the grid, coupled with a domestic PV industry<br />
and favourable operating conditions, offer excellent<br />
opportunities to tap the vast solar electricity potential. The<br />
most difficult issue is about how adequate financing is made<br />
available for PV systems to be installed in rural areas where per<br />
capita income is very low.<br />
CASE STUDY: <strong>SOLAR</strong> <strong>GENERATION</strong> IN INDIA<br />
The only country in Asia with a government department solely<br />
devoted to the promotion and support of renewable energy,<br />
India’s national energy policy is to achieve a 10% share of<br />
electricity from renewables by 2012.<br />
Various PV incentives have been introduced, including a 50%<br />
capital subsidy for solar home systems and subsidies of 50%<br />
and 67% respectively for isolated and grid-connected solar<br />
power projects which do not exceed a capital cost of $ 5.50/Wp.<br />
A solar lantern subsidy is also available of up to $ 42.<br />
The <strong>Greenpeace</strong>/EPIA scenario is based on an average growth<br />
rate between 2000 and 2020 of 35%. By 2020, the Indian PV<br />
market would have a market volume of more than $ 5 billion a<br />
year. If all the systems installed were manufactured in India<br />
itself this would add a further roughly 80,000 jobs to the<br />
112,870 expected to result from work on installation and<br />
maintenance.<br />
Government Policy and Programmes<br />
The Indian government needs to continue demonstrating its<br />
commitment to mainstream PV by providing incentives to<br />
developers and manufacturers of the technology. It should<br />
establish a nationwide support scheme with the aim of<br />
achieving equal market conditions throughout the country. The<br />
national agencies should also look towards attracting foreign<br />
investment either through independent power projects or<br />
public sector programmes designed specifically for PV. One<br />
further incentive would be the removal of all subsidies for fossil<br />
fuel technologies.<br />
East Asia<br />
The East Asian market, currently quite small, is still expected to<br />
be one of the key markets over the coming decades. Thailand<br />
will be an important player in this region.<br />
CASE STUDY: <strong>SOLAR</strong> <strong>GENERATION</strong> IN THAILAND<br />
The Thai government supports the development of renewables<br />
through its Energy Conservation Program. Financial incentives<br />
are provided through subsidy schemes, including a 50% grant<br />
towards the capital cost of rooftop PV systems during a pilot<br />
phase. The National Energy Policy Office and the Department of<br />
Energy Development and Promotion are also in the process of<br />
preparing a National Renewable Energy Policy which should<br />
specify priorities and further support measures.<br />
Total installed capacity of PV in Thailand is currently about 5<br />
MW, with just 1 MW installed during 2003. To build up a stable<br />
and self-supporting solar PV market by 2010 a support<br />
programme is therefore needed. The <strong>Greenpeace</strong>/EPIA scenario<br />
Table 4.12: Solar market in India to 2020<br />
Year MW MWh tCOc<br />
Market Volume<br />
in US$m<br />
Jobs<br />
2003 11 56,644 33,986 44 344<br />
2005 16 97,891 58,735 55 496<br />
2010 90 446,977 268,186 225 2,747<br />
2020 3,678 16,634,071 9,980,443 5,013 112,870<br />
Total 2000 t0 2020 11,792 54,225,040 32,535,024<br />
Table 4.13: Solar market in Thailand to 2020<br />
Year MW MWh tCOc<br />
Market Volume<br />
in US$m<br />
Jobs<br />
2003 3 10,563 6,338 13 104<br />
2005 8 27,016 16,209 26 233<br />
2010 34 159,678 95,807 86 1,047<br />
2020 685 3,421,923 2,053,154 933 21,046<br />
Total 2000 t0 2020 2,598 12,995,467 7,797,280<br />
42
is based on a target for 120 MW installed capacity by 2010. With<br />
a market growth rate of 35% between 2010 and the end of the<br />
scenario period, Thailand could become one of the most<br />
important PV markets in the East Asia region. Within ten years,<br />
this level of market development would create more than 1,000<br />
jobs in installation and maintenance. By 2020 more than<br />
20,000 jobs could be expected in installation and maintenance,<br />
with additional potential in manufacture and development.<br />
Government Policy and Programmes<br />
The Thai government should demonstrate its commitment to<br />
PV by providing incentives for developers and manufacturers.<br />
An essential element of this would be a law similar to India’s<br />
which removes all institutional, market and policy barriers to<br />
the operation of renewable projects, including PV. The Thai<br />
authorities should also investigate tapping foreign investment<br />
through private or public sector projects. One simple step<br />
would be to capitalise on the flourishing overseas tourism<br />
industry by ensuring that all resorts and hotels are supplied by<br />
solar electricity.<br />
Latin America<br />
CASE STUDY: <strong>SOLAR</strong> <strong>GENERATION</strong> IN ARGENTINA<br />
Although significant regional and seasonal differences exist,<br />
Argentina has a huge natural potential for solar energy use. The<br />
central region of the country has an insolation of about 1,600<br />
kWh/m2/year, an excellent resource compared with most<br />
regions of Europe. This potential remains largely untapped,<br />
however, with installed capacity presently around 5 MWp.<br />
So far, solar power use in Argentina has been mainly in isolated<br />
areas, for example for telecommunications, houses without<br />
electricity supply, water pumping, cathodic protection and sign<br />
posting. Rural electrification programs have been supported<br />
with funding from the World Bank and the Global Environment<br />
Facility. Despite activity in this area, however, there still<br />
remains a huge un serviced rural market.<br />
The Energy Department recently relaunched the rural<br />
electrification programme called PERMER (Renewable Energies<br />
Program for Rural Markets) funded by the World Bank and by<br />
subsidies from the GEF. The aim is to invest a total of $ 59<br />
million, with additional grants from the national and provincial<br />
governments.<br />
There has been no experience of PV installations connected to<br />
the grid in Argentinian cities. Regulatory barriers and the lack<br />
of specific incentives to promote solar power have so far<br />
inhibited this development. A pioneering effort to spread the<br />
technology among architects and designers was made at a 1999<br />
seminar in Buenos Aires, resulting in a design competition to<br />
develop examples of PV integration into buildings and urban<br />
spaces.<br />
In April 2001, <strong>Greenpeace</strong> unofficially connected the first<br />
photovoltaic generator to the grid in Argentina. This technically<br />
illegal installation sparked an ongoing discussion about the<br />
technological basis for a future national regulation allowing<br />
connection of small scale renewable energy-powered<br />
equipment to the grid.<br />
In the same year Argentina suffered a significant economic<br />
crisis, with an extraordinary depreciation of its currency,<br />
resulting in the costs of PV systems rising threefold. For this<br />
reason the scenario for Argentina, originally compiled before<br />
the economic crisis, has been changed. To build up a solid<br />
ongoing solar PV market in Argentina it is clear that a national<br />
support programme is needed.<br />
The <strong>Greenpeace</strong>/EPIA scenario is still based on a target of 90<br />
MWp of installed capacity by 2010. From then on, even with a<br />
moderate growth rate of 30% between 2010 and the end of the<br />
scenario period, the market in Argentina looks very promising.<br />
With solid development over the succeeding years, the country<br />
could achieve a 10% share of the Latin American market. Within<br />
ten years this would create more than 3,800 jobs in installation<br />
and maintenance. By 2020 more than 14,000 jobs could be<br />
expected in installation and maintenance, with additional<br />
potential in manufacture and development.<br />
According to the Argentinian Energy Department, 5% of the<br />
population is still without an electricity supply, representing<br />
about 1.8 million people or some 300,000 homes. At least 2,000<br />
rural schools are estimated to operate without electricity.<br />
Table 4.14: Solar market in Argentina to 2020<br />
Year MW MWh tCOc<br />
Market Volume<br />
in US$m<br />
Jobs<br />
2003 1 6,497 3,898 5 41<br />
2005 2 10,802 6,481 6 50<br />
2010 33 125,341 75,205 84 1,031<br />
2020 462 2,723,744 1,634,246 630 14,209<br />
Total 2000 t0 2020 1,912 10,802,924 6,481,754<br />
43
PART FOUR: THE <strong>SOLAR</strong> FUTURE<br />
Government Policy and Programmes<br />
A national regime for grid connected renewable systems,<br />
including net metering and low interest credit for home solar<br />
systems, is badly needed. This could be financed by switching<br />
current subsidies for nuclear power to solar systems. A national<br />
law needs to be passed in the National Congress to establish a<br />
target for 8% of national electricity to come from renewables by<br />
2013 - a target already included in the government’s<br />
International Action Plan presented at Renewables 2004 in<br />
Bonn. Clean energy projects such as solar PV should also be<br />
made a priority for CDM investment under the Kyoto Protocol<br />
mechanisms.<br />
China<br />
CASE STUDY: <strong>SOLAR</strong> <strong>GENERATION</strong> IN CHINA<br />
As a major fossil fuel generator, China has made a serious<br />
commitment towards exploiting its renewable energy<br />
resources. 80% of the Chinese population lives in rural areas,<br />
and 30 million people have no access to electricity. In 1998 the<br />
government announced the linking of three state agencies<br />
involved in renewable energy - the Ministry of Science and<br />
Technology, the State Development and Planning Commission<br />
and the State Economic and Trade Commission - to work<br />
together on a programme for New and Renewable Energy<br />
Development in China up to 2010. Included in their targets is for<br />
the equivalent output from 4.67 million tons of coal to be<br />
produced by solar energy.<br />
The same three organisations have also launched a PV<br />
programme know as the “Sunlight Program”. Operating until<br />
2010 this is expected to:<br />
• Upgrade the country’s manufacturing capacity<br />
• Establish large scale and PV-hybrid village power demonstration<br />
systems<br />
• Promote home PV projects for remote areas<br />
• Integrate grid-connected PV projects<br />
Besides these initiatives, a Global Environment Facility-World<br />
Bank renewables development programme is scheduled to<br />
support the installation of 200,000 solar home systems with a<br />
total capacity of 10 MW. China had already installed a<br />
generation capacity of about 42.5 MWp by the end of 2002,<br />
distributed as follows:<br />
Table 4.15: PV in China by application<br />
Rural electrification<br />
Telecommunications<br />
Consumer Goods<br />
Grid-connected systems<br />
Installed capacity<br />
by end of 2002<br />
31.0 MWpeak<br />
5.0 MWpeak<br />
6.0 MWpeak<br />
0.5 MWpeak<br />
Newly installed capacity in China during 2004 is expected to<br />
reach approximately 35 MWp. Within the programme “Song<br />
Dian Dao Xiang” (sending electricity to villages) alone, it is<br />
planned to install 100 - 150 MWp over the period 2005 to 2010.<br />
This programme is completely initiated and funded by the<br />
Chinese government.<br />
In parallel to this, the Chinese PV industry is also growing. At<br />
the 19th European Photovoltaic Solar Energy Conference and<br />
Exhibition in June 2004, 32 companies and organisations from<br />
China were represented. Three years before, only two<br />
companies were present.<br />
In the <strong>Greenpeace</strong>/EPIA scenario China is expected to produce a<br />
growth rate of about 30% over the next decade. This will rise to<br />
45% between 2010 and 2020.<br />
In 2020 the Chinese solar PV market could be the third largest<br />
in the world, creating nearly 230,000 jobs in installation alone.<br />
The total energy output in 2020 would be 31.3 TWh, the<br />
equivalent of 31 coal-fired power plants. This market development<br />
needs a strong and long-term support programme.<br />
Government Policy and Programmes<br />
As well as providing incentives to developers and manufacturers<br />
of solar PV systems, the Chinese government should introduce<br />
legislation which both encourages renewable energy sources<br />
and removes all institutional, market and policy barriers to the<br />
operation of PV projects. The Sunlight programme should be<br />
expanded in order to play a more important role. China should<br />
also look towards more pro-active involvement from foreign<br />
investors.<br />
Table 4.16: Solar market in China to 2020<br />
Year MW MWh tCOc<br />
Market Volume<br />
in US$m<br />
Jobs<br />
2003 25 152,750 91,650 98 770<br />
2005 44 255,125 153,075 150 1,348<br />
2010 181 948,115 568,869 456 5,560<br />
2020 7,444 31,370,752 18,822,451 10,147 228,450<br />
Total 2000 t0 2020 23,900 103,731,754 62,239,053<br />
44
PART FIVE<br />
WINNERS AND LOSERS IN THE<br />
<strong>SOLAR</strong> <strong>GENERATION</strong>
PART FIVE: WINNERS AND LOSERS IN THE<br />
<strong>SOLAR</strong> <strong>GENERATION</strong><br />
The rapid rise in the price of crude oil in 2004 and its subsequent<br />
knock on effect on conventional energy costs across the<br />
domestic and industrial sectors worldwide, has once again<br />
highlighted the urgent need for both industrialised and less<br />
developed economies to rebalance their energy mix. This hike<br />
in the oil price is not just the result of concerns about security of<br />
supply, but also of rapidly rising demand in the emerging<br />
economies in Asia, particularly China. Production of “cheap” oil<br />
can no longer expand at the same rate as the rise in demand. As<br />
such, higher oil prices - and subsequently, higher energy prices<br />
in general - are here to stay and world economies will have to<br />
adjust to meet this challenge in order to grow.<br />
It is in this climate of run away energy pricing, that those<br />
economies that have committed themselves to promoting the<br />
uptake of solar electricity are starting to differentiate<br />
themselves from those countries that have relied heavily or<br />
almost exclusively on conventional energy sources. There are<br />
clear signs that the next decade will seeing numerous countries<br />
having to rapidly reduce their dependence on imported oil and<br />
gas. This abrupt transition will particularly be accompanied by<br />
significant pain in those countries which have paid little<br />
attention so far to the role that solar electricity can play.<br />
However - on the positive side - there is still time for these<br />
economies to catch up if they now rapidly introduce innovative<br />
policies to promote solar electricity use.<br />
The speed with which the solar electricity sector is increasing<br />
its market share in those economies that have committed<br />
themselves to promote this clean power source, coupled with<br />
the transformation of its customers from power recipients to<br />
power generators, represents a revolution comparable to that in<br />
the telecommunications market over the past decade. Such<br />
industrial revolutions give rise to both winners and losers.<br />
The undisputed winners in such industrial revolutions are the<br />
customers who have access to greater choice. Other winners<br />
include the market players who recognise the potential of such<br />
an expanding market, and those who have committed<br />
themselves to investment in the sector.<br />
One of the main arguments heard from critics of solar electricity<br />
is that its costs are not yet competitive with those of<br />
conventional power sources. Clearly it is an essential goal for<br />
the solar industry to ensure that prices fall dramatically over<br />
the coming years and decades. However, there are many<br />
examples of innovative products and services where offering<br />
customer choice has led to their popular uptake at a price<br />
considerably higher than that previously available.<br />
Two examples of such innovative market entrants are mobile<br />
phones, offering a service at a far higher price than conventional<br />
fixed line networks, and bottled mineral water, a product which<br />
in the middle and higher price ranges costs more per litre than<br />
petrol. With the right product, therefore - offering customers<br />
the type of added value they are looking for, coupled with<br />
innovative marketing - technologies such as solar electricity<br />
should be able to compete with grid power in industrialised<br />
countries.<br />
The extension of customer choice in the electricity sector to<br />
embrace solar power, however, requires a commitment to<br />
creating an appropriate framework to allow consumers to<br />
access solar power in an efficient and cost-effective way.<br />
PREMIUM FEED-IN TARIFF FOR <strong>SOLAR</strong> ELECTRICITY<br />
On the support side, customers must not be penalised<br />
financially for making a choice to be supplied by solar<br />
electricity. In most industrial countries, conventional electricity<br />
is heavily subsidised, and the negative environmental impacts<br />
of its production are not reflected in the cost to end users.<br />
Changes to this system appear to be some way off and other<br />
mechanisms for supporting solar power must meanwhile be<br />
promoted.<br />
The rapid uptake of solar electricity in Germany has been the<br />
result of the introduction of a national feed-in tariff for solar<br />
electricity which offers customers an attractive price for selling<br />
their produced electricity to the utility grid. A crucial element<br />
of the German feed-in law is the fact that the tariff is set at the<br />
point of connection to the grid and this level is guaranteed for<br />
20 years. The fact that the lifetime of this tariff is clearly defined<br />
at the outset offers customers planning security which makes<br />
the installation of a solar electricity system so attractive. One<br />
other crucial aspect of the German approach is that the cost of<br />
the feed-in tariff is not paid by the government through a<br />
subsidy, but is rather financed by a small surcharge on all<br />
electricity users. This ensures that the scheme - once introduced<br />
with political support - is less likely to become a political<br />
football during times of budget reductions at the government<br />
level.<br />
The success of the German feed-in tariff model - which has<br />
resulted in the creation of a large number of new jobs in the<br />
solar electricity industry - is now being adopted in other<br />
countries in Europe. Extending such feed-in tariff mechanisms<br />
beyond Germany is a cornerstone of the European Photovoltaic<br />
Industry Association’s strategy for promoting the uptake of<br />
solar electricity in Europe. The simplicity of the feed-in tariff<br />
concept and its low administrative costs means that it is a<br />
highly effective and efficient tool for boosting the role of solar<br />
electricity in national energy mixes.<br />
GUARANTEED GRID ACCESS<br />
Given its major advantages for modern society, solar electricity<br />
should be given priority and guaranteed access to the grid. In<br />
many countries there is an enormous over-capacity in<br />
conventional electricity generation, with a range of power<br />
sources - from fossil fuels through to renewables - all jostling<br />
for the right to be fed into the grid. Solar electricity generators<br />
must be guaranteed automatic access, otherwise there is a risk<br />
that they will be squeezed out of the market completely. While<br />
instruments such as the European Union’s Directive on<br />
Renewable Electricity provide for priority access for solar<br />
power, this does not guarantee that solar generators will be<br />
able to sell the power which they produce. Given the still<br />
developing structure of the industry, it is crucial, if we are to<br />
46
achieve a sustainable market in solar electricity in the<br />
industrialised world, that such access guarantees are a foremost<br />
consideration.<br />
NEW MARKET OPPORTUNITIES<br />
Clearly, just as with other emerging technology markets,<br />
decisions are not without their associated financial risks. The<br />
clear upward trend of current market developments, however,<br />
points to major opportunities for both existing and new players<br />
in the solar electricity sector. The expanding list of companies<br />
and consortia currently formulating strategies for exploiting<br />
the solar market is evidence of this.<br />
For the market really to take off, however, the pioneers of<br />
yesterday who have evolved into the market leaders of today<br />
must be joined by a widening industrial base so that the whole<br />
sector can secure the business successes of tomorrow, the<br />
potential for which has been mapped out in this report.<br />
Entry into the solar electricity market is not the preserve of<br />
companies only active in the clean energy sector. Many of the<br />
leaders in the solar electricity industry were, and still are,<br />
leading lights in the “old” energy economy. These global players<br />
have taken on board the challenge to integrate a solar electricity<br />
business into a traditional energy production and retail<br />
structure. The sustained commitment of these companies will<br />
be appropriately rewarded if we create the right climate to<br />
ensure that the whole solar electricity business sector moves<br />
rapidly ahead.<br />
Against this, there are also potential losers in the energy<br />
industry. Amongst these are those companies that have<br />
continued to focus solely on conventional energy technologies.<br />
With no base or limited expertise available to them in the solar<br />
sector, it will become increasingly difficult for these companies<br />
to benefit from the expanding photovoltaics market. Its<br />
expected growth over the next few decades will rapidly<br />
enhance the role that this technology will play in the energy<br />
mix. For any organisation missing the boat, the consequences<br />
could be similar to those for data processing companies which<br />
failed to predict the impact that personal computers would<br />
have on every aspect of business and domestic life in the 1980s.<br />
Even once mighty blue chip companies such as IBM are still<br />
trying to recover from a lack of vision at a critical moment.<br />
GOVERNMENT AND INDUSTRY COMMITMENT<br />
Governments that have taken steps to broaden their energy<br />
supply base with an abundant clean technology such as<br />
photovoltaics will also be able to count themselves among the<br />
winners. Such diversification not only brings benefits in terms<br />
of greater security of energy supply but also leads to wider<br />
environmental benefits though the deployment of zeroemission<br />
technologies which, according to the predictions<br />
presented here, will make a significant impact on global COc<br />
emissions over the coming decades.<br />
At present, the nations of the industrialised world vary greatly<br />
in their commitment to solar electricity. While countries such<br />
as Germany and Japan, as well as others in Europe, have moved<br />
forward from discussion to implementing the necessary<br />
support schemes, others have actually cut back their solar<br />
electricity programmes. In the United States in particular, this<br />
could severely affect the ability of the national solar electricity<br />
industry to fulfil its promise as a global exporter providing for<br />
sustainable employment at home.<br />
Both industry and governments, however, will have to extend<br />
their differing commitments to the solar sector if the potential<br />
identified in this report is to be fully exploited. On the industry<br />
side, continuing and accelerated investment in the expansion<br />
of production facilities is needed in order to meet the demands<br />
of the market and to ensure that the cost, and ultimately the<br />
price of the technology, is brought down through production<br />
up-scaling and introduction of new manufacturing techniques<br />
and materials. On the government side, the commitment to the<br />
solar electricity sector in many countries needs to be extended.<br />
Besides the introduction of net metering and premium tariffs,<br />
building regulations need to be adapted to provide a greater<br />
incentive for the deployment of solar electricity systems in the<br />
built environment.<br />
Like every other industry, the solar electricity sector will only<br />
move forward if sufficient investment is committed to provide<br />
for its expansion. New sources of equity and debt financing<br />
need to be tapped. Such investment opportunities must attract<br />
new entrants to the sector from financial institutions which<br />
have been made aware of the potential of the solar electricity<br />
business. It is significant, for example, that investment in solar<br />
production and supply companies is being taken increasingly<br />
seriously by international investment analysts, while the<br />
influential Economist magazine has portrayed solar cells as<br />
part of a new “micropower” revolution.<br />
In summary, there is no doubt that the global electricity<br />
business will undergo a significant expansion over the next<br />
few decades. All indicators point in that direction. Solar power<br />
will certainly play an ever more significant role in the supply<br />
mix. However, the extent to which solar electricity will make its<br />
impact on that market will depend very much on ensuring that<br />
the potential winners in this business are made fully aware of<br />
the opportunities available.<br />
Those opportunities will only be realised if both industry and<br />
governments continue to strengthen their commitment to<br />
broadening the energy supply base and, through the<br />
deployment of solar electricity technologies, offering greater<br />
choice to customers. This will have the added effect of<br />
demystifying the energy process, offering individuals greater<br />
control over the provision of their electricity needs. This in itself<br />
constitutes a revolution in the energy market.<br />
47
“Renewables 2004” - June 2004<br />
The next generation gathers in Bonn to call on governments for a clean energy future!<br />
Credits<br />
Researcher and scenario analyst Johannes Stierstorfer<br />
Editor Crispin Aubrey<br />
<strong>Greenpeace</strong> Co-ordinator and scenario analyst Sven Teske, Dipl.-Ing.<br />
EPIA Coordinators Murray Cameron, Johannes Stierstorfer<br />
Design Bitter Grafik & Illustration, Hamburg<br />
With participation of:<br />
Masaaki Nakajima <strong>Greenpeace</strong> Japan<br />
John Coequyt and Kristin Casper <strong>Greenpeace</strong> USA<br />
Athena Ronquillo Blaesteros <strong>Greenpeace</strong> International /South East Asia<br />
Rosa Moreno <strong>Greenpeace</strong> International / Latin America<br />
Steve Sawyer <strong>Greenpeace</strong> International<br />
Catherine Fitzpatrick <strong>Greenpeace</strong> Australia Pacific<br />
Dr Rob Passey Consultant, Australia<br />
Printed on recycled paper<br />
European Photovoltalic Industry Association<br />
Avenue Charles Quint 124<br />
B-1083 Brussels<br />
Belgium<br />
T: +32-2-465 3884<br />
F: +32-2-468 2430<br />
Email: epia@epia.org<br />
www.epia.org<br />
<strong>Greenpeace</strong> International<br />
Ottho Heldringstraat 5<br />
1066 AZ Amsterdam<br />
The Netherlands<br />
T: +31 20 514 81 50<br />
F: +31 20 514 81 51<br />
Email: sven.teske@greenpeace.de<br />
www.greenpeace.org