offshore grids for wind power integration - Greenpeace
offshore grids for wind power integration - Greenpeace offshore grids for wind power integration - Greenpeace
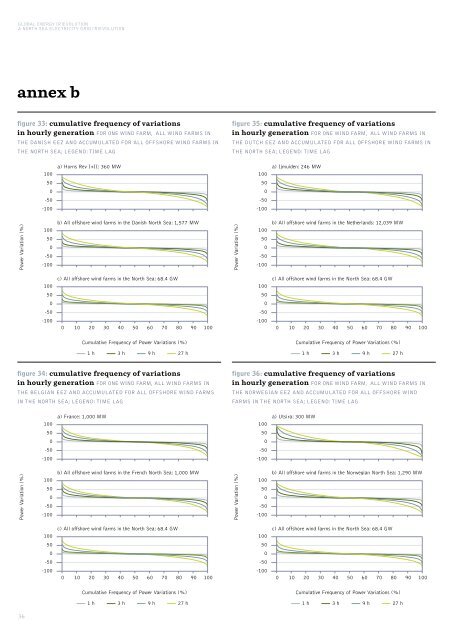
GLOBAL ENERGY [R]EVOLUTION A NORTH SEA ELECTRICITY GRID [R]EVOLUTION annex b figure 33: cumulative frequency of variations in hourly generation FOR ONE WIND FARM, ALL WIND FARMS IN THE DANISH EEZ AND ACCUMULATED FOR ALL OFFSHORE WIND FARMS IN THE NORTH SEA; LEGEND: TIME LAG figure 35: cumulative frequency of variations in hourly generation FOR ONE WIND FARM, ALL WIND FARMS IN THE DUTCH EEZ AND ACCUMULATED FOR ALL OFFSHORE WIND FARMS IN THE NORTH SEA; LEGEND: TIME LAG 100 50 0 -50 -100 a) Horns Rev I+II: 360 MW 100 50 0 -50 -100 a) Ijmuiden: 246 MW Power Variation (%) 100 50 0 -50 -100 b) All offshore wind farms in the Danish North Sea: 1,577 MW Power Variation (%) 100 50 0 -50 -100 b) All offshore wind farms in the Netherlands: 12,039 MW 100 50 0 -50 -100 c) All offshore wind farms in the North Sea: 68.4 GW 0 10 20 30 40 50 60 70 80 90 100 100 50 0 -50 -100 c) All offshore wind farms in the North Sea: 68.4 GW 0 10 20 30 40 50 60 70 80 90 100 Cumulative Frequency of Power Variations (%) Cumulative Frequency of Power Variations (%) 1 h 3 h 9 h 27 h 1 h 3 h 9 h 27 h figure 34: cumulative frequency of variations in hourly generation FOR ONE WIND FARM, ALL WIND FARMS IN THE BELGIAN EEZ AND ACCUMULATED FOR ALL OFFSHORE WIND FARMS IN THE NORTH SEA; LEGEND: TIME LAG figure 36: cumulative frequency of variations in hourly generation FOR ONE WIND FARM, ALL WIND FARMS IN THE NORWEGIAN EEZ AND ACCUMULATED FOR ALL OFFSHORE WIND FARMS IN THE NORTH SEA; LEGEND: TIME LAG 100 50 0 -50 -100 a) France: 1,000 MW 100 50 0 -50 -100 a) Utsira: 300 MW Power Variation (%) 100 50 0 -50 -100 b) All offshore wind farms in the French North Sea: 1,000 MW Power Variation (%) 100 50 0 -50 -100 b) All offshore wind farms in the Norwegian North Sea: 1,290 MW 100 50 0 -50 -100 c) All offshore wind farms in the North Sea: 68.4 GW 0 10 20 30 40 50 60 70 80 90 100 100 50 0 -50 -100 c) All offshore wind farms in the North Sea: 68.4 GW 0 10 20 30 40 50 60 70 80 90 100 Cumulative Frequency of Power Variations (%) Cumulative Frequency of Power Variations (%) 1 h 3 h 9 h 27 h 1 h 3 h 9 h 27 h 36
image WINDFARM. © LANGROCK/ZENIT/GP annex c table 6: statistics of power variations in the different countries THE TABLE SHOWS THE MAXIMUM UPWARD AND DOWNWARD STEP SIZE OF THE ACCUMULATED POWER GENERATION THAT ALTOGETHER IS EXCEEDED IN 10% OF THE CASES. THE INDICATED VALUES ARE PERCENTILES P5 AND P95. POWER INCREASE EXCEEDED IN 5% OF THE CASES Power as % of installed capacity P5 value POWER DECREASE EXCEEDED IN 5% OF THE CASES P95 value Case A: Selected wind farms 1h 3h 9h 27h BE 8.9% 22.4% 44.3% 62.3% DE 9.5% 22.9% 46.0% 64.1% GB 7.8% 20.2% 41.5% 59.7% 1h 3h 9h 27h BE -8.5% -21.4% -42.7% -62.1% DE -9.1% -22.6% -44.7% -64.9% GB -7.2% -18.7% -39.7% -58.2% Case B: Accumulated generation per country 1h 3h 9h 27h BE 8.5% 22.2% 44.7% 62.9% DE 6.9% 18.5% 40.3% 60.3% GB 5.1% 14.2% 33.1% 53.2% 1h 3h 9h 27h BE -8.2% -20.9% -42.6% -62.3% DE -6.5% -17.9% -38.9% -60.1% GB -4.9% -13.7% -31.3% -52.1% Case C: Accumulated output of all wind farms in the North Sea ALL WIND FARMS 1h 4.1% 3h 11.5% 9h 26.9% 27h 46.2% 1h 3h 9h 27h ALL WIND FARMS -4.0% -11.1% -26.2% -45.5% 37
- Page 1 and 2: a north sea electricity grid [r]evo
- Page 3 and 4: executive summary “IT IDENTIFIES
- Page 6 and 7: GLOBAL ENERGY [R]EVOLUTION A NORTH
- Page 8 and 9: GLOBAL ENERGY [R]EVOLUTION A NORTH
- Page 10 and 11: GLOBAL ENERGY [R]EVOLUTION A NORTH
- Page 12 and 13: GLOBAL ENERGY [R]EVOLUTION A NORTH
- Page 14 and 15: GLOBAL ENERGY [R]EVOLUTION A NORTH
- Page 16 and 17: GLOBAL ENERGY [R]EVOLUTION A NORTH
- Page 18 and 19: GLOBAL ENERGY [R]EVOLUTION A NORTH
- Page 20 and 21: GLOBAL ENERGY [R]EVOLUTION A NORTH
- Page 23 and 24: esults and analysis “THE TOTAL AG
- Page 25 and 26: image OFFSHORE WINDFARM, MIDDELGRUN
- Page 27 and 28: image WINDTURBINES AND ELECTRICITY
- Page 29 and 30: discussion and conclusions “ADDIN
- Page 31 and 32: image WINDTURBINE CONSTRUCTION YARD
- Page 33 and 34: image AERIAL VIEW OF SUBMARINE CABL
- Page 35: image WINDTURBINES BEING CONSTRUCTE
- Page 39 and 40: © GP/SOLNESS image THE TROLL A OFF
GLOBAL ENERGY [R]EVOLUTION<br />
A NORTH SEA ELECTRICITY GRID [R]EVOLUTION<br />
annex b<br />
figure 33: cumulative frequency of variations<br />
in hourly generation FOR ONE WIND FARM, ALL WIND FARMS IN<br />
THE DANISH EEZ AND ACCUMULATED FOR ALL OFFSHORE WIND FARMS IN<br />
THE NORTH SEA; LEGEND: TIME LAG<br />
figure 35: cumulative frequency of variations<br />
in hourly generation FOR ONE WIND FARM, ALL WIND FARMS IN<br />
THE DUTCH EEZ AND ACCUMULATED FOR ALL OFFSHORE WIND FARMS IN<br />
THE NORTH SEA; LEGEND: TIME LAG<br />
100<br />
50<br />
0<br />
-50<br />
-100<br />
a) Horns Rev I+II: 360 MW<br />
100<br />
50<br />
0<br />
-50<br />
-100<br />
a) Ijmuiden: 246 MW<br />
Power Variation (%)<br />
100<br />
50<br />
0<br />
-50<br />
-100<br />
b) All <strong>offshore</strong> <strong>wind</strong> farms in the Danish North Sea: 1,577 MW<br />
Power Variation (%)<br />
100<br />
50<br />
0<br />
-50<br />
-100<br />
b) All <strong>offshore</strong> <strong>wind</strong> farms in the Netherlands: 12,039 MW<br />
100<br />
50<br />
0<br />
-50<br />
-100<br />
c) All <strong>offshore</strong> <strong>wind</strong> farms in the North Sea: 68.4 GW<br />
0 10 20 30 40 50 60 70 80 90 100<br />
100<br />
50<br />
0<br />
-50<br />
-100<br />
c) All <strong>offshore</strong> <strong>wind</strong> farms in the North Sea: 68.4 GW<br />
0 10 20 30 40 50 60 70 80 90 100<br />
Cumulative Frequency of Power Variations (%)<br />
Cumulative Frequency of Power Variations (%)<br />
1 h 3 h 9 h 27 h<br />
1 h 3 h 9 h 27 h<br />
figure 34: cumulative frequency of variations<br />
in hourly generation FOR ONE WIND FARM, ALL WIND FARMS IN<br />
THE BELGIAN EEZ AND ACCUMULATED FOR ALL OFFSHORE WIND FARMS<br />
IN THE NORTH SEA; LEGEND: TIME LAG<br />
figure 36: cumulative frequency of variations<br />
in hourly generation FOR ONE WIND FARM, ALL WIND FARMS IN<br />
THE NORWEGIAN EEZ AND ACCUMULATED FOR ALL OFFSHORE WIND<br />
FARMS IN THE NORTH SEA; LEGEND: TIME LAG<br />
100<br />
50<br />
0<br />
-50<br />
-100<br />
a) France: 1,000 MW<br />
100<br />
50<br />
0<br />
-50<br />
-100<br />
a) Utsira: 300 MW<br />
Power Variation (%)<br />
100<br />
50<br />
0<br />
-50<br />
-100<br />
b) All <strong>offshore</strong> <strong>wind</strong> farms in the French North Sea: 1,000 MW<br />
Power Variation (%)<br />
100<br />
50<br />
0<br />
-50<br />
-100<br />
b) All <strong>offshore</strong> <strong>wind</strong> farms in the Norwegian North Sea: 1,290 MW<br />
100<br />
50<br />
0<br />
-50<br />
-100<br />
c) All <strong>offshore</strong> <strong>wind</strong> farms in the North Sea: 68.4 GW<br />
0 10 20 30 40 50 60 70 80 90 100<br />
100<br />
50<br />
0<br />
-50<br />
-100<br />
c) All <strong>offshore</strong> <strong>wind</strong> farms in the North Sea: 68.4 GW<br />
0 10 20 30 40 50 60 70 80 90 100<br />
Cumulative Frequency of Power Variations (%)<br />
Cumulative Frequency of Power Variations (%)<br />
1 h 3 h 9 h 27 h<br />
1 h 3 h 9 h 27 h<br />
36


