offshore grids for wind power integration - Greenpeace
offshore grids for wind power integration - Greenpeace
offshore grids for wind power integration - Greenpeace

Create successful ePaper yourself
Turn your PDF publications into a flip-book with our unique Google optimized e-Paper software.
GLOBAL ENERGY [R]EVOLUTION<br />
A NORTH SEA ELECTRICITY GRID [R]EVOLUTION<br />
<strong>offshore</strong> grid with, on average, one or two HVDC cable pairs <strong>for</strong> each<br />
interconnector 8 . In the long run, much higher capacities may be<br />
conceived as long as the market requires interconnector capacity <strong>for</strong><br />
trade during a sufficiently high fraction of time (<strong>for</strong> discussion see<br />
Section 4.3 on Drivers <strong>for</strong> Offshore Grid Development).<br />
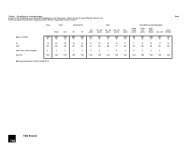
figure 19: load duration curves of <strong>offshore</strong> <strong>wind</strong> <strong>power</strong><br />
FOR ONE WIND FARM, ALL WIND FARMS OFF THE BRITISH EAST COAST AND<br />
ACCUMULATED FOR ALL OFFSHORE WIND FARMS IN THE NORTH SEA;<br />
DATA FOR 2004-2006<br />
For Germany and Belgium, 3 GW of <strong>offshore</strong> interconnector<br />
capacity is assumed. For the British east coast, 6000 MW is<br />
assumed. In Figure 18b) the capacity margin introduced by 3 GW<br />
of additional interconnector capacity is set in relation to the load<br />
duration curve of 26.4 GW of <strong>offshore</strong> <strong>wind</strong> <strong>power</strong> capacity in the<br />
German Bight. If required, this capacity is available to the market<br />
<strong>for</strong> levelling out <strong>power</strong> shortages as indicated in the figure but also<br />
<strong>for</strong> exporting surplus generation when prices are higher abroad.<br />
1,000<br />
0<br />
22,238<br />
a) London Array I-IV: 1000 MW<br />
b) All <strong>offshore</strong> <strong>wind</strong> farms off the British East Coast: 22,238 MW<br />
Figure 19b) illustrates the same relationship <strong>for</strong> the <strong>wind</strong> farms<br />
and interconnectors at the British east coast where the assumed<br />
interconnector capacity could introduce additional flexibility <strong>for</strong><br />
more than a quarter of the envisioned <strong>wind</strong> <strong>power</strong> capacity. In<br />
Belgium (Figure 20b), with the assumption of coastal<br />
interconnectors to the Netherlands and France, the available<br />
interconnector capacity at sea would be of the order of magnitude<br />
of the envisioned <strong>offshore</strong> <strong>wind</strong> <strong>power</strong> generation capacity.<br />
Power(MW)<br />
0<br />
68,400<br />
Exchange capacity from <strong>offshore</strong> interconnection<br />
c) All <strong>offshore</strong> <strong>wind</strong> farms in the North Sea: 68.4 GW<br />
0<br />
0 1,000 2,000 3,000 4,000 5,000 6,000 7,000 8,000<br />
Availability of Power [hours/year]<br />
figure 18: load duration curves of <strong>offshore</strong> <strong>wind</strong> <strong>power</strong><br />
FOR ONE WIND FARM, ALL WIND FARMS IN THE GERMAN BIGHT AND<br />
ACCUMULATED FOR ALL OFFSHORE WIND FARMS IN THE NORTH SEA;<br />
DATA FOR 2004-2006<br />
figure 20: load duration curves of <strong>offshore</strong> <strong>wind</strong> <strong>power</strong><br />
FOR ONE WIND FARM, ALL WIND FARMS IN THE BELGIAN EEZ AND<br />
ACCUMULATED FOR ALL OFFSHORE WIND FARMS IN THE NORTH SEA;<br />
DATA FOR 2004-2006<br />
1,600<br />
a) Bard I+II: 1,600 MW<br />
300<br />
a) Single <strong>wind</strong> farm Belgium: 300 MW<br />
0<br />
0<br />
26,418<br />
b) All <strong>offshore</strong> <strong>wind</strong> farms in the German Bight: 26,418 MW<br />
3,846<br />
b) All <strong>offshore</strong> <strong>wind</strong> farms in Belgium: 3,846 MW<br />
Power(MW)<br />
0<br />
Exchange capacity from <strong>offshore</strong> interconnection<br />
Power(MW)<br />
0<br />
Exchange capacity from<br />
<strong>offshore</strong> interconnection<br />
68,400<br />
c) All <strong>offshore</strong> <strong>wind</strong> farms in the North Sea: 68.4 GW<br />
68,400<br />
c) All <strong>offshore</strong> <strong>wind</strong> farms in the North Sea: 68.4 GW<br />
0<br />
0 1,000 2,000 3,000 4,000 5,000 6,000 7,000 8,000<br />
0<br />
0 1,000 2,000 3,000 4,000 5,000 6,000 7,000 8,000<br />
Availability of Power [hours/year]<br />
Availability of Power [hours/year]<br />
footnote<br />
8 IN PRACTICE, SOME OF THE EXISTING HVDC LINKS HAVE A HIGHER CAPACITY<br />
ALREADY, WHILE THE FIRST UPCOMING HVDC PROJECTS WITH VSC ARE BEING PLANNED<br />
FOR LESS THAN 1000 MW.<br />
26