Gov. 50 Introduction to Political Science Research Methods
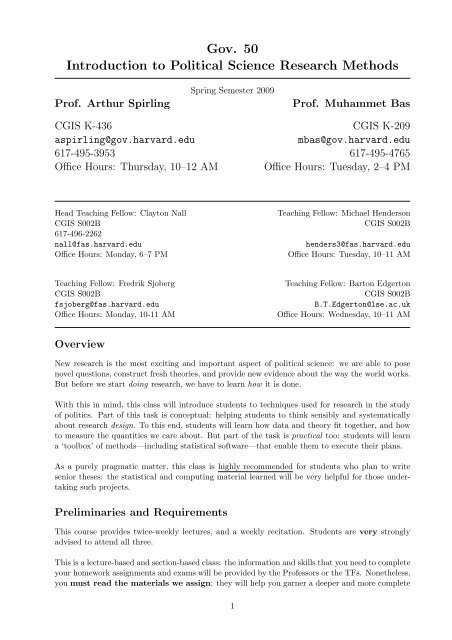
Gov. 50 Introduction to Political Science Research Methods
Gov. 50 Introduction to Political Science Research Methods
You also want an ePaper? Increase the reach of your titles
YUMPU automatically turns print PDFs into web optimized ePapers that Google loves.
<strong>Gov</strong>. <strong>50</strong><br />
<strong>Introduction</strong> <strong>to</strong> <strong>Political</strong> <strong>Science</strong> <strong>Research</strong> <strong>Methods</strong><br />
Prof. Arthur Spirling<br />
Spring Semester 2009<br />
Prof. Muhammet Bas<br />
CGIS K-436 CGIS K-209<br />
aspirling@gov.harvard.edu<br />
mbas@gov.harvard.edu<br />
617-495-3953 617-495-4765<br />
Office Hours: Thursday, 10–12 AM Office Hours: Tuesday, 2–4 PM<br />
Head Teaching Fellow: Clay<strong>to</strong>n Nall<br />
CGIS S002B<br />
617-496-2262<br />
nall@fas.harvard.edu<br />
Office Hours: Monday, 6–7 PM<br />
Teaching Fellow: Michael Henderson<br />
CGIS S002B<br />
henders3@fas.harvard.edu<br />
Office Hours: Tuesday, 10–11 AM<br />
Teaching Fellow: Fredrik Sjoberg<br />
CGIS S002B<br />
fsjoberg@fas.harvard.edu<br />
Office Hours: Monday, 10-11 AM<br />
Teaching Fellow: Bar<strong>to</strong>n Edger<strong>to</strong>n<br />
CGIS S002B<br />
B.T.Edger<strong>to</strong>n@lse.ac.uk<br />
Office Hours: Wednesday, 10–11 AM<br />
Overview<br />
New research is the most exciting and important aspect of political science: we are able <strong>to</strong> pose<br />
novel questions, construct fresh theories, and provide new evidence about the way the world works.<br />
But before we start doing research, we have <strong>to</strong> learn how it is done.<br />
With this in mind, this class will introduce students <strong>to</strong> techniques used for research in the study<br />
of politics. Part of this task is conceptual: helping students <strong>to</strong> think sensibly and systematically<br />
about research design. To this end, students will learn how data and theory fit <strong>to</strong>gether, and how<br />
<strong>to</strong> measure the quantities we care about. But part of the task is practical <strong>to</strong>o: students will learn<br />
a ‘<strong>to</strong>olbox’ of methods—including statistical software—that enable them <strong>to</strong> execute their plans.<br />
As a purely pragmatic matter, this class is highly recommended for students who plan <strong>to</strong> write<br />
senior theses: the statistical and computing material learned will be very helpful for those undertaking<br />
such projects.<br />
Preliminaries and Requirements<br />
This course provides twice-weekly lectures, and a weekly recitation. Students are very strongly<br />
advised <strong>to</strong> attend all three.<br />
This is a lecture-based and section-based class: the information and skills that you need <strong>to</strong> complete<br />
your homework assignments and exams will be provided by the Professors or the TFs. Nonetheless,<br />
you must read the materials we assign: they will help you garner a deeper and more complete<br />
1
understanding of the class.<br />
Recitations: your TFs will hold recitations in B09, the <strong>Science</strong> Center lab. Check the course<br />
announcements/lectures for announcements on allocations and updates <strong>to</strong> the schedule.<br />
We will have one midterm and one final exam. Your final grade will be based on a combination of:<br />
• Homeworks (30%)<br />
• Midterm exam (30%): The midterm exam is scheduled on Wednesday, April 1.<br />
• Final Exam (40%): The final exam will cover all the material discussed in class throughout<br />
the semester. The exam will take place on Monday, May 18 (Exam group 7)<br />
The midterm and final exam times are firm. Athletes and other representatives who have scheduling<br />
conflicts will have their coaches administer the exams (and this is for the athletes <strong>to</strong> arrange).<br />
If you miss an exam due <strong>to</strong> some unavoidable documented illness or circumstance, we will administer<br />
one make-up. No documentation, no grade.<br />
In general, the homeworks will be due one week after they are assigned. They must be turned<br />
in for grading on time and on paper (no emails!). Every day late results in a grade level drop:<br />
an A− becomes a B+, a B+ becomes a B and so on.<br />
Academic Honesty and Plagiarism: the University is very clear that students work is expected<br />
<strong>to</strong> be their own and that plagiarism is not <strong>to</strong>lerated. The same rules apply here: no assignment on<br />
which you receive a grade is <strong>to</strong> be collaborative—do not copy another individual’s work, answers<br />
or ideas. Disciplinary action follows for those that choose <strong>to</strong> disobey these instructions.<br />
Syllabus and Plan: in general, we hope that this syllabus is an accurate plan of the classes<br />
and material that follow. Occasionally, changes may need <strong>to</strong> be made: your responsibility as a<br />
student is <strong>to</strong> keep yourself informed of all such changes and <strong>to</strong> be aware of exam and homework<br />
dates. Ignorance will not be an acceptable excuse.<br />
Reading and Textbooks<br />
The following textbooks are either required or recommended. We have ordered them for the<br />
Coop, and you should also be able <strong>to</strong> find them via online sellers such as amazon.com. They will<br />
be available via the Widener Library course reserves system.<br />
Note that we won’t always go in exactly the same order that the textbooks organize the material,<br />
and we will include some information that none of the books cover in detail.<br />
Required<br />
Pollock, Philip H. 2009. The Essentials of <strong>Political</strong> Analysis, CQ Press, Washing<strong>to</strong>n DC. Third<br />
Edition. ISBN: 9780872896062.<br />
This is the main textbook for the class, and covers most of the <strong>to</strong>pics in a clear and concise<br />
manner. We refer <strong>to</strong> this text as ‘Pollock’ below.<br />
Pollock, Philip H. 2009. An SPSS Companion <strong>to</strong> <strong>Political</strong> Analysis, CQ Press, Washing<strong>to</strong>n DC.<br />
Third Edition. ISBN: 9780872896079.<br />
This the companion guide for the main textbook, and comes with an SPSS data CD. You will<br />
need that for examples and exercises. We refer <strong>to</strong> this text as ‘SPSS companion’ below.<br />
2
Shively, W. Phillips. 2009. The Craft of <strong>Political</strong> <strong>Research</strong>, Pearson-Prentice Hall, Upper Saddle<br />
River NJ. Seventh Edition. ISBN: 9780136029489.<br />
This book complements the main textbook and is particularly helpful for thinking about ‘theory’<br />
and ‘experiments’ in political science research. We refer <strong>to</strong> this text as ‘Shively’ below.<br />
Recommended<br />
Paul S. Gray and John B. Williamson and David A. Karp and John R Dalphin. 2007.<br />
The <strong>Research</strong> Imagination: An <strong>Introduction</strong> <strong>to</strong> Qualitative and Quantitative <strong>Methods</strong>. Cambridge<br />
University Press, New York. ISBN: 9780521705554.<br />
This book cover qualitative techniques well, and has chapters devoted <strong>to</strong> the comparative<br />
method. This may be particularly helpful <strong>to</strong>wards end of the class, and will be useful for students<br />
planning <strong>to</strong> learn more about methods in future. We refer <strong>to</strong> this text as ‘Imagination’ below.<br />
Neil J. Salkind. 2008. Statistics for People Who (Think They) Hate Statistics. Sage, Los Angeles.<br />
Third Edition. ISBN: 9781412951<strong>50</strong>0.<br />
Worth a look for those struggling with the quantitative aspects of the class, this text offers a<br />
more humorous and ‘chatty’ approach than Pollock. It doesn’t cover research planning and design<br />
in much detail though. We refer <strong>to</strong> this text as ‘Salkind’ below.<br />
Gary King and Robert Keohane and Sidney Verba. 1994.<br />
Designing Social Inquiry: Scientific Inference in Qualitative <strong>Research</strong>. Prince<strong>to</strong>n University Press,<br />
New Jersey. ISBN: 9780691034713.<br />
A helpful text for those considering case-study approaches, their strengths and limitations. We<br />
refer <strong>to</strong> this text as ‘KKV’ below.<br />
Software<br />
We will be using SPSS, a statistical package. The <strong>Science</strong> Center lab (where recitation is taught)<br />
has the software, and you can use a downloaded version while on campus (or set up a VPN for<br />
off-campus use). You will need KeyAccess software and SPSS 16 itself, which can be obtained here<br />
http://downloads.fas.harvard.edu/download<br />
Speak <strong>to</strong> your TF for more details.<br />
3
COURSE SCHEDULE<br />
1 Data and Theories<br />
Aims<br />
Upon completing this <strong>to</strong>pic you will understand. . .<br />
• what differentiates data types, and why it matters<br />
• what makes for a useful theory—that can actually be tested<br />
Notes<br />
Data enables political scientists <strong>to</strong> test their theories of the world: without it, we cannot make<br />
progress as a discipline. It comes in many different forms: from his<strong>to</strong>rical cases <strong>to</strong> numbers on<br />
a spreadsheet; from surveys of countries, <strong>to</strong> experiments in a labora<strong>to</strong>ry; from minutely detailed<br />
changes in individual participation behavior <strong>to</strong> huge events like revolutions and wars.<br />
Yet even before we gather our data, there are important prerequisites for our theories such that<br />
they are helpful <strong>to</strong> our understanding.<br />
Reading<br />
Shively, Ch 1 and 2.<br />
Pollock, Ch 2.<br />
Further Reading<br />
KKV, Ch 1.<br />
Imagination, Ch 1 and Ch 2.<br />
Salkind, Ch 6.<br />
Key words and concepts<br />
• types of analysis: quantitative, qualitative<br />
• types of data: categorical, nominal, ordinal, interval/continuous.<br />
• characteristics of theories: parsimony, falsifiability, testability.<br />
2 Measurement and Concepts<br />
Aims<br />
Upon completing this <strong>to</strong>pic you will understand. . .<br />
• the steps required <strong>to</strong> translate our theoretical ideas <strong>to</strong> ones that can be tested with real data<br />
• the problems inherent in this move, and how <strong>to</strong> guard against them<br />
4
Notes<br />
Before we begin our analysis, we need <strong>to</strong> be clear about what we are studying: voters? women?<br />
wars? countries? revolutions? A separate question concerns the ‘level’ at which we obtain data<br />
about our subjects of interest.<br />
Our theories tell us that certain characteristics matter for behavior: perhaps ‘maleness’ is important<br />
for vote choice, or societal ‘openness’ is important for racial harmony in a country. To<br />
proceed scientifically, we must find ways <strong>to</strong> measure these aspects of our subjects so that they can<br />
be compared. This can be difficult in practice—which can make our analysis prone <strong>to</strong> error.<br />
Reading<br />
Pollock, Ch 1 and 2.<br />
Shively, Ch 4 and 5.<br />
Further Reading<br />
Imagination, Ch 4.<br />
Salkind, Ch 6.<br />
Key Words and Concepts<br />
• subjects and data: the unit of analysis vs the level<br />
• testing our theories: theory <strong>to</strong> concept <strong>to</strong> measure<br />
• characteristics of subjects: variables and operationalization<br />
• variable ‘quality’: reliability, validity and measurement error<br />
3 Sampling and Surveys<br />
Aims<br />
Upon completing this <strong>to</strong>pic you will understand. . .<br />
• how and why we use samples <strong>to</strong> tell us about populations<br />
• various sampling methods<br />
• problems with survey methodologies that can throw our inferences awry<br />
Notes<br />
We often need <strong>to</strong> ask individuals about their political behavior: sometimes because decisions are<br />
secret or confidential (like voting), other times because decisions have not been documented (like<br />
who went <strong>to</strong> an anti-war protest). Unsurprisingly, this does not always produce satisfac<strong>to</strong>ry results;<br />
people forget, lie or are influenced by the person asking the question.<br />
Even if we accept the need <strong>to</strong> solicit the answers of individuals directly, we cannot usually gather<br />
data from every subject who might possibly be of interest: filling in a spreadsheet for every one of<br />
the three hundred million Americans would, for example, be both time consuming and expensive!<br />
5
Hence, we obtain information from a smaller, more manageable number who are representative of<br />
the whole. Working with only this data, we still attempt <strong>to</strong> conclude things about the behavior of<br />
everyone else in society. There are problems with this approach though, and we need <strong>to</strong> be careful<br />
about both selecting those we study and interpreting their responses.<br />
Reading<br />
Pollock, Ch 6.<br />
Shively, Ch 7.<br />
Further Reading<br />
Imagination, Ch 6 and 7.<br />
Key Words and Concepts<br />
• inference: from sample <strong>to</strong> population, from statistic <strong>to</strong> parameter<br />
• using representative subjects: (simple) random samples<br />
• sampling problems: self-selection and response bias<br />
• survey problems: observer and ‘Hawthorne’ effects, ‘der Kluge Hans’ effects, ‘Shy Tories’,<br />
‘Bradley’ effects<br />
4 Causality and Experiments<br />
Aims<br />
Upon completing this <strong>to</strong>pic you will understand. . .<br />
• why we care about causation, and how it differs from association<br />
• why it is so difficult <strong>to</strong> ‘prove’ causal statements are ‘true’: at a theoretical and empirical<br />
level<br />
• the importance of ‘control’ groups within ‘experiments’ in social science<br />
Notes<br />
It is easy <strong>to</strong> find variables that are related empirically: shoe size and height, ice cream sales and<br />
drowning, computer processing speed and the incidence of allergies among children. It is quite<br />
another matter <strong>to</strong> assert causation. To do so, we need <strong>to</strong> show that some ‘treatment’ (like an education<br />
program for high-schoolers, or the election of a particular President) produced an outcome<br />
(like a reduction in teenage pregnancies, or a war) that would not have occurred—or not <strong>to</strong> the<br />
same degree—otherwise.<br />
The latter point is very important and under-appreciated: we absolutely must have a comparable<br />
set of subjects—voters, women, citizens, countries, districts, schools—who did not receive the<br />
treatment (the policy change, the elec<strong>to</strong>ral system, the drug, the Federal funds). We also need <strong>to</strong><br />
rule out coincidences and other fac<strong>to</strong>rs that are causing both variables <strong>to</strong> change. Labora<strong>to</strong>ry-style<br />
experiments might be the preferred way <strong>to</strong> proceed, though these can be tricky in social science<br />
situations: luckily, there are other things we can do.<br />
6
Reading<br />
Pollock, Ch 4 and 5.<br />
Shively, Ch 6.<br />
Further Reading<br />
Imagination, Ch 12.<br />
KKV, Ch 4, 5 and 6.<br />
Key Words and Concepts<br />
• the fundamental problem: theory of causation cannot be observed<br />
• causation versus (spurious) associations and coincidences<br />
• understanding treatment: holding variables constant and the ‘control’ group<br />
• assessing policies: regression <strong>to</strong> the mean<br />
• approaches <strong>to</strong> causality: true experiments, ‘natural’ experiments—with and without premeasurment.<br />
5 Large-n <strong>Methods</strong> I: Descriptive Statistics<br />
Upon completing this <strong>to</strong>pic you will understand. . .<br />
• some straightforward ways <strong>to</strong> describe data: its average value, and the way that it is spread<br />
• that it is easy <strong>to</strong> mislead our audience—with even simple statistics!<br />
• how we think about the ‘distribution’ of the data, and the importance of the ‘normal’ distribution<br />
within that framework<br />
Notes<br />
Once we have our data, we need <strong>to</strong> describe it for both ourselves and others. Statisticians have<br />
standard ways <strong>to</strong> do this, and they concern the ‘average’ value of the data and the way it is ‘spread’.<br />
Depending on the nature of our data, we cannot meaningfully use certain measures—and even if<br />
we can, we have <strong>to</strong> be careful not <strong>to</strong> mislead our readers with our presentation choices!<br />
Statisticians also think about the way data ‘stacks up’—that is, the frequency of any particular<br />
value of a variable (like the curve that describes the number of people who are various heights,<br />
or the number of districts which have various percentages of Republican voters). One of the most<br />
important of these ‘distributions’ is the ‘normal.’<br />
Reading<br />
Pollock, Ch 2 and 6<br />
SPSS companion, Ch 1 and 2.<br />
Further Reading<br />
Salkind, Ch 2, 3 and 4.<br />
7
Key Words and Concepts<br />
• central tendency: mean, median, mode<br />
• spread: variance and central tendency<br />
• distributions: normal, Gaussian, bell-curve<br />
6 Large-n <strong>Methods</strong> II: Assessing Hypotheses<br />
Upon completing this <strong>to</strong>pic you will understand. . .<br />
• how our theory leads us <strong>to</strong> scientific statements that will be tested with our data<br />
• that we can never ‘prove’ our theory is true. . . but we can provide evidence that supports (or<br />
refutes!) it<br />
• how <strong>to</strong> use special distributions <strong>to</strong> weigh the evidence for the posited relationship versus the<br />
evidence for no relationship at all<br />
Notes<br />
Once we have our theory and our data, we want <strong>to</strong> use the latter <strong>to</strong> ‘test’ the former. In statistics,<br />
this operation take a very particular form that seems odd at first: we assess the evidence for our<br />
theory by thinking about the counterfactual of what we would see if we were wrong. That is, we<br />
look at possibility that there is no relationship between the variables of interest.<br />
It turns out that even though we can use well accepted and accurate techniques <strong>to</strong> do this, they<br />
still involve a judgement call from us (and our readers). We use special distributions <strong>to</strong> help us<br />
interpret our evidence here.<br />
Reading<br />
Pollock, Ch 3<br />
SPSS companion, Ch 6<br />
Shively, Ch 10.<br />
Further Reading<br />
Salkind, Ch 7, 8 and 9.<br />
Key Words and Concepts<br />
• hypotheses: the null and alternative<br />
• assessing the evidence for hypotheses: p-values and significance tests<br />
• cross tabulations and χ 2 (“ki square”) tests<br />
8
7 Large-n <strong>Methods</strong> III: t-tests for Comparison of Means<br />
Upon completing this <strong>to</strong>pic you will understand. . .<br />
• how <strong>to</strong> compare an observed sample mean <strong>to</strong> a hypothesized value<br />
• how <strong>to</strong> compare two means arising from paired data<br />
• how <strong>to</strong> compare two means from unpaired data<br />
Notes<br />
Once we know how <strong>to</strong> assess hypotheses in the abstract we will want <strong>to</strong> put that knowledge <strong>to</strong><br />
use. When dealing with data, we may be interested in drawing inferences from a single sample,<br />
or we may want <strong>to</strong> gather information about two different populations in order <strong>to</strong> compare them.<br />
Examples could be comparing the average income levels among men and women, or average growth<br />
rates among democracies versus au<strong>to</strong>cracies. This means we need <strong>to</strong> think about how <strong>to</strong> calculate<br />
test statistics from the data and how <strong>to</strong> evaluate our results. We will also find out what assumptions<br />
we need <strong>to</strong> make for our inferences <strong>to</strong> be valid.<br />
Reading<br />
Pollock, Ch 7 (pages 145 -152).<br />
SPSS companion, Ch 4 and 5.<br />
Further Reading<br />
Salkind, Ch 10 and Ch 11.<br />
Key Words and Concepts<br />
• t-statistic<br />
• signs test, Wilcoxon Signed-Rank test<br />
• one sided vs. two-sided tests<br />
8 Large-n <strong>Methods</strong> IV: Linear Regression<br />
Upon completing this <strong>to</strong>pic you will understand. . .<br />
• how <strong>to</strong> assess the relationship between two variables<br />
• the difference between correlation and regression, and the assumptions behind each<br />
• how <strong>to</strong> specify a regression model<br />
• how <strong>to</strong> interpret a regression coefficient<br />
• how <strong>to</strong> make predictions using results from a regression<br />
9
Notes<br />
Comparing the means of two populations was fun. What if we want <strong>to</strong> do more with our data? We<br />
will look at alternative ways <strong>to</strong> assess the association between two variables in paired data. We<br />
will start with correlation, which examines how closely large (or small) values of one variable are<br />
related <strong>to</strong> large (or small) values of another.<br />
When we want <strong>to</strong> assess causal claims, we need <strong>to</strong> think about the relationship between our dependent<br />
variable (the thing being caused) and independent variables (the things doing the causing).<br />
In the simplest form, we can use ‘regression’ techniques <strong>to</strong> examine the expected change in our<br />
dependent variable in response <strong>to</strong> an increase or decrease in our independent variable.<br />
Reading<br />
Shively, Ch 8.<br />
Pollock, Ch 8 (pages 170-187).<br />
SPSS companion, Ch 8.<br />
Further Reading<br />
Imagination, Ch 18 and Ch 19.<br />
Salkind, Ch 14 and Ch 15.<br />
Key Words and Concepts<br />
• correlation coefficient, regression coefficient, error term (residual)<br />
• assumptions of the linear regression (least squares estimation)<br />
• testing the significance of regression coefficients<br />
• prediction using regression results<br />
9 Large-n <strong>Methods</strong> V: Multiple Regression<br />
Upon completing this <strong>to</strong>pic you will understand. . .<br />
• how <strong>to</strong> use SPSS <strong>to</strong> estimate a multiple regression model<br />
• methods <strong>to</strong> assess goodness of fit<br />
• testing overall significance in multiple regression<br />
• how <strong>to</strong> make predictions using results from multiple regression<br />
Notes<br />
Our theories rarely specify a relationship between just two variables. Even when they do so, it is<br />
usually wise <strong>to</strong> control for confounding fac<strong>to</strong>rs by including other independent variables. In these<br />
series of lectures, we will see how we can extend the bivariate regression framework <strong>to</strong> incorporate<br />
multiple independent variables. We will also talk about how <strong>to</strong> test the significance of individual<br />
coefficients and the overall significance of the model, and how <strong>to</strong> evaluate goodness of fit in a given<br />
model. At the end of the lecture, we will discuss potential problems with the linear regression<br />
framework, and alternative methods that can be used in situations in which linear regression is not<br />
appropriate.<br />
10
Reading<br />
Shively, Ch 8.<br />
Pollock, Ch 8 (pages 187-197).<br />
SPSS companion, Ch 8<br />
Further Reading<br />
Salkind, Ch 15.<br />
Key Words and Concepts<br />
• R 2 (coefficient of determination), Adjusted R 2<br />
• F-statistic test for overall significance<br />
10 Small-N <strong>Methods</strong>: Case Studies and the Comparative <strong>Research</strong><br />
Strategy<br />
Upon completing this <strong>to</strong>pic you will understand. . .<br />
• how <strong>to</strong> make the most out of a single case<br />
• how <strong>to</strong> design a comparative study<br />
• how <strong>to</strong> select cases for analysis<br />
Notes<br />
Sometimes there exist relatively few cases of the phenomenon that we want <strong>to</strong> study. Or it could be<br />
that data are not available, or <strong>to</strong>o costly <strong>to</strong> collect, <strong>to</strong> conduct a large-N analysis. In those situations<br />
scholars use case studies or the comparative method for theory-building or testing hypotheses. Case<br />
study approach employs an in-depth analysis o a single case, while the comparative approach refers<br />
<strong>to</strong> the close examination of small number of cases for comparison. In these lectures, we will discuss<br />
merits of these two methods with several examples. We will also look at potential issues related <strong>to</strong><br />
these approaches such as selection bias and the “many variables, small-N” problem.<br />
Reading<br />
Shively, Ch 7.<br />
Further Reading<br />
Imagination, Ch 6 (pages 115-120) and Ch 15.<br />
KKV, Ch 4, Ch 5 and Ch 6.<br />
Key Words and Concepts<br />
• Mill’s method of difference and agreement<br />
• selection bias<br />
11


