Gosford City Council Historical Water Quality Review & Analysis
Gosford City Council Historical Water Quality Review & Analysis
Gosford City Council Historical Water Quality Review & Analysis

You also want an ePaper? Increase the reach of your titles
YUMPU automatically turns print PDFs into web optimized ePapers that Google loves.
RESULTS OF WATER QUALITY DATA ANALYSIS 3-11<br />
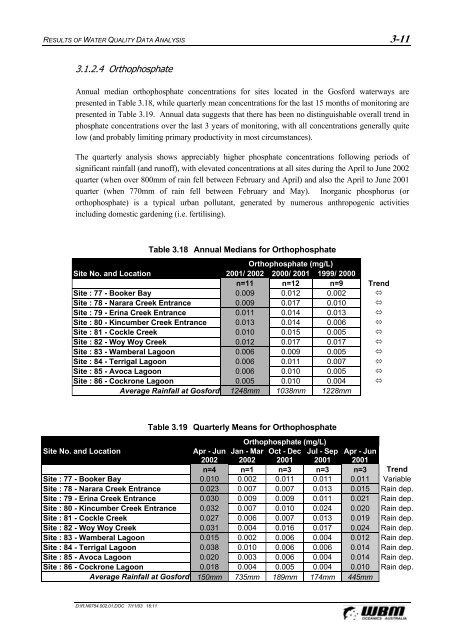
3.1.2.4 Orthophosphate<br />
Annual median orthophosphate concentrations for sites located in the <strong>Gosford</strong> waterways are<br />
presented in Table 3.18, while quarterly mean concentrations for the last 15 months of monitoring are<br />
presented in Table 3.19. Annual data suggests that there has been no distinguishable overall trend in<br />
phosphate concentrations over the last 3 years of monitoring, with all concentrations generally quite<br />
low (and probably limiting primary productivity in most circumstances).<br />
The quarterly analysis shows appreciably higher phosphate concentrations following periods of<br />
significant rainfall (and runoff), with elevated concentrations at all sites during the April to June 2002<br />
quarter (when over 800mm of rain fell between February and April) and also the April to June 2001<br />
quarter (when 770mm of rain fell between February and May). Inorganic phosphorus (or<br />
orthophosphate) is a typical urban pollutant, generated by numerous anthropogenic activities<br />
including domestic gardening (i.e. fertilising).<br />
Table 3.18 Annual Medians for Orthophosphate<br />
Orthophosphate (mg/L)<br />
Site No. and Location 2001/ 2002 2000/ 2001 1999/ 2000<br />
n=11 n=12 n=9 Trend<br />
Site : 77 - Booker Bay 0.009 0.012 0.002 <br />
Site : 78 - Narara Creek Entrance 0.009 0.017 0.010 <br />
Site : 79 - Erina Creek Entrance 0.011 0.014 0.013 <br />
Site : 80 - Kincumber Creek Entrance 0.013 0.014 0.006 <br />
Site : 81 - Cockle Creek 0.010 0.015 0.005 <br />
Site : 82 - Woy Woy Creek 0.012 0.017 0.017 <br />
Site : 83 - Wamberal Lagoon 0.006 0.009 0.005 <br />
Site : 84 - Terrigal Lagoon 0.006 0.011 0.007 <br />
Site : 85 - Avoca Lagoon 0.006 0.010 0.005 <br />
Site : 86 - Cockrone Lagoon 0.005 0.010 0.004 <br />
Average Rainfall at <strong>Gosford</strong> 1248mm 1038mm 1228mm<br />
Table 3.19 Quarterly Means for Orthophosphate<br />
Orthophosphate (mg/L)<br />
Site No. and Location<br />
Apr - Jun Jan - Mar Oct - Dec Jul - Sep Apr - Jun<br />
2002 2002 2001 2001 2001<br />
n=4 n=1 n=3 n=3 n=3 Trend<br />
Site : 77 - Booker Bay 0.010 0.002 0.011 0.011 0.011 Variable<br />
Site : 78 - Narara Creek Entrance 0.023 0.007 0.007 0.013 0.015 Rain dep.<br />
Site : 79 - Erina Creek Entrance 0.030 0.009 0.009 0.011 0.021 Rain dep.<br />
Site : 80 - Kincumber Creek Entrance 0.032 0.007 0.010 0.024 0.020 Rain dep.<br />
Site : 81 - Cockle Creek 0.027 0.006 0.007 0.013 0.019 Rain dep.<br />
Site : 82 - Woy Woy Creek 0.031 0.004 0.016 0.017 0.024 Rain dep.<br />
Site : 83 - Wamberal Lagoon 0.015 0.002 0.006 0.004 0.012 Rain dep.<br />
Site : 84 - Terrigal Lagoon 0.038 0.010 0.006 0.006 0.014 Rain dep.<br />
Site : 85 - Avoca Lagoon 0.020 0.003 0.006 0.004 0.014 Rain dep.<br />
Site : 86 - Cockrone Lagoon 0.018 0.004 0.005 0.004 0.010 Rain dep.<br />
Average Rainfall at <strong>Gosford</strong> 150mm 735mm 189mm 174mm 445mm<br />
D:\R.N0754.002.01.DOC 7/11/03 16:11