Biodiversity Strategy - Gosford City Council - NSW Government
Biodiversity Strategy - Gosford City Council - NSW Government Biodiversity Strategy - Gosford City Council - NSW Government
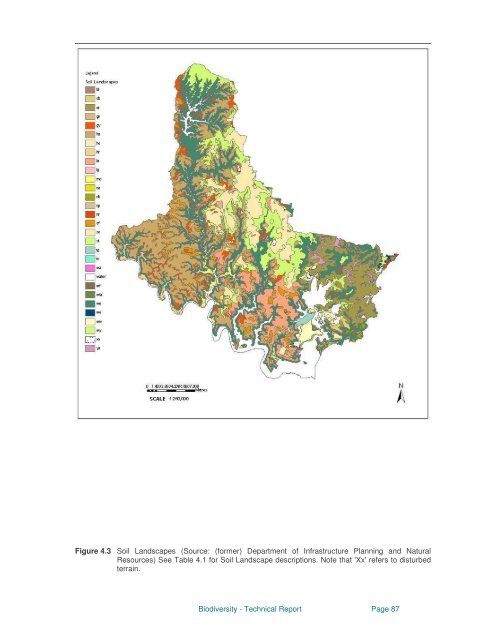
Figure 4.3 Soil Landscapes (Source: (former) Department of Infrastructure Planning and Natural Resources) See Table 4.1 for Soil Landscape descriptions. Note that 'Xx'refers to disturbed terrain. Biodiversity - Technical Report Page 87
A - 4.5 Climate Generally the climate of the LGA is mild in the coastal areas and slightly cooler in the plateau areas and valley areas. Climatic data has been obtained from the Bureau of Meteorology website. (http://www.bom.gov.au/climate/averages/). Mean maximum and minimum temperatures are shown from three weather stations Kulnura, Peats Ridge and Gosford (Horticultural Station) in Figure 2.4. The lowest mean daily average for Gosford was 4.5 0C and the highest mean daily average was 27.5 0C. Highest median monthly rainfall generally occurs in February and March and the lowest in July, August and September months. It is noted that this data was collected for Kulnura between 1951 to 1981, for Peats Ridge for 1981 to 2004 and for Gosford for 1916 to 2004. Prevailing winds are generally from the west and local topographical features will impact on rainfall and evaporation. For example the Katandra, Avoca and Bouddi hills have a NNE to SSW aspect and receive higher rainfall as they face the south-easterlies that bring coastal rainfall (Fisher 1997). Valley areas provide more shaded aspects with cool air drainage resulting in different vegetation communities such as the moist rainforest communities in the Matcham Holgate areas. Figure 4.4. Mean daily average maximum and minimum temperatures. Source: Commonwealth Bureau of Meteorology at http://www.bom.gov.au/climate/averages/. Biodiversity - Technical Report Page 88
- Page 39 and 40: Biodiversity - Technical Report Pag
- Page 41 and 42: A - 2.0 LEGISLATIVE CONTEXT The dev
- Page 43 and 44: Amendment Act 2004 Standard Instrum
- Page 45 and 46: areas within the Greater Metropolit
- Page 47 and 48: A - 2.3.2 Council Corporate Reporti
- Page 49 and 50: Biodiversity Toolbox The Commonweal
- Page 51 and 52: A - 2.4 Discussion of Comparable Pl
- Page 53 and 54: Biodiversity - Technical Report Pag
- Page 55 and 56: A - 2.6 References Australian Local
- Page 57 and 58: • Bushcare Program - ongoing •
- Page 59 and 60: A - 3.2 Appraisal of biodiversity p
- Page 61 and 62: Officer Table 3.2. Area of properti
- Page 63 and 64: and sub-communities and to provide
- Page 65 and 66: the Central Coast. The returned sur
- Page 67 and 68: Council received funding for develo
- Page 69 and 70: Council commissioned the Bush Stone
- Page 71 and 72: education and training opportunitie
- Page 73 and 74: of urban development applications w
- Page 75 and 76: Unmanaged cattle grazing can impact
- Page 77 and 78: Three public schools in the catchme
- Page 79 and 80: Milestone 5 - Monitoring and Report
- Page 81 and 82: A - 3.4 References Australian Museu
- Page 83 and 84: (see Figure 4. 3) which accounts fo
- Page 85 and 86: Newcastle and forms a major barrier
- Page 87 and 88: Mooney Mooney and Mangrove Creeks.
- Page 89: Aeolian Landscapes Beach Landscapes
- Page 93 and 94: Kangaroo, possums, flying squirrels
- Page 95 and 96: A - 4.9 Current Landuse Since the 1
- Page 97 and 98: State government is also preparing
- Page 99 and 100: A - 5.0 TERRESTRIAL BIODIVERSITY Th
- Page 101 and 102: Lily) was once relatively widesprea
- Page 103 and 104: Figure 5.1 Native vegetation commun
- Page 105 and 106: Biodiversity - Technical Report Pag
- Page 107 and 108: There have been few quantitative st
- Page 109 and 110: • Rainforest • Wetlands • Dun
- Page 111 and 112: Figure 5.5 Endangered ecological co
- Page 113 and 114: of streams for water quality purpos
- Page 115 and 116: Figures 5.5 - 5.7 Waratah (Telopea
- Page 117 and 118: A - 5.4 A - 5.4.1 Terrestrial Fauna
- Page 119 and 120: A - 5.4.3 Invertebrates There conti
- Page 121 and 122: A draft Recovery Plan has been prep
- Page 123 and 124: assumption that occupancy of a site
- Page 125 and 126: Variables such as ‘proportion of
- Page 127 and 128: Mount Kincumba to Bouddi NP and Cop
- Page 129 and 130: A - 5.7 References Anon (1996) 'Sev
- Page 131 and 132: Scotts D (1991) “Old-growth fores
- Page 133 and 134: A - 6.2 Aquatic Habitats A - 6.2.1
- Page 135 and 136: considered. This is true for all ri
- Page 137 and 138: this zone are isolated Casuarina gl
- Page 139 and 140: The Hawkesbury River The Hawkesbury
Figure 4.3 Soil Landscapes (Source: (former) Department of Infrastructure Planning and Natural<br />
Resources) See Table 4.1 for Soil Landscape descriptions. Note that 'Xx'refers to disturbed<br />
terrain.<br />
<strong>Biodiversity</strong> - Technical Report Page 87


