Observations of Water Quality - Gosford City Council
Observations of Water Quality - Gosford City Council
Observations of Water Quality - Gosford City Council

You also want an ePaper? Increase the reach of your titles
YUMPU automatically turns print PDFs into web optimized ePapers that Google loves.
Observation <strong>of</strong> <strong>Water</strong> <strong>Quality</strong> in Cockrone Lagoon on 13 March 2002<br />
Dr Joanne Wilson and Peter Evans<br />
Centre for Natural Resources<br />
Dept Land and <strong>Water</strong> Conservation<br />
Introduction<br />
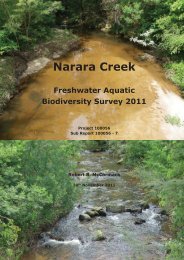
In early February 2001 Cockrone Lagoon was closed to the ocean with a<br />
water level <strong>of</strong> about 1.9m above mean sea level (see Figure 3). Heavy rainfall<br />
on the 4 th and the 5 th resulted in a rapid rise in lake level. The lagoon was<br />
opened by breaching the berm mechanically on 8 th February 2002 to prevent<br />
flooding <strong>of</strong> low-lying property. The opening was undertaken in accordance<br />
with <strong>Gosford</strong> <strong>Council</strong>'s Lagoons Opening Policy, (<strong>Gosford</strong> <strong>Council</strong>'s Coastal<br />
Lagoons Management Plan). The lake remained open to the ocean for about<br />
six tidal cycles before the beach berm reformed, once again closing the<br />
lagoon to the ocean on the 12 th February. The lake level then stabilised at<br />
about 1.2m above mean sea level (AHD). Four days later it was reported that<br />
the water became black and odorous and that a fish kill occurred.<br />
An inspection <strong>of</strong> the lagoon on the 13 th March 2002 was made to determine <strong>of</strong><br />
Draft<br />
the cause <strong>of</strong> this event, and to observe the general characteristics <strong>of</strong> the<br />
lagoon. It has been concluded that the likely cause <strong>of</strong> the fish kill was low<br />
dissolved oxygen levels due to the decomposition <strong>of</strong> extensive amounts <strong>of</strong><br />
macroalgae which were growing in the lagoon and which were killed when the<br />
lagoon emptied. The results <strong>of</strong> water quality testing carried out on<br />
13 th March 2002, and that recorded prior to, during, and after the opening<br />
event, are presented in this report.<br />
Methods<br />
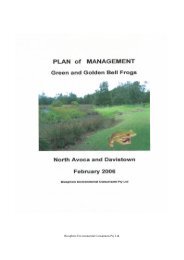
On 13 th March 2002, the lagoon was surveyed from a canoe for water quality<br />
and to make general observations. <strong>Water</strong> quality pr<strong>of</strong>iles (from the surface to<br />
the bottom) were recorded at five sites in the lake (entrance channel,<br />
stormwater channel, mid lake, algal mat and creek) (Figure 1). The following<br />
parameters were recorded using a Hydrolab Quanta multiparameter probe –<br />
pH, dissolved oxygen, temperature, and salinity.<br />
<strong>Water</strong> samples were taken from two sites in the lake (mid lake and creek) for<br />
identification and counts <strong>of</strong> phytoplankton, and total and inorganic nutrients<br />
(analysed by AWT Sydney). Samples for inorganic nutrient analysis were<br />
passed through a 0.45mm filter and frozen. Samples for algal identification and<br />
counts were kept cool and fixed with Lugol’s iodine.<br />
The Manly Hydraulics Laboratory, under contract to <strong>Gosford</strong> <strong>City</strong> <strong>Council</strong><br />
maintains a logging water level and water quality instrument at the seaward<br />
end <strong>of</strong> the Lagoon (see Figure 1). Information on lake level, pH, temperature,<br />
dissolved oxygen concentration and salinity was available, and data from 1<br />
October 2001 to 28 Feb 2002 (which includes the opening event and<br />
subsequent fish kill) was examined.<br />
1
Creek<br />
Algal Mat<br />
Mid Lake<br />
Stormwater<br />
Channel<br />
Draft<br />
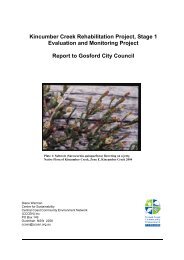
Figure 1: Cockrone Lagoon showing sites <strong>of</strong> water quality sampling and<br />
testing on 13 March 2002.<br />
Results<br />
General <strong>Observations</strong><br />
The deepest site recorded was close to the site <strong>of</strong> the water quality logger at<br />
the entrance channel with the ocean. The main body <strong>of</strong> the Lagoon was<br />
between 0.5-1.0m. A large amount <strong>of</strong> filamentous macroalgae identified as<br />
Cladophora sp (?) covered the bottom <strong>of</strong> the western portion <strong>of</strong> the Lagoon.<br />
These algae formed a floating mat approximately 4ha and 30-50cm thick in<br />
the far south western corner (Figure 1).<br />
<strong>Water</strong> <strong>Quality</strong><br />
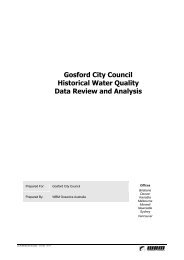
The results <strong>of</strong> water quality pr<strong>of</strong>iles at each site are shown in Figure 2. The<br />
salinity was ~22 ppt at all sites except at the algal mat which had trapped a<br />
layer <strong>of</strong> freshwater on the surface. Dissolved oxygen was very low in the lake<br />
with values less than 4mg/l recorded at all sites. The lowest dissolved oxygen<br />
was recorded in the creek (0.2-1.4 mg/l) and on the bottom at the entrance<br />
channel (0.3 mg/l). Temperature <strong>of</strong> the water was between around 23C in the<br />
lake body and around 25C in the creek. There was some stratification<br />
(layering) <strong>of</strong> the water column with lower <strong>of</strong> dissolved oxygen and higher<br />
temperature (approx 1C) in bottom waters at the entrance channel and the<br />
creek. Surface pH throughout the Lagoon ranged between 7.3-7.9, which is<br />
normal for these types <strong>of</strong> waters. However, the pH <strong>of</strong> bottom waters at the<br />
channel and creek was slightly acidic (Figure 2).<br />
The results <strong>of</strong> nutrient and algal analyses are shown in Table 1. The levels <strong>of</strong><br />
inorganic nutrients measured from both the mid lake and the creek are<br />
2
elatively low. However, the values for Total Nitrogen and Total Phosphorus<br />
at the mid lake site are very high compared to ANZECC guidelines (TN –<br />
0.35mg/l, TP – 0.035mg/l).<br />
Algal counts showed the phytoplankton consisted only <strong>of</strong> diatoms at this site<br />
and no blue green algal species were recorded.<br />
Table 1: Results <strong>of</strong> nutrient analysis <strong>of</strong> surface waters from Cockrone<br />
Lagoon 13 March 2002. (na = not applicable).<br />
Mid lake<br />
(unfiltered)<br />
Mid lake<br />
(filtered)<br />
Cockrone Creek<br />
(filtered)<br />
Nutrients<br />
Ammonia (NH3) (mg/l) na 0.015 0.02<br />
Nox (mg/l) na
values less than 2mg/l, which are not high enough to sustain life. These very<br />
low oxygen levels are presumably due to the decomposition <strong>of</strong> organic matter<br />
from the dead filamentous algae, which would consume most <strong>of</strong> the oxygen<br />
from the water.<br />
Draft<br />
4
0.0<br />
0 10 20 30 40 50<br />
Conductivity (mS/cm)<br />
0.5<br />
Depth (m)<br />
1.0<br />
1.5<br />
channel<br />
stormwater<br />
mid lake<br />
algal mat<br />
creek<br />
2.0<br />
0.0<br />
0.0<br />
0.5 1.0 1.5 2.0 2.5 3.0 3.5 4.0<br />
Dissolved Oxygen (mg/L)<br />
0.5<br />
Depth (m) Depth (m) Depth (m)<br />
1.0<br />
1.5<br />
channel<br />
stormwater<br />
midlake<br />
algal mat<br />
creek<br />
2.0<br />
22.5 23.0 23.5 24.0 24.5 25.0 25.5 26.0<br />
0.0<br />
Temperature ( o C)<br />
0.5<br />
1.0<br />
1.5<br />
2.0<br />
channel<br />
Stormwater<br />
midlake<br />
algal mat<br />
creek<br />
6.4 6.6 6.8 7.0 7.2 7.4 7.6 7.8 8.0<br />
0.0<br />
0.5<br />
1.0<br />
pH<br />
1.5<br />
2.0<br />
channel<br />
stormwater<br />
midlake<br />
algal mat<br />
creek<br />
Figure 2: <strong>Water</strong> quality pr<strong>of</strong>iles from 5 sites in Cockrone Lagoon,<br />
13 th March 2002.<br />
5
3.0<br />
2.5<br />
water height<br />
Depth (m)<br />
2.0<br />
1.5<br />
1.0<br />
0.5<br />
0.0<br />
-0.5<br />
40<br />
35<br />
Oct 01 Nov 01 Dec 01 Jan 02 Feb 02 Mar 02<br />
salinity<br />
Salinity (ppt)<br />
30<br />
25<br />
20<br />
15<br />
DO (mg/L)<br />
Temperature ( o C)<br />
10<br />
5<br />
18<br />
16<br />
14<br />
12<br />
10<br />
8<br />
6<br />
4<br />
2<br />
0<br />
32<br />
30<br />
28<br />
26<br />
24<br />
22<br />
20<br />
18<br />
16<br />
11<br />
10<br />
Oct 01 Nov 01 Dec 01 Jan 02 Feb 02 Mar 02<br />
dissolved oxygen<br />
Draft<br />
Oct 01 Nov 01 Dec 01 Jan 02 Feb 02 Mar 02<br />
temperature<br />
Oct 01 Nov 01 Dec 01 Jan 02 Feb 02 Mar 02<br />
pH<br />
pH<br />
9<br />
8<br />
7<br />
6<br />
Oct 01 Nov 01 Dec 01 Jan 02 Feb 02 Mar 02<br />
Figure 3: Surface water quality data from Cockrone Lagoon 1 st October 2001<br />
until 28 th February 2002. Logger located at entrance channel. Probe<br />
calibration dates are shown on x axis.<br />
6
Discussion<br />
Information gathered from both field observations and water quality testing<br />
indicate that Cockrone Lagoon is likely to be eutrophic ie there is an<br />
unsustainable load <strong>of</strong> nutrients entering the waterway. This conclusion is<br />
based on the excessive and persistent growth <strong>of</strong> filamentous algae, the<br />
occurrence <strong>of</strong> blue green algal blooms (Chris Carloss (GCC), pers comm)<br />
and, prior to the entrance opening, high dissolved oxygen values, which had a<br />
large diurnal range, and high pH values. The high values <strong>of</strong> oxygen and large<br />
diurnal fluctuations are due to the high biomass <strong>of</strong> algae fuelled by excess<br />
nutrients. During the day, the algae are photosynthesising producing large<br />
quantities <strong>of</strong> oxygen. During the night, the algal tissue is respiring and<br />
consuming oxygen. This results in very high values in late afternoon and very<br />
low values in the early morning. The pH in the lagoon was consistently very<br />
high at least since the beginning <strong>of</strong> October. High pH results from a complex<br />
chemical reaction that occurs in high oxygen environments. Thus both the<br />
dissolved oxygen and pH values indicate that the lagoon contained large<br />
biomass <strong>of</strong> algae since at least beginning <strong>of</strong> October 2001. Examination and<br />
analysis <strong>of</strong> logged data prior to this date is recommended so that the timing <strong>of</strong><br />
any changes in the water<br />
Draft<br />
quality parameters in the system can be identified<br />
After the entrance opened, the death and decomposition <strong>of</strong> much <strong>of</strong> the<br />
filamentous algae caused a low dissolved oxygen event and subsequent fish<br />
kill. Values for dissolved oxygen were still very low on 13 th March almost one<br />
month after the fill kill. Low dissolved oxygen will create conditions suitable<br />
for release and recycling <strong>of</strong> nutrients stored in the sediments, thus<br />
exacerbating the eutrophic condition <strong>of</strong> the lagoon. While there are many<br />
signs <strong>of</strong> high nutrient load to the system, values <strong>of</strong> inorganic nutrients<br />
measured in the water column are low. This is not unusual as inorganic<br />
nutrients are taken up and incorporated very quickly by algal cells. Thus<br />
these values are not a good indicator <strong>of</strong> nutrient status <strong>of</strong> the lake. In<br />
contrast, values for total nitrogen and total phosphorus are very high<br />
indicating a high turnover <strong>of</strong> nutrients in the system.<br />
Management implications<br />
Increasing the flushing <strong>of</strong> the lake by opening it more frequently may seem<br />
like a simple option to improving water quality. However, this will expose<br />
existing filamentous algae causing further low dissolved oxygen events.<br />
Reducing the water levels in the lagoon is likely to kill surrounding wetland<br />
vegetation, which is acting as a filter for nutrients from the catchment. In<br />
addition, the duration <strong>of</strong> opening is likely to decrease with increased opening<br />
frequency at a reduced berm height.<br />
Therefore the most effective way to improve the health <strong>of</strong> the lagoon, and<br />
reduce filamentous and blue green algae growth, is to reduce the load <strong>of</strong><br />
nutrients to the lagoon from the catchment.<br />
7