ANNUAL REPORT 2008 - Gorenje Group
ANNUAL REPORT 2008 - Gorenje Group
ANNUAL REPORT 2008 - Gorenje Group

You also want an ePaper? Increase the reach of your titles
YUMPU automatically turns print PDFs into web optimized ePapers that Google loves.
45<br />
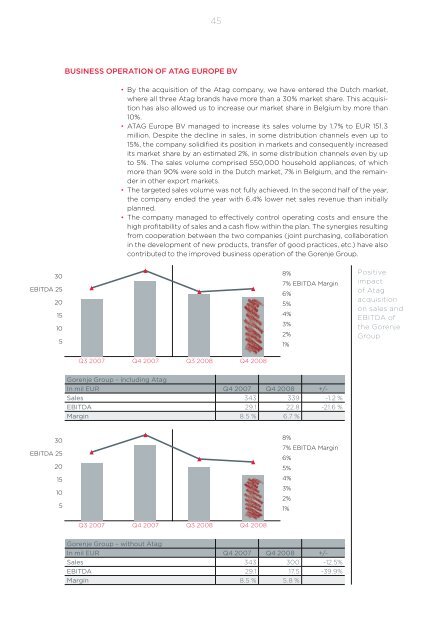
BUSINESS OPERATION OF ATAG EUROPE BV<br />
• By the acquisition of the Atag company, we have entered the Dutch market,<br />
where all three Atag brands have more than a 30% market share. This acquisition<br />
has also allowed us to increase our market share in Belgium by more than<br />
10%.<br />
• ATAG Europe BV managed to increase its sales volume by 1.7% to EUR 151.3<br />
million. Despite the decline in sales, in some distribution channels even up to<br />
15%, the company solidified its position in markets and consequently increased<br />
its market share by an estimated 2%, in some distribution channels even by up<br />
to 5%. The sales volume comprised 550,000 household appliances, of which<br />
more than 90% were sold in the Dutch market, 7% in Belgium, and the remainder<br />
in other export markets.<br />
• The targeted sales volume was not fully achieved. In the second half of the year,<br />
the company ended the year with 6.4% lower net sales revenue than initially<br />
planned.<br />
• The company managed to effectively control operating costs and ensure the<br />
high profitability of sales and a cash flow within the plan. The synergies resulting<br />
from cooperation between the two companies (joint purchasing, collaboration<br />
in the development of new products, transfer of good practices, etc.) have also<br />
contributed to the improved business operation of the <strong>Gorenje</strong> <strong>Group</strong>.<br />
30<br />
EBITDA 25<br />
20<br />
15<br />
10<br />
5<br />
8%<br />
7% EBITDA Margin<br />
6%<br />
5%<br />
4%<br />
3%<br />
2%<br />
1%<br />
Positive<br />
impact<br />
of Atag<br />
acquisition<br />
on sales and<br />
EBITDA of<br />
the <strong>Gorenje</strong><br />
<strong>Group</strong><br />
Q3 2007 Q4 2007 Q3 <strong>2008</strong> Q4 <strong>2008</strong><br />
<strong>Gorenje</strong> <strong>Group</strong> – including Atag<br />
In mil EUR Q4 2007 Q4 <strong>2008</strong> +/-<br />
Sales 343 339 -1.2 %<br />
EBITDA 29.1 22.8 -21.6 %<br />
Margin 8.5 % 6.7 %<br />
30<br />
EBITDA 25<br />
20<br />
15<br />
10<br />
5<br />
8%<br />
7% EBITDA Margin<br />
6%<br />
5%<br />
4%<br />
3%<br />
2%<br />
1%<br />
Q3 2007 Q4 2007 Q3 <strong>2008</strong> Q4 <strong>2008</strong><br />
<strong>Gorenje</strong> <strong>Group</strong> – without Atag<br />
In mil EUR Q4 2007 Q4 <strong>2008</strong> +/-<br />
Sales 343 300 -12.5%<br />
EBITDA 29.1 17.5 -39.9%<br />
Margin 8.5 % 5.8 %