ANNUAL REPORT 2008 - Gorenje Group
ANNUAL REPORT 2008 - Gorenje Group ANNUAL REPORT 2008 - Gorenje Group
40 2008 3.2 SALES AND MARKET POSITION SHARP FALL IN MARKET DEMAND • In past years, the number of households and the average buying power were on the rise, and the number of home appliances in households were growing steadily. In past months, there has been a sharp fall in demand in the market of large household appliances. • On a yearly level, the market still recorded a slight growth, whereas in the last two months of the year a decline was recorded in practically all markets (Russia: -11.7%, Brazil: -14%, China: -18.5%, Europe: -8.5%). The only exception in Europe was Poland with a growth of slightly over 10%. Sales of the Gorenje Group and Gorenje, d.d. 1200 900 600 300 2004 2005 2006 2007 2008 Gorenje d.d. (000 EUR) 603,488 639,960 731,761 831,273 764,106 Gorenje Group (000 EUR) 905,324 1,014,669 1,111,035 1,293,438 1,330,753 • In the given conditions, the products and services sold by the Gorenje Group increased by EUR 37.3 million 2.9%) • This growth also includes EUR 72.7 million generated through the acquisition of Atag in July 2008. A review of the net sales revenue in our divisions clearly points to the following: • strengthening of the Ecology, Energy and Services Division (growth of volume of operations and favourable prices of energy products), • weakening of the Home Interior Division (business consolidation and loss of a portion of revenue in the last two months of the year), and • the successful replacement of revenue lost in the last two months of the year (onset of financial crisis in Europe) with the half-year sales generated by the acquired Atag company. Sales revenue by division In 000 EUR 2008 % 2007 % 08/07 Home Appliances Division 1,050,125 78.9 1,022,805 79.1 102.7 Home Appliances Division without Atag 977,416 / 1,022,805 79.1 95.6 Home Interior Division 59,133 4.4 65,206 5.0 90.7 Ecology, Energy and Services Division 221,495 16.7 205,427 15.9 107.8 = Consolidated sales revenue 1,330,753 100.0 1,293,438 100.0 102.9 = Consolidated sales revenue without Atag 1,258,044 / 1,293,438 100.0 97.3
41 3.2.1 HOME APPLIANCES DIVISION 3.2.1.1 SITUATION IN THE MARKET OF LARGE HOUSEHOLD APPLIANCES EUROPEAN MARKET • 1.9% decline in volume compared to 2007, primarily due to Western European markets. • 1.3% decrease in average prices and 3.2% decrease in sales value. • The larger part of the decrease occurred in the last two months of the year, when the sales volume decreased by 9.1% and sales value by 11.3% alongside a 2.5 decrease in prices. WESTERN EUROPEAN MARKET • 2.9% decline in sales volume. • 1.5% decrease in average prices; 4.4% decrease in sales value. • In the last two months of the year, declining sales intensified: sales volume by 7.1%, sales value by 9.3%. Prices dropped 2.3%. • Highest decline in sales volume: Spain (-9.1%), United Kingdom (-7.4%) and Italy (-4.4%). Despite the difficult situation, the sales volume increased in some markets in 2008: Austria (+2.6%), Finland (+1.4%), the Netherlands (+0.8%) and France (+0.6%). • 2.9% decline in sales volume of all product groups, except washing machines. • Highest decline in sales volume of dryers (-5%), cookers and ovens (-4.9%), hoods (-4.8%) and cooking hobs (-4.4%). EASTERN EUROPEAN MARKET • 2.5% growth of sales volume on the yearly level. • 1.9% positive growth of prices, 4.4% growth of sales value. • In the last two months of 2008: 12.8% decline in volume, 15.8% decline in value, 3.5% decrease in prices. • Highest decline in sales volume: Estonia (-14.9%), Croatia (-10.3%) and Hungary (-9%); in the last two months of 2008 primarily the Ukraine (-36.3 %), Croatia (-27.1%) and Russia (-6.2%). The markets of Poland and Slovakia grew both on the yearly level and in the last two months of the year. • Refrigerators were the only product group that recorded a decline in sales (-3.8%). The highest growth was registered in the following product groups: dishwashers (+19.9%), hoods (+12.9%), cooking hobs (+11.9%), and dryers (+11.2%). Gorenje’s MARKET SHARE increased in the leading markets of Western Europe, i.e. Germany and France, and was maintained in Scandinavia. Gorenje increased its market share in Western Europe by 0.1% to 1.2%, and jointly with Atag to 1.8%. In the last two months, Gorenje even increased its market shares in Germany and France in comparison with competitors. In Eastern Europe, the Company lost 1.2% of its market share, attaining a 9.1% market share.
- Page 1 and 2: ANNUAL REPORT 2008
- Page 3 and 4: LETTER OF THE PRESIDENT OF THE MANA
- Page 5 and 6: 5 A review of the operations of man
- Page 8 and 9: 8 2008 KEY ACHIEVEMENTS OF THE GORE
- Page 10 and 11: FINANCIAL HIGHLIGHTS OF THE GORENJE
- Page 12 and 13: 12 2008 EVENTS IN 2008 BUSINESS ACT
- Page 14 and 15: 14 2008 REPORT OF THE SUPERVISORY B
- Page 16 and 17: 16 2008 The Annual Report of Gorenj
- Page 19 and 20: CORPORATE GOVERNANCE
- Page 21 and 22: 21 • On 16 January 2008, Gorenje,
- Page 23 and 24: 23 Gorenje Budapest Kft., Hungary 1
- Page 25 and 26: 25 members of the Management Board,
- Page 27 and 28: 27 d. On the Company’s rules on t
- Page 29 and 30: 29 of the Management and Supervisor
- Page 31: 31 1.3 STATEMENT OF MANAGEMENT RESP
- Page 34 and 35: 34 2008 Owing to the intensively ch
- Page 37 and 38: BUSINESS REPORT
- Page 39: 39 SLOVENIA • Considerable slowdo
- Page 43 and 44: 43 AUSTRIA SCANDINAVIA • Rapid gr
- Page 45 and 46: 45 BUSINESS OPERATION OF ATAG EUROP
- Page 47 and 48: 47 ENERGY • Sales revenue doubled
- Page 49 and 50: 49 3.4 PURCHASING Raw material mark
- Page 51 and 52: 51 included a connection to the nat
- Page 53 and 54: 53 The appliances have been classif
- Page 55 and 56: 55 3.7 PRODUCTION The majority of p
- Page 57 and 58: 57 3.9 FINANCIAL MANAGEMENT The uni
- Page 59 and 60: 59 Sales risks are associated with
- Page 61 and 62: 61 3.10.3 OPERATING RISK MANAGEMENT
- Page 63 and 64: 63 3.11 CREATING VALUE FOR SHAREHOL
- Page 65 and 66: 65 3.12 BUSINESS PLAN AND ANTICIPAT
- Page 67 and 68: 67 3.13 REPORT ON SOCIAL RESPONSIBI
- Page 69 and 70: 69 3.13.2 RESPONSIBILITY TO USERS O
- Page 71 and 72: 71 The Kemis Group has co-operated
- Page 73 and 74: 73 Costs of goods, materials and se
- Page 77 and 78: ACCOUNTING REPORT
- Page 79 and 80: 79 Consolidated balance sheet of th
- Page 82 and 83: 82 2008 Consolidated statement of c
- Page 84 and 85: 84 2008 4.1.1.2 NOTES TO THE CONSOL
- Page 86 and 87: 86 2008 (ii) Foreign operations The
- Page 88 and 89: 88 2008 tributable to bringing the
40<br />
<strong>2008</strong><br />
3.2 SALES AND MARKET POSITION<br />
SHARP FALL IN MARKET DEMAND<br />
• In past years, the number of households and the average buying power were on<br />
the rise, and the number of home appliances in households were growing steadily.<br />
In past months, there has been a sharp fall in demand in the market of large<br />
household appliances.<br />
• On a yearly level, the market still recorded a slight growth, whereas in the last<br />
two months of the year a decline was recorded in practically all markets (Russia:<br />
-11.7%, Brazil: -14%, China: -18.5%, Europe: -8.5%). The only exception in Europe<br />
was Poland with a growth of slightly over 10%.<br />
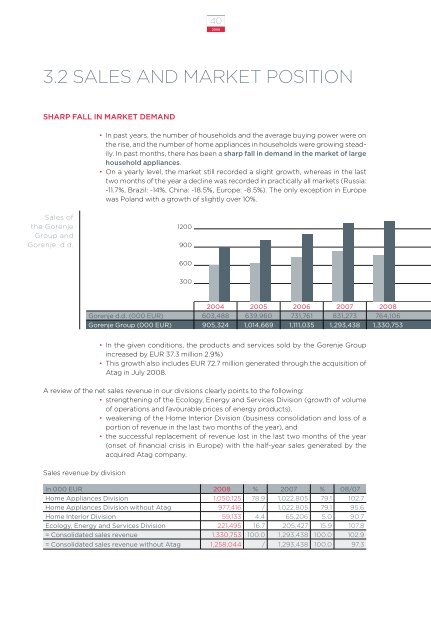
Sales of<br />
the <strong>Gorenje</strong><br />
<strong>Group</strong> and<br />
<strong>Gorenje</strong>, d.d.<br />
1200<br />
900<br />
600<br />
300<br />
2004 2005 2006 2007 <strong>2008</strong><br />
<strong>Gorenje</strong> d.d. (000 EUR) 603,488 639,960 731,761 831,273 764,106<br />
<strong>Gorenje</strong> <strong>Group</strong> (000 EUR) 905,324 1,014,669 1,111,035 1,293,438 1,330,753<br />
• In the given conditions, the products and services sold by the <strong>Gorenje</strong> <strong>Group</strong><br />
increased by EUR 37.3 million 2.9%)<br />
• This growth also includes EUR 72.7 million generated through the acquisition of<br />
Atag in July <strong>2008</strong>.<br />
A review of the net sales revenue in our divisions clearly points to the following:<br />
• strengthening of the Ecology, Energy and Services Division (growth of volume<br />
of operations and favourable prices of energy products),<br />
• weakening of the Home Interior Division (business consolidation and loss of a<br />
portion of revenue in the last two months of the year), and<br />
• the successful replacement of revenue lost in the last two months of the year<br />
(onset of financial crisis in Europe) with the half-year sales generated by the<br />
acquired Atag company.<br />
Sales revenue by division<br />
In 000 EUR <strong>2008</strong> % 2007 % 08/07<br />
Home Appliances Division 1,050,125 78.9 1,022,805 79.1 102.7<br />
Home Appliances Division without Atag 977,416 / 1,022,805 79.1 95.6<br />
Home Interior Division 59,133 4.4 65,206 5.0 90.7<br />
Ecology, Energy and Services Division 221,495 16.7 205,427 15.9 107.8<br />
= Consolidated sales revenue 1,330,753 100.0 1,293,438 100.0 102.9<br />
= Consolidated sales revenue without Atag 1,258,044 / 1,293,438 100.0 97.3


