Annual Report Gorenje Group 2009
Annual Report Gorenje Group 2009
Annual Report Gorenje Group 2009

You also want an ePaper? Increase the reach of your titles
YUMPU automatically turns print PDFs into web optimized ePapers that Google loves.
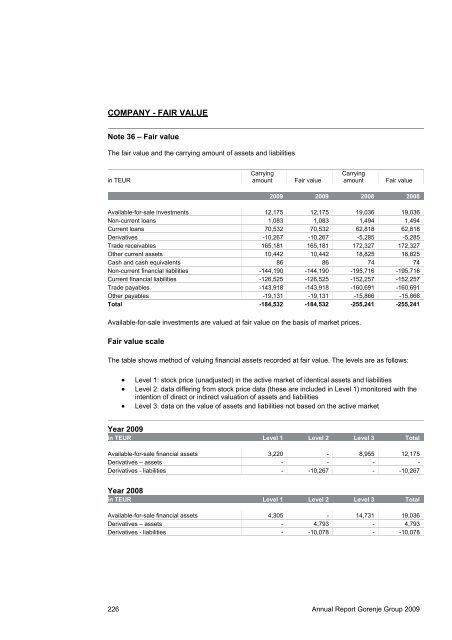
COMPANY - FAIR VALUE<br />
Note 36 – Fair value<br />
The fair value and the carrying amount of assets and liabilities<br />
in TEUR<br />
Carrying<br />
amount<br />
Fair value<br />
Carrying<br />
amount<br />
Fair value<br />
<strong>2009</strong> <strong>2009</strong> 2008 2008<br />
Available-for-sale investments 12,175 12,175 19,036 19,036<br />
Non-current loans 1,083 1,083 1,494 1,494<br />
Current loans 70,532 70,532 62,818 62,818<br />
Derivatives -10,267 -10,267 -5,285 -5,285<br />
Trade receivables 165,181 165,181 172,327 172,327<br />
Other current assets 10,442 10,442 18,825 18,825<br />
Cash and cash equivalents 86 86 74 74<br />
Non-current financial liabilities -144,190 -144,190 -195,716 -195,716<br />
Current financial liabilities -126,525 -126,525 -152,257 -152,257<br />
Trade payables -143,918 -143,918 -160,691 -160,691<br />
Other payables -19,131 -19,131 -15,866 -15,866<br />
Total -184,532 -184,532 -255,241 -255,241<br />
Available-for-sale investments are valued at fair value on the basis of market prices.<br />
Fair value scale<br />
The table shows method of valuing financial assets recorded at fair value. The levels are as follows:<br />
• Level 1: stock price (unadjusted) in the active market of identical assets and liabilities<br />
• Level 2: data differing from stock price data (these are included in Level 1) monitored with the<br />
intention of direct or indirect valuation of assets and liabilities<br />
• Level 3: data on the value of assets and liabilities not based on the active market<br />
Year <strong>2009</strong><br />
in TEUR Level 1 Level 2 Level 3 Total<br />
Available-for-sale financial assets 3,220 - 8,955 12,175<br />
Derivatives – assets - - - -<br />
Derivatives - liabilities - -10,267 - -10,267<br />
Year 2008<br />
in TEUR Level 1 Level 2 Level 3 Total<br />
Available-for-sale financial assets 4,305 - 14,731 19,036<br />
Derivatives – assets - 4,793 - 4,793<br />
Derivatives - liabilities - -10,078 - -10,078<br />
226<br />
<strong>Annual</strong> <strong>Report</strong> <strong>Gorenje</strong> <strong>Group</strong> <strong>2009</strong>