150 In comparison, black <strong>clays</strong> from field locations representing sample No. SA2-70cm alone have a swelling pressure <strong>of</strong> SP = 82,46 kPa, <strong>an</strong>d would therefore require <strong>an</strong> external load <strong>of</strong> 15,54 kPa to permit the same amount <strong>of</strong> percentage swelling, S% = 2, i.e. P (kPa) = (18,85 * 82,46)/100 = 15,54 Other extents <strong>of</strong> external loading necessary to give certain permissible percentage swelling could be similarly calculated if the swelling pressure (SP) <strong>of</strong> the <strong>clays</strong> is already known. Tsiambaos <strong>an</strong>d Tsaligopoulos (1995) investigated swelling characteristics <strong>of</strong> exp<strong>an</strong>sive <strong>clays</strong> based on examples from Greece. As a way <strong>of</strong> estimating the swelling characteristics, they suggested plotting the ratio <strong>of</strong> percentage swelling (w.r.t original specimen height, Ho) to corresponding load decrement, S (%)/P (kPa) on log scale, against the ratio <strong>of</strong> load decrement to swelling pressure, [P (kPa)/SP (kPa)] * 100%. Results <strong>of</strong> such a relationship as applied to data <strong>of</strong> black <strong>clays</strong> obtained in this study are presented in Table (7.25) <strong>an</strong>d Fig.(7.38). Table 7.25. Computed values <strong>of</strong> ratio S(%)/P <strong>an</strong>d P/SP (%) (according to Greek method) for black <strong>clays</strong> in this study. Sample No. P (kPa) SP = Pmax (kPa) Smax (mm) S (%) S (%) / P P (%) = (P/SP)*100 82,46 0,00 0,01 100 41,23 0,96 0,02 50 SA2/70cm 19,99 82,46 1,036 2,30 0,12 24 10,00 2,92 0,29 12 5,00 4,90 0,98 6 2,50 6,59 2,64 3 37,48 0,00 0,01 100 18,74 0,49 0,03 50 SB1/70cm 10,00 37,48 0,425 1,15 0,12 27 5,00 1,79 0,36 13 2,50 2,54 1,02 7 36,23 0,00 0,01 100 17,49 0,60 0,03 48 SC25/50cm 8,75 36,23 0,475 1,45 0,17 24 5,00 2,36 0,47 14 2,50 3,15 1,26 7 44,98 0,00 0,01 100 22,49 0,55 0,02 50 SC29/50cm 11,24 44,98 0,493 1,35 0,12 25 5,00 2,42 0,48 11 2,50 3,24 1,30 6 Average value: 50,29 0,607(5,52%)
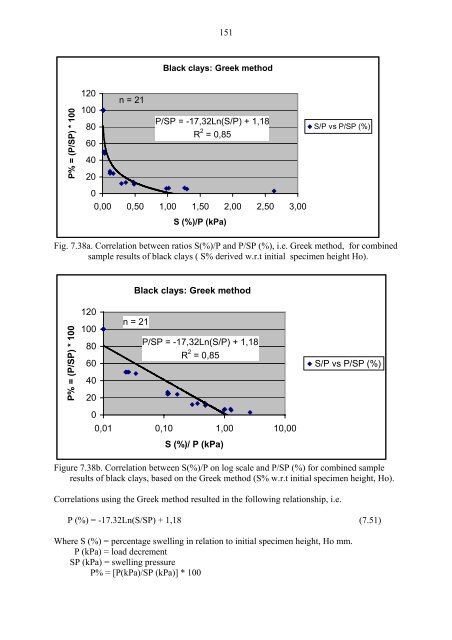
151 Black <strong>clays</strong>: Greek method P% = (P/SP) * 100 120 100 80 60 40 20 n = 21 P/SP = -17,32Ln(S/P) + 1,18 R 2 = 0,85 S/P vs P/SP (%) 0 0,00 0,50 1,00 1,50 2,00 2,50 3,00 S (%)/P (kPa) Fig. 7.38a. Correlation between ratios S(%)/P <strong>an</strong>d P/SP (%), i.e. Greek method, for combined sample results <strong>of</strong> black <strong>clays</strong> ( S% derived w.r.t initial specimen height Ho). Black <strong>clays</strong>: Greek method P% = (P/SP) * 100 120 100 80 60 40 20 n = 21 P/SP = -17,32Ln(S/P) + 1,18 R 2 = 0,85 S/P vs P/SP (%) 0 0,01 0,10 1,00 10,00 S (%)/ P (kPa) Figure 7.38b. Correlation between S(%)/P on log scale <strong>an</strong>d P/SP (%) for combined sample results <strong>of</strong> black <strong>clays</strong>, based on the Greek method (S% w.r.t initial specimen height, Ho). Correlations using the Greek method resulted in the following relationship, i.e. P (%) = -17.32Ln(S/SP) + 1,18 (7.51) Where S (%) = percentage swelling in relation to initial specimen height, Ho mm. P (kPa) = load decrement SP (kPa) = swelling pressure P% = [P(kPa)/SP (kPa)] * 100
- Page 1 and 2:
AN ENGINEERING GEOLOGICAL CHARACTER
- Page 3 and 4:
i Contents Page Acknowledgements Su
- Page 5 and 6:
iii Chapter 8. Distribution of inde
- Page 7 and 8:
v 7.29 - 7.33 Correlation between s
- Page 9 and 10:
vii 136 139 7.13 Compressibility cl
- Page 11 and 12:
ix Acknowledgements I would like to
- Page 13 and 14:
1 Chapter 1 Introduction 1.1 Scope
- Page 15 and 16:
Figure1.1 Map of Nairobi region sho
- Page 17 and 18:
5 Plates 1.2 (a) & (b) Strong shrin
- Page 19 and 20:
7 Available literature in the form
- Page 21 and 22:
9 slopes. The northern boundary bet
- Page 23 and 24:
11 1.6 Climate The Nairobi area and
- Page 25 and 26:
13 marked daily range of relative h
- Page 27 and 28:
15 Chapter 2 Previous works 2.1 Sum
- Page 29 and 30:
17 Table 2.1 Stratigraphic correlat
- Page 31 and 32:
19 Chapter 3 Geology 3.1 Introducti
- Page 33:
21 metamorphic minerals sillimanite
- Page 37 and 38:
25 and prismatic apatite occur as a
- Page 39 and 40:
27 Table 3.2 Chemical analyses of s
- Page 41 and 42:
29 caused by partial segregation of
- Page 44 and 45:
32 could otherwise lead to erroneou
- Page 46 and 47:
34 The red soils in this study occu
- Page 48 and 49:
36 17 16 15 14 13 12 11 10 9 8 7 6
- Page 50 and 51:
38 4.4 Vane test 4.4.1 Introduction
- Page 52 and 53:
40 Table 4.1 Classification of soft
- Page 54 and 55:
42 The variation of vane shear stre
- Page 56 and 57:
44 And thirdly, the field vane appa
- Page 58:
46 horizon, most probably a result
- Page 61 and 62:
49 The red friable clays on the who
- Page 63 and 64:
51 Results of chemical analyses of
- Page 65 and 66:
53 Results of previous soil classif
- Page 67 and 68:
55 neighbouring metamorphic areas a
- Page 69 and 70:
57 Table 5.10. Profile description
- Page 71 and 72:
59 The presence of BaO in the red a
- Page 73 and 74:
61 resulted most probably from supp
- Page 75 and 76:
63 800 Impulse 700 600 500 SC 17 -5
- Page 77 and 78:
65 sericite and chlorite (see next
- Page 79 and 80:
67 Q: Quartz (1%) H: Haematite K: K
- Page 81 and 82:
69 Plate 6.3. K-feldspar phenocryst
- Page 83 and 84:
71 The trachytes generally show a r
- Page 85 and 86:
73 Plate 6.16. Organic matter (rema
- Page 87 and 88:
75 Plate 6.24. Solution pores/ cavi
- Page 89 and 90:
77 Plate 6.29. Iron concretion with
- Page 91 and 92:
79 The CS-225 is a micro-processor
- Page 93 and 94:
81 The red soils generally exhibit
- Page 95 and 96:
83 Chapter 7 Laboratory soils index
- Page 97 and 98:
85 According to Johnson and Degraff
- Page 99 and 100:
87 Table 7.2. Results of index test
- Page 101 and 102:
89 Plate 7.2a. Apparatus for liquid
- Page 103 and 104:
91 Activity chart Plasticity index
- Page 105 and 106:
93 Table 7.3 (continued). Atterberg
- Page 107 and 108:
95 where 7.1.4.4 Results V = volume
- Page 109 and 110:
97 A standard classification of soi
- Page 111 and 112: 99 Table 7.6. Viscosity and density
- Page 113 and 114: 101 Table 7.7, continued. Results o
- Page 115 and 116: 103
- Page 117 and 118: 105 Plate 7.7a. Shear testing showi
- Page 119 and 120: 107 Shear stress / Displacement Cur
- Page 121 and 122: 109 Table 7.10. Distribution and/ o
- Page 123 and 124: 111 illustrated in Figures 7.6, 7.7
- Page 125 and 126: 113 Black clays Cohesion c´ (kN/m
- Page 127 and 128: 115 7.4 Oedometer consolidation tes
- Page 129 and 130: 117 The compound coefficient, K/ρw
- Page 131 and 132: 119 Primary consolidation is a time
- Page 133 and 134: 121 where w (%) = moisture content
- Page 135 and 136: 123 Relationships between values of
- Page 137 and 138: 125 Plate 7.8. Oedometer consolidat
- Page 139 and 140: 127 Cumulative log-time/settlement
- Page 141 and 142: 129 Ranges of values of coefficient
- Page 143 and 144: 131 is most probably due to the ten
- Page 145 and 146: 133 The results of correlation show
- Page 147 and 148: 135 by differences in lithology, mi
- Page 149 and 150: 137 Black clays and red soils Swell
- Page 151 and 152: 139 Testing procedure involved cutt
- Page 153 and 154: 141 Black clays Swelling pressure S
- Page 155 and 156: 143 Black clays: P (kPa) vs S (%) P
- Page 157 and 158: 145 The same relationship is repres
- Page 159 and 160: 147 Alternatively, percentage swell
- Page 161: 149 Combined sample results: S % vs
- Page 165 and 166: 153 partly produced by effects of w
- Page 167 and 168: 155 Chapter 8 Distribution of index
- Page 169 and 170: 157 the study area, respectively. R
- Page 171 and 172: 159 Liquid limit variation; 0,50m a
- Page 173 and 174: 161 Liquid limit (LL) variation (>
- Page 175 and 176: 163 (8.6). The few isolated patches
- Page 177 and 178: 165 Similarly, soil thicknesses of
- Page 179 and 180: 167 Free swell variation; 0,50m dep
- Page 181 and 182: 169 fraction at the two depth inter
- Page 183 and 184: 171 Variation of fines (%), < 0,50m
- Page 185 and 186: 173 %coarse % coarse fraction varia
- Page 187 and 188: 175 1°19´S 22 Shear angle variati
- Page 189 and 190: 177 9.2 Grain size distribution The
- Page 191 and 192: 179 rapid dissipation of pore water
- Page 193 and 194: Chapter 10 181 Correlation of index
- Page 195 and 196: 183 Black clays; plasticity index/
- Page 197 and 198: 185 On the other hand, laboratory m
- Page 199 and 200: 187 Red clays; measured/ calculated
- Page 201 and 202: 189 These two relationships could b
- Page 203 and 204: 191 Diagram: PImeasured/ PIcalculat
- Page 205 and 206: 193 Table 10.5, continued. Calculat
- Page 207 and 208: 195 Table 10.6. Calculated and labo
- Page 209 and 210: 197 The swelling capability in term
- Page 211 and 212: 199 Free swell/ clay fraction Free
- Page 213 and 214:
201 There has also been a decrease
- Page 215 and 216:
203 PI = 1,88*LS A comparison of pl
- Page 217 and 218:
205 cc = 0,0099(122-LL) for black c
- Page 219 and 220:
207 Chapter 12 Recommendations Anal
- Page 221 and 222:
209 cc = 0,0099(122-LL) for black c
- Page 223 and 224:
211 References Abebe, S. T., 2002.
- Page 225 and 226:
213 Galster, R.W., 1977. A system o
- Page 227 and 228:
215 Mitchell, J.K., 1993. Fundament
- Page 229 and 230:
217 ------,1964. Long term stabilit
- Page 231 and 232:
Appendix A: Oedometer consolidation
- Page 233 and 234:
Table A7. Consolidation parameters
- Page 235 and 236:
Results of swelling tests on black
- Page 237 and 238:
Appendix D Distribution/ variation
- Page 239 and 240:
4000 3000 2000 Distance (m) 1000 We
- Page 241 and 242:
4000 3000 2000 1000 Distance (m) We
- Page 243 and 244:
4000 3000 2000 Distance (m) 1000 We
- Page 245 and 246:
4000 3000 2000 Distance (m) 1000 We
- Page 247 and 248:
4000 3000 2000 Distance (m) 1000 We
- Page 249 and 250:
4000 3000 2000 Distance (m) 1000 We
- Page 251 and 252:
4000 3000 2000 Distance (m) 1000 We
- Page 253 and 254:
4000 3000 2000 Distance (m) 1000 We
- Page 255 and 256:
4000 3000 2000 Distance (m) 1000 We
- Page 257 and 258:
4000 3000 2000 Distance (m) 1000 We
- Page 259 and 260:
Appendix E Geotechnical soil map of