6to. Congreso Virtual de Cardiología - 6th Virtual Congress of ...
6to. Congreso Virtual de Cardiología - 6th Virtual Congress of ...
6to. Congreso Virtual de Cardiología - 6th Virtual Congress of ...

Create successful ePaper yourself
Turn your PDF publications into a flip-book with our unique Google optimized e-Paper software.
<strong>6to</strong>. <strong>Congreso</strong> <strong>Virtual</strong> <strong>de</strong> <strong>Cardiología</strong> - <strong>6th</strong> <strong>Virtual</strong> <strong>Congress</strong> <strong>of</strong> Cardiology<br />
In<strong>de</strong>x > 6VCC > Epi<strong>de</strong>miology and Cardiovascular Prevention<br />
Brief Communication<br />
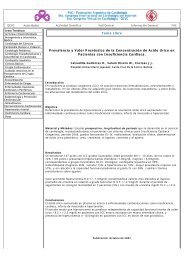
Accuracy <strong>of</strong> the Frie<strong>de</strong>wald Formula Being in Significant Relation to Total<br />
Cholesterol<br />
Rudolf Gaško, Caio Mauricio Men<strong>de</strong>s <strong>de</strong> Cordova*, Slávka Geletková<br />
Railway Hospital and Policlinic Košice, Biostatistic Unit and Dept. <strong>of</strong> Clinical Biochemistry,<br />
Košice, Slovak Republic, *Departamento <strong>de</strong> Ciéncias Farmacéuticas, Fundacao Universida<strong>de</strong><br />
Regional De Blumenau, Blumenau, Santa Catarina, Brazil<br />
Abstract<br />
Introduction<br />
Numerous epi<strong>de</strong>miological and clinical studies reported an in<strong>de</strong>pen<strong>de</strong>nt relationship between increases in LDL-cholesterol<br />
(LDL-C)* concentrations and the risk <strong>of</strong> <strong>de</strong>velopment <strong>of</strong> a coronary heart disease. European Fourth Joint Task Force on<br />
Cardiovascular Disease Prevention in Clinical Practice [1] and the US NCEP ATP III also [2] recommends reducing LDL-C to<br />
below certain cut-<strong>of</strong>f points as the primary target <strong>of</strong> therapy.<br />
The reference method for measuring LDL-C is the ultracentrifugation with beta quantification procedure (BQ), which is not<br />
routinely available in clinical laboratories. The most common approach to <strong>de</strong>termining LDL-C in the clinical laboratory<br />
worldwi<strong>de</strong> is a calculation based on the Frie<strong>de</strong>wald formula [3]. However, there are several well-established limitations to<br />
the Frie<strong>de</strong>wald calculation, which led an expert panel convened by the NCEP to recommending <strong>de</strong>velopment <strong>of</strong> accurate<br />
methods for direct <strong>de</strong>termination <strong>of</strong> LDL-C [4, 5]. Recently, a new generation <strong>of</strong> homogeneous assays has been introduced<br />
as direct methods, which have been certified by the US CRMLN [4, 5]. Many studies have previously reported that the LDL-C<br />
calculated by the Frie<strong>de</strong>wald formula (FLDL-C) differs from the LDL-C assessed by direct measurement (DLDL-C) or by the<br />
reference method [6]. However, those data showed that differences occurred only over parts <strong>of</strong> the concentration ranges for<br />
TG, LDL-C and VLDL-C [7-12]. Furthermore, only one study shows a significant relationship to TC [13].<br />
This study compares the effects <strong>of</strong> both TC and TG concentrations on the difference between the FLDL-C and DLDL-C in<br />
two other populations from Slovakia and Brazil, un<strong>de</strong>r conditions allowing for application <strong>of</strong> the Frie<strong>de</strong>wald formula.<br />
*Non-standard abbreviations: LDL-C, HDL-C, and VLDL-C, LDL-, HDL-, and VLDL-cholesterol; TG, triglyceri<strong>de</strong>; TC, total<br />
cholesterol; NCEP, National Cholesterol Education Program; ATP III, Adult Treatment Panel III; BQ, beta-quantification;<br />
CRMNL, Cholesterol Reference Methods Laboratory Network;<br />
Methods<br />
Košice dataset<br />
For this part <strong>of</strong> study the blood samples were obtained from 11,331 inpatients and outpatients who visited the Railway<br />
Hospital and Policlinic in Košice, Slovakia, from January 2008 to March 2009. Age range: 18-97 years, mean age: 59<br />
years, males: 53.3%, females: 46.7%. The Institutional Ethics Board approved this examination.<br />
All the persons fasted overnight (for 12 h) before blood collection, and the levels <strong>of</strong> TC, TG, high-<strong>de</strong>nsity lipoprotein<br />
cholesterol (HDL-C) and DLDL-C in serum samples were measured on the day <strong>of</strong> blood collection. Sera with TG level >4.5<br />
mmol/l (1,007 samples, i.e. 8.89% out <strong>of</strong> 11,331 samples), were exclu<strong>de</strong>d. We assessed the total number <strong>of</strong> 10,324<br />
samples.<br />
TC, TG and HDL-C were measured using enzymatic methods (Pliva Lachema Diagnostika, Brno, Czech Republic). DLDL-C<br />
were measured using a LDL Cholesterol Direct Liquid assay (Pliva Lachema Diagnostika, Brno, Czech Republic), which is<br />
based on the Wako Chemicals method. All measurements were performed on a Olympus AU400 automated clinical<br />
chemistry analyzer (Olympus, Hamburg, Germany).<br />
As regards samples with triglyceri<strong>de</strong> levels < 4,5 mmol/l, the LDL-C level was estimated using the Frie<strong>de</strong>wald formula:<br />
FLDL-C = TC – HDL-C – (TG/2.2).<br />
Blumenau dataset.<br />
This part <strong>of</strong> the study assessed blood samples <strong>of</strong> 10,664 patients who sought treatment at Laboratório Santa Isabel <strong>de</strong><br />
Análises Clínicas, Blumenau, SC, Brazil, to un<strong>de</strong>rgo TC, LDL-C, HDL-C, and TG measurements from January 2000 to<br />
December 2002. Their age ranged from 14 to 93 years (females: 54.8%, males: 45.2%). Blood samples were collected<br />
after a 12- to 14-hour period <strong>of</strong> fasting, incubated in a hot-water bath for 15 minutes for coagulation, and centrifuged at<br />
2,000g for 5 minutes. The serum was separated and the assays were performed on the day <strong>of</strong> sample collection. Sera with<br />
TG level >400 mg/dl (340 samples, 3.18% <strong>of</strong> out 10,664 samples) were exclu<strong>de</strong>d. We assessed 10,324 samples.<br />
The measurements <strong>of</strong> the TG and TC were performed with the following reagents: Triglyceri<strong>de</strong>s FS (DiaSys Diagnostic<br />
Systems GmbH & Co. KG, Holzheim, Germany), and Cholesterol (BioSystems S.A., Barcelona, Spain), respectively –<br />
according to the specifications <strong>of</strong> the manufacturers, in a Spectrum CCX II <strong>de</strong>vice (Abbott Diagnostics, Abbott Park, IL,<br />
USA). The HDL-C measurement was performed using a homogeneous method without precipitation with the HDL-C<br />
Immuno FS reagent (DiaSys). The tests were calibrated with the CCX Multicalibrator Set (Abbott), with curves <strong>of</strong> 3 points.<br />
The LDL-C measurement with the homogeneous method was performed with the reagent LDL-C Select FS (DiaSys), which
<strong>6to</strong>. <strong>Congreso</strong> <strong>Virtual</strong> <strong>de</strong> <strong>Cardiología</strong> - <strong>6th</strong> <strong>Virtual</strong> <strong>Congress</strong> <strong>of</strong> Cardiology<br />
is based on the Wako Chemicals method.<br />
For samples with triglyceri<strong>de</strong> levels < 400 mg/dL, the LDL-C level was estimated using the Frie<strong>de</strong>wald formula: FLDL-C =<br />
TC – HDL-C – (TG/5).<br />
The patients’ data had been used in study (8) originally.<br />
The %∆DLDL was calculated using the following formula: %∆DLDL=[(FLDL-C – DLDL-C)/DLDL-C]x100, for both datasets.<br />
Statistical analysis<br />
Descriptive statistics, means and standard <strong>de</strong>viations were calculated, and charts were drawn using Micros<strong>of</strong>t Office Excel<br />
2007. Paired t-test and correlation analysis was performed using MedCalc, Ver.10.3 (MedCalc S<strong>of</strong>tware, Mariakerke,<br />
Belgium).<br />
Results<br />
Košice dataset<br />
The correlation coefficient between the FLDL-C and DLDL-C was 0.94 (p
<strong>6to</strong>. <strong>Congreso</strong> <strong>Virtual</strong> <strong>de</strong> <strong>Cardiología</strong> - <strong>6th</strong> <strong>Virtual</strong> <strong>Congress</strong> <strong>of</strong> Cardiology<br />
Figue 2. Concentrations <strong>of</strong> triglyceri<strong>de</strong> and total cholesterol affect the percentage difference between<br />
the LDL-C measured directly using a homogeneous assay and that calculated using the Frie<strong>de</strong>wald<br />
formula, data from Kosice.<br />
Blumenau dataset<br />
The correlation coefficient between the FLDL-C and DLDL-C was 0.93 (p
<strong>6to</strong>. <strong>Congreso</strong> <strong>Virtual</strong> <strong>de</strong> <strong>Cardiología</strong> - <strong>6th</strong> <strong>Virtual</strong> <strong>Congress</strong> <strong>of</strong> Cardiology<br />
Figure 3. Concentrations <strong>of</strong> triglyceri<strong>de</strong> and total cholesterol affect the percentage difference between<br />
the LDL-C measured directly using a homogeneous assay and that calculated using the Frie<strong>de</strong>wald<br />
formula, data from Blumenau.<br />
For comparison, a facsimile <strong>of</strong> plots based on the data from Korea [13] is shown in Figure 1c, and Figure 4. %∆LDL from all<br />
the three study populations are summarized in Figure 5.<br />
Figure 4. Concentrations <strong>of</strong> triglyceri<strong>de</strong> and total cholesterol affect the percentage difference between<br />
the LDL-C measured directly using a homogeneous assay and that calculated using the Frie<strong>de</strong>wald<br />
formula, data from Seoul, facsimile from ref. [13].
<strong>6to</strong>. <strong>Congreso</strong> <strong>Virtual</strong> <strong>de</strong> <strong>Cardiología</strong> - <strong>6th</strong> <strong>Virtual</strong> <strong>Congress</strong> <strong>of</strong> Cardiology<br />
Figure 5. Comparison <strong>of</strong> percentage differences, data from Kosice, Blumenau and Seoul.<br />
Discussion<br />
The European and US gui<strong>de</strong>lines are in agreement as regards the fact that LDL-C lowering comprises the principal target <strong>of</strong><br />
lipid treatment. The problem is to achieve a reliable <strong>de</strong>termination <strong>of</strong> LDL-C (reducing variability <strong>of</strong> Frie<strong>de</strong>wald LDL-C.)<br />
A major disadvantage related to calculating LDL-C is that the variability is a product <strong>of</strong> combined variabilities in the three<br />
un<strong>de</strong>rlying measurements. The NCEP Expert Panel observed in experienced and well-standardized lipid laboratories that<br />
total analytical variability in calculated LDL-C averaged 4.0%, ranging between 2.7% and 6.8% for LDL-C concentrations<br />
between 2.59-5.83 mmol/l [14]. In routine laboratories, variability appeared to be much higher, e.g. eight survey samples<br />
<strong>of</strong> the College <strong>of</strong> American Pathologists (CAP) Comprehensive Chemistry Survey analyzed in more than 1,150 laboratories<br />
gave overall CVs averaging 12% [14]. This CV reflects not only imprecision within laboratories, but also method-to-method<br />
biases from the many different assays used in TC, TG, and HDL-C <strong>de</strong>terminations. The Panel, concluding that many routine<br />
laboratories would not be able to achieve the requisite analytical performance using the Frie<strong>de</strong>wald calculation,<br />
recommen<strong>de</strong>d <strong>de</strong>velopment <strong>of</strong> more precise direct methods. The TC <strong>de</strong>terminations have the most significant effect on<br />
variability in the calculation [4]. TG values are divi<strong>de</strong>d by 2.2 (or 5, for non SI Units) and HDL-C concentrations are<br />
relatively lower, diminishing their impact. Observations from the lipid laboratories as well as from the CAP survey <strong>of</strong><br />
routine laboratories suggested that CVs for LDL-C were approximately a double <strong>of</strong> those for TC [14]. However, increasing<br />
TGs contribute progressively to a higher variability the calculated LDL-C. Adoption <strong>of</strong> fully automated homogeneous<br />
methods for HDL-C is reality in routine laboratories (including Slovakia and Brazil) in the last years, and addresses the<br />
matter <strong>of</strong> imprecision, including the contribution to calculated LDL-C; nevertheless, the conclusions <strong>of</strong> the NCEP Expert<br />
Panel are likely to be still valid.<br />
Priority findings on the direct proportionality <strong>of</strong> total cholesterol and size %∆LDL, authors Jun et al [13], were confirmed in<br />
both datasets. Both TC and TG represent significant variables affecting the difference between the directly measured and<br />
the calculated LDL-C over the entire range <strong>of</strong> TC and TG values; the %DLDL increased as TC <strong>de</strong>creased and TG increased.<br />
Differences in the average value percentage may be due to<br />
- Analytical uncertainty. Analytical uncertainty can not be exclu<strong>de</strong>d <strong>de</strong>spite the <strong>de</strong>scribed good value CV and external<br />
quality assessment. We compared two in<strong>de</strong>x methods, not a reference method with an in<strong>de</strong>x test.<br />
- Different composition <strong>of</strong> patients in the sets. It was <strong>de</strong>monstrated that DM, hepatopathy, nephropathy is substantially<br />
different in FF bias [6]. The divergence structure <strong>of</strong> both the sets suggests that 8.89% <strong>of</strong> patients in Kosice had TG higher<br />
then 4.5 mmol/l, but only 3.18% <strong>of</strong> patients in Blumenau, and TC higher than 6.48 mmol/l – the ratios were 23.84% and<br />
8.04% respectively. Quite on the contrary, TC less than 3.89 mmol/l – the ratios were 4.44% and 13.71% respectively.<br />
- Racial genetic differences [15, 16].<br />
A percentage difference <strong>of</strong> more than 10% is not surprising as it has already been <strong>de</strong>scribed. Branchi et al [17] <strong>de</strong>scribe<br />
34% <strong>of</strong> samples from diabetic patients and 26% <strong>of</strong> samples from non-diabetic patients, but once TG level excee<strong>de</strong>d 2.26<br />
mmol/l, 45% <strong>of</strong> samples from diabetic patients and 34% <strong>of</strong> samples from others differed from measured LDL-C by >10%.<br />
Recent data <strong>de</strong>monstrate that apolipoprotein B is a better means <strong>of</strong> measurement <strong>of</strong> the circulating LDL particle number<br />
concentration and it is also a more reliable indicator <strong>of</strong> risk than LDL-C, and there is growing support for the i<strong>de</strong>a that<br />
addition <strong>of</strong> an apo B measurement to the routine lipid panel for assessing and monitoring patients at risk for cardiovascular<br />
disease would enhance patient management [18, 19].
<strong>6to</strong>. <strong>Congreso</strong> <strong>Virtual</strong> <strong>de</strong> <strong>Cardiología</strong> - <strong>6th</strong> <strong>Virtual</strong> <strong>Congress</strong> <strong>of</strong> Cardiology<br />
Conclusions<br />
It is to be stated that we observed a poor concordance between the calculated and measured LDL cholesterol in three large<br />
populations from Brazil, Slovakia and South Korea, <strong>de</strong>spite a good correlation between the two methods. The accuracy <strong>of</strong><br />
the Frie<strong>de</strong>wald formula proves to be in a significant relation to total cholesterol. Further clinical evaluation is required to<br />
verify this finding.<br />
Acknowledgement<br />
This study has been supported by a research grant from the Slovak Society <strong>of</strong> Cardiology 2008.<br />
References<br />
1.Graham I, Atar D, Borch-Johnsen K, et al. European gui<strong>de</strong>lines on cardiovascular disease prevention in clinical practice:<br />
executive summary. Eur Heart J 2007;28:2375-2414.<br />
2. Third report <strong>of</strong> the National Cholesterol Education Program (NCEP) expert panel on <strong>de</strong>tection, evaluation, and treatment<br />
<strong>of</strong> high blood cholesterol in adults (Adult Treatment Panel III) final report. Circulation 2002;106:3143-3421.<br />
3. Frie<strong>de</strong>wald WT, Levy RI, Fredrickson DS. Estimation <strong>of</strong> the concentration <strong>of</strong> low-<strong>de</strong>nsity lipoprotein cholesterol in plasma,<br />
without use <strong>of</strong> the preparative ultracentrifuge. Clin Chem 1972;18:499–502.<br />
4. Nauck M, Warnick GR, Rifai N. Methods for measurement <strong>of</strong> LDL-cholesterol: a critical assessment <strong>of</strong> direct<br />
measurement by homogeneous assays versus calculation. Clin Chem 2002;48:236–254.<br />
5. Bachorik PS, Ross JW. National Cholesterol Education Program recommendations for measurement <strong>of</strong> low-<strong>de</strong>nsity<br />
lipoprotein cholesterol: executive summary. The National Cholesterol Education Program Working Group on Lipoprotein<br />
Measurement. Clin Chem 1995;41:1414–1420.<br />
6. Gaško R, Sánchez-Meca J. LDL-cholesterol: A critical assessment <strong>of</strong> analytical accuracy Frie<strong>de</strong>wald`s formula. Metaanalysis.<br />
Cardiol, 2008, accepted, paper in press.<br />
7. Ahmadi S, Boroumand M, Gohan-Moghaddam K, et al. The impact <strong>of</strong> low serum triglyceri<strong>de</strong> on LDL-cholesterol<br />
estimation. Arch Iran Med 2008;11:318-321.<br />
8. Cordova CM, Schnei<strong>de</strong>r CR, Juttel ID, Cordova MM. Comparison <strong>of</strong> LDL-cholesterol direct measurement with the<br />
estimate using the Frie<strong>de</strong>wald formula in a sample <strong>of</strong> 10,664 patients. Arq Bras Cardiol 2004;83:482–487.<br />
9. Scharnagl H, Nauck M, Wieland H, Marz W. The Frie<strong>de</strong>wald formula un<strong>de</strong>restimates LDL cholesterol at low<br />
concentrations. Clin Chem Lab Med 2001;39:426–431.<br />
10. Sni<strong>de</strong>rman AD, Blank D, Zakarian R, et al. Triglyceri<strong>de</strong>s and small <strong>de</strong>nse LDL: the twin Achilles heels <strong>of</strong> the Frie<strong>de</strong>wald<br />
formula. Clin Biochem 2003;36:499–504.<br />
11. Tremblay AJ, Morrissette H, Gagne JM, et al. Validation <strong>of</strong> the Frie<strong>de</strong>wald formula for the <strong>de</strong>termination <strong>of</strong> low-<strong>de</strong>nsity<br />
lipoprotein cholesterol compared with beta-quantification in a large population. Clin Biochem 2004;37:785–790.<br />
12. Wang TY, Haddad M, Wang TS. Low triglyceri<strong>de</strong> levels affect calculation <strong>of</strong> low-<strong>de</strong>nsity lipoprotein cholesterol values.<br />
Arch Pathol Lab Med 2001;125:404–405.<br />
13. Jun KR, Park H, Chun S, et al. Effects <strong>of</strong> total cholesterol and triglyceri<strong>de</strong> on the percentage difference between the low<strong>de</strong>nsity<br />
lipoprotein cholesterol concentration measured directly and calculated using the Frie<strong>de</strong>wald formula. Clin Chem Lab<br />
Med 2008;46:371-375.<br />
14. National Cholesterol Education Program. Recommendations on lipoprotein measurement. Working Group on Lipoprotein<br />
Measurement. NIH Publication No. 95-3044. 1995 National Institutes <strong>of</strong> Health, National Heart, Lung, and Blood Institute<br />
Bethesda, MD.<br />
15. McQeen MJ, Hawken S, Wang X, et al. Lipids, lipoproteins, and apolipoproteins as risk markers <strong>of</strong> myocardial infarction<br />
in 52 countries (the INTERHEART study): a case-control study. Lancet 2008;372:224-233.<br />
16. Sandhu MS, Waterworth DM, Deberham SI, et al. LDL-cholesterol concentrations: a genome–wi<strong>de</strong> association study.<br />
Lancet 2008;371:483-491.<br />
17. Branchi A, Rovellini A, Torri A, Sommariva D. Accuracy <strong>of</strong> calculated serum low-<strong>de</strong>nsity lipoprotein cholesterol for<br />
assessment <strong>of</strong> coronary heart disease risk in NIDDM patients. Diabetes Care 1998;21:1397-1402.<br />
18. Contois JH, McConnell JP, Sethi AA, et al. Apolipoprotein B and cardiovascular disease risk: Position statement from the<br />
AACC Lipoproteins and Vascular Diseases Division Working Group on best practices. Clin Chem 2009;55:407-419.<br />
19. Stanley I, Lichtenstein AH, Chung M, et al. Association <strong>of</strong> low-<strong>de</strong>nsity lipoprotein subfractions with cardiovascular<br />
outcomes (Systematic review). Ann Intern Med 2009;15:474-484.
<strong>6to</strong>. <strong>Congreso</strong> <strong>Virtual</strong> <strong>de</strong> <strong>Cardiología</strong> - <strong>6th</strong> <strong>Virtual</strong> <strong>Congress</strong> <strong>of</strong> Cardiology<br />
Publication: September - November/2009<br />
Your questions, contributions and commentaries will be answered<br />
by the lecturer or experts on the subject in the Epi<strong>de</strong>miology and Cardiovascular Prevention list.<br />
Please fill in <strong>de</strong> form and Press the "Send" button.<br />
Question, contribution or<br />
commentary:<br />
Name and Surname:<br />
Country: Argentina<br />
E-Mail address:<br />
Re-type Email address:<br />
Send<br />
Erase<br />
© 1994 - 2009 2009 CETIFAC - Bioengineering UNER - 6VCC ISBN 978-987-22746-1-0<br />
Updated: 10/06/2009 - DHTML JavaScript Menu By Milonic.com - Webmaster - HonCo<strong>de</strong> - pWMC