An assessment of rain-fed crop production potential in South Africa's ...
An assessment of rain-fed crop production potential in South Africa's ...
An assessment of rain-fed crop production potential in South Africa's ...

Create successful ePaper yourself
Turn your PDF publications into a flip-book with our unique Google optimized e-Paper software.
AN ASSESSMENT OF RAIN-FED CROP PRODUCTION POTENTIAL IN SOUTH<br />
AFRICA'S NEIGHBORING COUNTRIES<br />
EXECUTIVE SUMMARY<br />
<strong>South</strong> Africa uses 60% <strong>of</strong> its scarce water resources on irrigation, a substantial portion <strong>of</strong> which is<br />
used to irrigate <strong>crop</strong>s which are regarded <strong>in</strong>ternationally as <strong>ra<strong>in</strong></strong>-<strong>fed</strong> <strong>crop</strong>s. The question is<br />
therefore be<strong>in</strong>g asked about the extent <strong>of</strong> alternative <strong>production</strong> areas <strong>in</strong> southern Africa<br />
(particularly <strong>in</strong> selected neighbor<strong>in</strong>g countries) for the range <strong>of</strong> <strong>crop</strong>s which are presently produced<br />
sub-optimally under irrigation <strong>in</strong> <strong>South</strong> Africa.<br />
The objective <strong>of</strong> this study is therefore to provide an answer to this question with adequate<br />
confidence to allow the rational pursuit <strong>of</strong> this concept which could have far-reach<strong>in</strong>g mutual<br />
benefit for southern African countries.<br />
The countries that were considered are Mozambique, Zimbabwe, Malawi and Zambia.<br />
The <strong>assessment</strong> was based on a broad (“desk-top”) regional evaluation <strong>of</strong> soils, topography and<br />
climate, which were, <strong>in</strong> turn, used to def<strong>in</strong>e and demarcate agro-ecological zones <strong>in</strong> which a range<br />
<strong>of</strong> <strong>crop</strong>s can be grown commercially under <strong>ra<strong>in</strong></strong>-<strong>fed</strong> conditions.<br />
The study used two ma<strong>in</strong> characterization systems to def<strong>in</strong>e the agro-ecological zones, namely the<br />
climate-based Koppen-Geiger Climate System (KGCS) (ref. 16) and the US Department <strong>of</strong><br />
Agriculture‟s, Natural Resources Conservation Service - Land Classification System (LCS) (ref. 9).<br />
The estimation <strong>of</strong> <strong>crop</strong> <strong>production</strong> areas with<strong>in</strong> the agro-ecological zones was then ref<strong>in</strong>ed by the<br />
exclusion <strong>of</strong> reserve land, areas <strong>of</strong> high population (urban and peri-urban environments) and areas<br />
<strong>of</strong> unsuitable topography for <strong>crop</strong> <strong>production</strong>. These exclusions are referred to as the “pr<strong>in</strong>cipal<br />
exclusions”.<br />
A provision was then made for secondary exclusions which <strong>in</strong>clude areas committed to alternative<br />
land-use such as rangeland and afforestation and scattered areas <strong>of</strong> unsuitable soils such as<br />
wetlands, river<strong>in</strong>e areas and eroded areas.<br />
This broad <strong>assessment</strong> revealed that the four target countries possess a net area <strong>of</strong> about<br />
26,6 million ha <strong>of</strong> high-<strong>potential</strong> <strong>ra<strong>in</strong></strong>-<strong>fed</strong> <strong>crop</strong>p<strong>in</strong>g land (referred to as “Premium” land use <strong>potential</strong>)<br />
with the follow<strong>in</strong>g breakdown per country:<br />
Zambia<br />
Mozambique<br />
Zimbabwe<br />
Malawi<br />
11,1 million ha<br />
8,8 million ha<br />
6,3 million ha<br />
0,4 million ha<br />
The <strong>ra<strong>in</strong></strong>-<strong>fed</strong> <strong>crop</strong> <strong>production</strong> <strong>potential</strong> <strong>in</strong>cludes a wide range <strong>of</strong> summer field <strong>crop</strong>s such as maize<br />
soybean, dry bean, groundnuts and sorghum which are adapted to parts <strong>of</strong> all four <strong>of</strong> the target<br />
countries and w<strong>in</strong>ter <strong>ra<strong>in</strong></strong>-<strong>fed</strong> field <strong>crop</strong>s such as wheat, barley and dry pea which can be grown<br />
extensively <strong>in</strong> all the countries except Mozambique.
The selected neighbour<strong>in</strong>g countries therefore display a rich <strong>potential</strong> for <strong>ra<strong>in</strong></strong>-<strong>fed</strong> <strong>crop</strong> <strong>production</strong><br />
and, <strong>in</strong> the context <strong>of</strong> the SADC countries as a whole, provide a highly significant opportunity for<br />
agricultural development <strong>in</strong> the region and an opportunity to substitute high-<strong>potential</strong> <strong>ra<strong>in</strong></strong>-<strong>fed</strong> <strong>crop</strong><br />
<strong>production</strong> for expensive and water-<strong>in</strong>efficient irrigation <strong>of</strong> annual field <strong>crop</strong>s <strong>in</strong> <strong>South</strong> Africa.<br />
The four countries experience a number <strong>of</strong> major socio-economic const<strong>ra<strong>in</strong></strong>ts to the exploitation <strong>of</strong><br />
this excellent <strong>potential</strong>. The const<strong>ra<strong>in</strong></strong>ts <strong>in</strong>clude land tenure issues (the majority <strong>of</strong> the high<br />
<strong>potential</strong> <strong>ra<strong>in</strong></strong>-<strong>fed</strong> <strong>crop</strong>p<strong>in</strong>g area is occupied by subsistence farmers on communally owned land),<br />
population (the high rural population spread presents a challenge to commercialisation <strong>of</strong><br />
agriculture), present land use (widespread subsistence farm<strong>in</strong>g), poor or lack<strong>in</strong>g <strong>in</strong>frastructure and<br />
poor agricultural support services., However the const<strong>ra<strong>in</strong></strong>ts are not considered <strong>in</strong>surmountable.<br />
With the appropriate vision, <strong>in</strong>vestment and support from the governments <strong>of</strong> the respective<br />
countries there are significant opportunities for extensive commercial agricultural development<br />
which could <strong>in</strong>volve and benefit local farmers and their communities. The recent examples <strong>of</strong><br />
<strong>South</strong> African farmers operat<strong>in</strong>g successfully <strong>in</strong> Mozambique and Zambia, with full government<br />
back<strong>in</strong>g, have shown that these const<strong>ra<strong>in</strong></strong>ts can be overcome.<br />
Whilst the pr<strong>in</strong>cipal objective <strong>of</strong> this study is to identify areas that are suited to <strong>ra<strong>in</strong></strong>-<strong>fed</strong> <strong>crop</strong><br />
<strong>production</strong>, the existence <strong>of</strong> a considerable network <strong>of</strong> largely „un-tapped‟ surface water resources,<br />
especially <strong>in</strong> Zambia and Mozambique is highlighted. There is therefore an opportunity for<br />
expanded utilisation <strong>of</strong> the water resources <strong>in</strong> these countries for irrigation where there is a higher<br />
irrigation <strong>potential</strong>, <strong>in</strong> terms <strong>of</strong> both soils and climate, than exists for many <strong>of</strong> the irrigation areas <strong>of</strong><br />
<strong>South</strong> Africa.
AN ASSESSMENT OF RAIN-FED CROP PRODUCTION POTENTIAL<br />
IN SOUTH AFRICA'S NEIGHBORING COUNTRIES<br />
TABLE OF CONTENTS<br />
Page<br />
1 INTRODUCTION ................................................................................................................... 1<br />
2 METHODOLOGY .................................................................................................................. 1<br />
3 PRESENT AGRICULTURAL PROFILE IN THE SELECTED COUNTRIES .......................... 2<br />
3.1 MOZAMBIQUE ............................................................................................................. 2<br />
3.2 ZAMBIA........................................................................................................................ 3<br />
3.3 MALAWI ....................................................................................................................... 3<br />
3.4 ZIMBABWE .................................................................................................................. 4<br />
4 CLIMATE CLASSIFICATION ................................................................................................ 4<br />
4.1 INTRODUCTION .......................................................................................................... 4<br />
4.2 ZONE CODING ............................................................................................................ 5<br />
5 SOIL AND LAND USE MAPPING ......................................................................................... 8<br />
5.1 INTRODUCTION .......................................................................................................... 8<br />
5.2 THE USDA LAND CLASSIFICATION SYSTEM (LCS) ................................................ 8<br />
5.3 AREAS EXCLUDED FROM THE LAND CLASSES IN THE STUDY AREA .............. 10<br />
5.3.1 Pr<strong>in</strong>cipal exclusions ........................................................................................ 10<br />
6 COMBINED SUITABILITY ANALYSIS ................................................................................ 14<br />
6.1 PREMIUM LAND USE POTENTIAL AND POPULATION OVERLAY ........................ 14<br />
6.2 AGRO-ECOLOGICAL ZONES BASED ON “PREMIUM” LAND-USE POTENTIAL,<br />
CLIMATIC ZONES AND PRIMARY EXCLUSIONS ................................................... 14<br />
6.3 SECONDARY EXCLUSIONS ..................................................................................... 14<br />
6.4 NET HIGH-POTENTIAL CROPPING AREAS (km 2 ) .................................................. 15<br />
7 CROP SUITABILITY ........................................................................................................... 17<br />
8 CONSTRAINTS TO THE DEVELOPMENT OF THE EXTENSIVE RAIN-FED CROPPING<br />
POTENTIAL ........................................................................................................................ 21<br />
9 IRRIGATION........................................................................................................................ 21<br />
10 CONCLUSIONS .................................................................................................................. 22<br />
APPENDICES
Appendix A<br />
Appendix B<br />
Appendix C<br />
Appendix D<br />
Notes on Mapp<strong>in</strong>g<br />
Eswaran‟s def<strong>in</strong>itions <strong>of</strong> Land Quality<br />
Climate Information<br />
References
1 INTRODUCTION<br />
<strong>South</strong> Africa uses about 60% <strong>of</strong> its scarce water resources on irrigation, a substantial<br />
portion <strong>of</strong> which is used to irrigate <strong>crop</strong>s which are regarded <strong>in</strong>ternationally as <strong>ra<strong>in</strong></strong>-<strong>fed</strong><br />
<strong>crop</strong>s. The question is therefore be<strong>in</strong>g asked about the extent <strong>of</strong> alternative <strong>production</strong><br />
areas <strong>in</strong> southern Africa (particularly <strong>in</strong> selected neighbour<strong>in</strong>g countries) for the range <strong>of</strong><br />
<strong>crop</strong>s which are presently produced sub-optimally under irrigation <strong>in</strong> <strong>South</strong> Africa.<br />
The objective <strong>of</strong> this study is to provide an answer to this question with adequate<br />
confidence to allow the rational pursuit <strong>of</strong> this concept which could have far-reach<strong>in</strong>g<br />
mutual benefit for southern African countries. The countries that were considered are<br />
Mozambique, Zimbabwe, Malawi and Zambia.<br />
2 METHODOLOGY<br />
The <strong>assessment</strong> was based on a broad (“desk-top”) regional evaluation <strong>of</strong> soils,<br />
topography and climate, which were, <strong>in</strong> turn, used to def<strong>in</strong>e and demarcate agroecological<br />
zones <strong>in</strong> which a range <strong>of</strong> <strong>crop</strong>s can be grown commercially under <strong>ra<strong>in</strong></strong>-<strong>fed</strong><br />
conditions.<br />
The study used two ma<strong>in</strong> characterization systems to def<strong>in</strong>e the agro-ecological zones,<br />
namely the climate-based Koppen-Geiger Climate System (KGCS) (ref. 16) and the US<br />
Department <strong>of</strong> Agriculture‟s, Natural Resources Conservation Service - Land<br />
Classification System (LCS) (ref. 9). The estimation <strong>of</strong> <strong>crop</strong> <strong>production</strong> areas with<strong>in</strong> the<br />
agro-ecological zones was then ref<strong>in</strong>ed by the exclusion <strong>of</strong> reserve land, areas <strong>of</strong> high<br />
population (urban and peri-urban environments) and areas <strong>of</strong> unsuitable topography for<br />
<strong>crop</strong> <strong>production</strong>. These exclusions are referred to as the “pr<strong>in</strong>cipal exclusions”.<br />
A provision was then made for secondary exclusions which <strong>in</strong>clude areas committed to<br />
alternative land-use such as rangeland and afforestation and scattered areas <strong>of</strong><br />
unsuitable soils such as wetlands, river<strong>in</strong>e areas and eroded areas.<br />
Agro-ecological zones are shown and the area (km2) estimated. Each zone <strong>in</strong>cludes <strong>crop</strong><br />
types which are grouped <strong>in</strong>to the categories <strong>of</strong> “Summer <strong>ra<strong>in</strong></strong>-<strong>fed</strong> field <strong>crop</strong>s” (maize,<br />
sorghum, soybean, groundnut, dry-bean and cotton), “W<strong>in</strong>ter <strong>ra<strong>in</strong></strong>-<strong>fed</strong> field <strong>crop</strong>s” (wheat,<br />
barley and dry-pea), “Sub-tropical fruits and nuts” (usually requir<strong>in</strong>g at least<br />
supplementary irrigation) and perennial field <strong>crop</strong>s (sugarcane) which may be grown<br />
under <strong>ra<strong>in</strong></strong>-<strong>fed</strong> or irrigated conditions, but where full irrigation is most common.<br />
The study also addresses key const<strong>ra<strong>in</strong></strong>ts that would have to be addressed <strong>in</strong> each<br />
country if the susta<strong>in</strong>able implementation <strong>of</strong> the concept is to be achieved. Such<br />
const<strong>ra<strong>in</strong></strong>ts <strong>in</strong>clude present socio-economic circumstances, land tenure and <strong>in</strong>frastructure.<br />
Crop Production Potential<br />
1<br />
F<strong>in</strong>al<br />
March 2010
3 PRESENT AGRICULTURAL PROFILE IN THE SELECTED COUNTRIES<br />
3.1 MOZAMBIQUE<br />
Mozambican agriculture is characterized by smallhold<strong>in</strong>gs. Of the 3.6 million families <strong>in</strong><br />
Mozambique, 87% are dependent on agriculture for their livelihoods; 98% <strong>of</strong> these<br />
families have no formal land titles. The average size <strong>of</strong> a hold<strong>in</strong>g is 1.24 ha and the<br />
predom<strong>in</strong>ant farm<strong>in</strong>g system is based on the <strong>ra<strong>in</strong></strong>-<strong>fed</strong> <strong>production</strong> <strong>of</strong> cereals and tubers.<br />
These smallhold<strong>in</strong>gs are farmed us<strong>in</strong>g manual labour and hand tools with only m<strong>in</strong>imal<br />
use <strong>of</strong> chemical <strong>in</strong>puts, animal traction, farm mach<strong>in</strong>ery, and tools that are more<br />
sophisticated. <strong>An</strong>y <strong>in</strong>puts that are used are mostly acquired through the <strong>in</strong>formal<br />
economy. This type <strong>of</strong> farm<strong>in</strong>g system imposes physical limits on the area that can be<br />
cultivated and the yields that can be generated; a natural limit is therefore also imposed<br />
on the total quantity <strong>of</strong> food that can be produced for self-consumption and/or for sale.<br />
Over 80% <strong>of</strong> the total area <strong>of</strong> cultivated land is used for the <strong>production</strong> <strong>of</strong> staple food<br />
<strong>crop</strong>s; maize and cassava are the staples produced by the overwhelm<strong>in</strong>g majority <strong>of</strong><br />
hold<strong>in</strong>gs, with maize, cassava and cowpeas compris<strong>in</strong>g 60% <strong>of</strong> the total cultivated land.<br />
Cereals (maize, sorghum, rice and millet) account for 46% <strong>of</strong> the total area cultivated,<br />
cassava for 17%, beans for 11%, and oilseeds for 9%. Horticulture is produced on only<br />
5% <strong>of</strong> the land and cash <strong>crop</strong>s (sugar cane, cotton, tea, oilseeds, tobacco) are cultivated<br />
on just 6%. In addition, 40% <strong>of</strong> all households make use <strong>of</strong> <strong>in</strong>digenous plants and herbs<br />
for food and/or medic<strong>in</strong>al purposes.<br />
The family agriculture system is characterized by a family labour force and low levels <strong>of</strong><br />
mechanization. In addition productivity, per hectare, is low. Hence, the <strong>potential</strong> for<br />
agricultural growth is significant.<br />
The social division <strong>of</strong> labour <strong>in</strong> agriculture <strong>in</strong>volves the whole family. There is usually little<br />
use <strong>of</strong> labour from outside the household. Women are the basis <strong>of</strong> agricultural <strong>production</strong>;<br />
they are responsible for land preparation, digg<strong>in</strong>g, weed<strong>in</strong>g and harvest<strong>in</strong>g. They help to<br />
transport, store and market surplus <strong>production</strong>.<br />
As a result <strong>of</strong> the civil war the ma<strong>in</strong> <strong>in</strong>frastructure has been destroyed and is <strong>in</strong> the<br />
process <strong>of</strong> reconstruction. The rural population, therefore, has "limited" access to<br />
markets. Alternative <strong>of</strong>f-farm <strong>in</strong>come sources are, for <strong>in</strong>stance, seasonal labour and, <strong>in</strong><br />
decl<strong>in</strong><strong>in</strong>g order, other forms <strong>of</strong> wage labour, fish<strong>in</strong>g trade, and sale <strong>of</strong> farm products. One<br />
would expect that the <strong>of</strong>f-farm <strong>in</strong>come is low, but an FAO focus study on rural non-farm<br />
<strong>in</strong>come <strong>in</strong> develop<strong>in</strong>g countries [3] po<strong>in</strong>ts out the importance <strong>of</strong> non-rural <strong>in</strong>come, which<br />
accounts for up to 25% <strong>of</strong> the total farm <strong>in</strong>come.<br />
Commercial agriculture is extremely limited at present, particularly <strong>in</strong> the context <strong>of</strong> the<br />
vast agricultural <strong>potential</strong> <strong>of</strong> the country. Exceptions <strong>in</strong>clude concession areas that have<br />
been made available to expatriate farm<strong>in</strong>g <strong>in</strong>itiatives, irrigation projects (particularly <strong>in</strong> the<br />
south on the Maputo River where rice and vegetables are grown on a semi-commercial<br />
basis - ref. 5, 9, 11, 22 and 24).<br />
Crop Production Potential<br />
2<br />
F<strong>in</strong>al<br />
March 2010
3.2 ZAMBIA<br />
Although Zambia has a relatively high urban population, approximately 45% <strong>of</strong> the total<br />
population (4.6 million people) are poor people <strong>in</strong> rural areas. Of the 950 000 rural<br />
households, 97% are <strong>in</strong>volved <strong>in</strong> subsistence <strong>crop</strong> <strong>production</strong>. Most <strong>of</strong> the arable land is<br />
under a traditional/communal tenure system. Cultivation rights (rather than land<br />
ownership) are granted by the chief through the village headman. Small-scale farmers<br />
account for a large share <strong>of</strong> the maize <strong>crop</strong> (more than 60% <strong>of</strong> Zambia‟s cultivated area).<br />
There is a trend <strong>of</strong> <strong>in</strong>creas<strong>in</strong>g numbers <strong>of</strong> households <strong>in</strong> the small-scale subsistence<br />
category while the number <strong>of</strong> medium- and large-scale farmers has rema<strong>in</strong>ed unchanged.<br />
Nevertheless Zambia boasts a far higher degree <strong>of</strong> commercial <strong>crop</strong> <strong>production</strong> than<br />
Mozambique and Malawi. Commercial agricultural <strong>production</strong> has a large exportorientated<br />
component.<br />
Growth <strong>in</strong> the small-scale agriculture sector could <strong>potential</strong>ly impact on poverty reduction<br />
and national economic growth. This assumption is based on the strong l<strong>in</strong>kages between<br />
agriculture and poor people‟s livelihoods <strong>in</strong> Zambia, provided that sufficient numbers <strong>of</strong><br />
the rural poor are actually able to access the benefits <strong>of</strong> agricultural commercialisation.<br />
There would appear to be opportunities for small-scale farmers to diversify from maize<br />
<strong>in</strong>to more marketable <strong>crop</strong>s, and this is confirmed by a pattern <strong>of</strong> decl<strong>in</strong><strong>in</strong>g maize<br />
<strong>production</strong>. Commercial agricultural <strong>production</strong> <strong>in</strong> Zambia is focussed ma<strong>in</strong>ly on maize,<br />
soybean, c<strong>of</strong>fee, tobacco, fresh flowers, fresh vegetables, cotton l<strong>in</strong>t and sugar.<br />
Production areas (commercial and subsistence) for 2001 were estimated at 600 000 ha<br />
maize, 165 000 ha cassava, 135 000 ha groundnut, 50 000 ha cotton, 38 000 ha<br />
sorghum, 17 000 ha sugarcane, 13 000 ha soybean and 12 000 ha wheat (ref. 17 and 24).<br />
3.3 MALAWI<br />
Malawian agriculture is also characterized by smallhold<strong>in</strong>gs. In 2000 the agricultural<br />
population was estimated to be 11 million people, with 85% <strong>of</strong> the total population liv<strong>in</strong>g <strong>in</strong><br />
rural areas. Malawi is one <strong>of</strong> the most densely populated countries <strong>in</strong> sub-Saharan Africa.<br />
Population density rises from 46 persons/km 2 <strong>in</strong> the northern region to 144/km 2 <strong>in</strong> the<br />
south, with the most populated districts such as the Shire Highlands <strong>in</strong> the south<br />
conta<strong>in</strong><strong>in</strong>g over 265 persons/km 2 . July 2006 population was estimated at 13,0 million and<br />
the growth rate 2.38%/annum.<br />
Most <strong>of</strong> the arable land is under a traditional/communal tenure system. Cultivation rights,<br />
rather than ownership, are granted by the chief through the village headman. By the late<br />
1980s over 56% <strong>of</strong> households were on hold<strong>in</strong>gs <strong>of</strong> less than 1 ha, and a further 20% on<br />
1.0-1.5 ha. Ra<strong>in</strong>-<strong>fed</strong> agriculture predom<strong>in</strong>ates, dependant on a s<strong>in</strong>gle <strong>ra<strong>in</strong></strong>y season<br />
between November and April. Only 10 000 ha <strong>of</strong> land is currently irrigated, 5% <strong>of</strong> the<br />
<strong>potential</strong> irrigated area, largely on sugar estates. Other irrigated <strong>crop</strong>s <strong>in</strong>clude rice and<br />
vegetables.<br />
Maize is the ma<strong>in</strong> staple <strong>of</strong> the Malawian diet, cover<strong>in</strong>g 76% <strong>of</strong> smallholder farmland.<br />
Other food <strong>crop</strong>s <strong>in</strong>clude rice, sorghum and millet. Legumes, beans, pigeon pea and<br />
groundnuts are traditionally grown by smallholders.<br />
Crop Production Potential<br />
3<br />
F<strong>in</strong>al<br />
March 2010
The area planted to cassava, <strong>of</strong>ten <strong>in</strong>ter<strong>crop</strong>ped with maize, has <strong>in</strong>creased sharply over<br />
the past 10 years particularly <strong>in</strong> the densely populated southern areas. Tobacco is the<br />
dom<strong>in</strong>ant cash <strong>crop</strong>, provid<strong>in</strong>g 71% <strong>of</strong> export earn<strong>in</strong>g from both the large-scale and smallscale<br />
farm<strong>in</strong>g sectors. Other cash <strong>crop</strong>s <strong>in</strong>clude cotton, sugar, tea and c<strong>of</strong>fee (ref. 2, 10<br />
and 15).<br />
3.4 ZIMBABWE<br />
The Zimbabwean agricultural <strong>in</strong>dustry has, as is well known, undergone massive change<br />
s<strong>in</strong>ce 2000 as a result <strong>of</strong> a government decision to confiscate land from “White”<br />
commercial farmers. This policy together with the overall collapse <strong>of</strong> the Zimbabwean<br />
economy has, over the last ten years, resulted <strong>in</strong> a dramatic decl<strong>in</strong>e <strong>in</strong> <strong>production</strong> <strong>of</strong> both<br />
small-scale and commercial agricultural <strong>production</strong> <strong>in</strong> the country. For the purposes <strong>of</strong><br />
this study the <strong>production</strong> “picture” <strong>in</strong> Zimbabwe <strong>in</strong> 2000 is outl<strong>in</strong>ed as a measure <strong>of</strong> the<br />
agricultural <strong>potential</strong> <strong>of</strong> Zimbabwe. In that year, the farm<strong>in</strong>g <strong>in</strong>dustry consisted <strong>of</strong> about<br />
700 000 small scale farmers on nearly 20 million hectares (28 ha average farm size). The<br />
ma<strong>in</strong> <strong>crop</strong>s grown were maize (60% <strong>of</strong> national consumption), cotton (85% <strong>of</strong> national<br />
<strong>production</strong>) beans, groundnuts and sorghum.<br />
In 2000 there were about 5 500 large-scale commercial farmers, occupy<strong>in</strong>g about 8 million<br />
hectares <strong>of</strong> land, employ<strong>in</strong>g 350 000 workers. The ma<strong>in</strong> <strong>crop</strong>s grown <strong>in</strong>cluded flue cured<br />
tobacco (250 000 t/a), maize (1 000 000 t/a for g<strong>ra<strong>in</strong></strong> and the livestock <strong>in</strong>dustry), sugar<br />
(600 000 t/a), horticultural <strong>crop</strong>s and a wide range <strong>of</strong> other g<strong>ra<strong>in</strong></strong> <strong>crop</strong>s.<br />
Ra<strong>in</strong>-<strong>fed</strong> agriculture predom<strong>in</strong>ates, dependant on a s<strong>in</strong>gle <strong>ra<strong>in</strong></strong>y season between<br />
November and April. About 175 000 ha <strong>of</strong> land was irrigated <strong>in</strong> 2000 largely on sugar<br />
estates, orchard estates, vegetable farms and tobacco farms. The irrigation <strong>potential</strong> <strong>of</strong><br />
Zimbabwe is estimated at about 350 000 ha <strong>in</strong> terms <strong>of</strong> available (developed water<br />
resources and favourably positioned irrigable soils).<br />
4 CLIMATE CLASSIFICATION<br />
4.1 INTRODUCTION<br />
The Koppen Climate Classification system (as amended and improved over time and now<br />
commonly known as the Koppen-Geiger Climate System (KGCS) (ref. 16) is an empirical<br />
system that divides the Earth <strong>in</strong>to a number <strong>of</strong> climatic zones (six <strong>in</strong> total) based on the<br />
concept that „native‟ vegetation is the best expression <strong>of</strong> climate. The system also<br />
considers average annual and monthly temperatures and <strong>ra<strong>in</strong></strong>fall - and its seasonality.<br />
Thus vegetation distribution comb<strong>in</strong>ed with this basic meteorological data def<strong>in</strong>es the<br />
several climatic zones and sub-zones (see Appendix C).<br />
At the „world scale‟ it can be appreciated that anomalies will occur, and that<br />
approximations <strong>of</strong> zonal boundaries cannot be avoided. The presence <strong>of</strong> mounta<strong>in</strong>s,<br />
proximity to large bodies <strong>of</strong> water, altitude, movement <strong>of</strong> air masses, ocean currents etc<br />
strongly <strong>in</strong>fluence climate and <strong>in</strong>troduce complexities that result <strong>in</strong> local differences to<br />
regional zones. However, the KCGS effectively <strong>in</strong>tegrates such sub-regional differences<br />
Crop Production Potential<br />
4<br />
F<strong>in</strong>al<br />
March 2010
y <strong>in</strong>corporat<strong>in</strong>g the exist<strong>in</strong>g vegetation as the primary <strong>in</strong>dicator, with temperature and<br />
<strong>ra<strong>in</strong></strong>fall <strong>in</strong>fluenc<strong>in</strong>g the group<strong>in</strong>gs.<br />
As the detail <strong>of</strong> a study <strong>in</strong>creases (with mapp<strong>in</strong>g scale decreas<strong>in</strong>g), local <strong>in</strong>fluences<br />
become more pronounced and other systems, better suited to local and sub-regional<br />
plann<strong>in</strong>g, would be more appropriate. Examples would be the Land Type mapp<strong>in</strong>g <strong>of</strong><br />
<strong>South</strong> Africa, with soil surveys at 1:50 000 and mapp<strong>in</strong>g at 1:250 000 and land capability<br />
mapp<strong>in</strong>g for local plann<strong>in</strong>g at 1:10 000 to 1:25 000. However, at national and cont<strong>in</strong>ental<br />
scales and tak<strong>in</strong>g cognizance <strong>of</strong> the extremely limited <strong>in</strong>formation and data available on<br />
the target countries, the KGCS is effective and gives satisfactory results.<br />
It should be noted that the KGCS has recently been <strong>in</strong>corporated <strong>in</strong>to the irrigation and<br />
water plann<strong>in</strong>g computer program - SAPWAT (ref. 22).<br />
For this study, where local knowledge has identified areas that could be classified<br />
differently from a standard group<strong>in</strong>g, a change has been <strong>in</strong>corporated <strong>in</strong>to the mapp<strong>in</strong>g.<br />
<strong>An</strong> example is the Zambezi Valley (<strong>in</strong> Zimbabwe) where the „local‟ climate <strong>of</strong> the valley is<br />
decidedly different from the areas north and south. Other anomalies obviously exist, and<br />
not all have been identified or <strong>in</strong>corporated.<br />
4.2 ZONE CODING<br />
The KGCS employs a shorthand code <strong>of</strong> three letters designat<strong>in</strong>g climatic groups. There<br />
are six major groups, a sub-group for precipitation characteristics and a sub-group for<br />
temperature characteristics. The sub-groups are <strong>in</strong>troduced particularly to identify<br />
seasonal differences.<br />
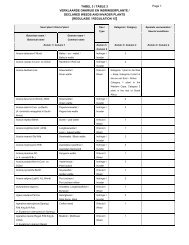
Table 1 def<strong>in</strong>es each <strong>of</strong> the group<strong>in</strong>gs. It should be noted that only major groups A, B and<br />
C are represented <strong>in</strong> the study area.<br />
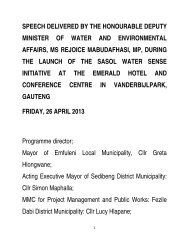
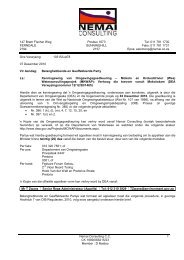
Figure 1 shows the spatial distribution <strong>of</strong> the various group<strong>in</strong>gs found <strong>in</strong> the study area.<br />
<strong>An</strong> exam<strong>in</strong>ation <strong>of</strong> the table and figure shows that only five Koppen climate group<strong>in</strong>gs<br />
occur <strong>in</strong> the area, namely Aw, BSh, Bwh, Cfb and Cwa.<br />
In terms <strong>of</strong> <strong>ra<strong>in</strong></strong>-<strong>fed</strong> <strong>crop</strong>p<strong>in</strong>g, the Zone <strong>of</strong> pr<strong>in</strong>cipal <strong>in</strong>terest is Zone C. This zone has an<br />
average temperature above 10°C <strong>in</strong> the warmest months and a coldest month average<br />
between 0°C and 18°C.The sub-group<strong>in</strong>gs are: Cfb (mild humid climate with sufficient <strong>ra<strong>in</strong></strong><br />
<strong>in</strong> all seasons and a mean monthly temperature <strong>of</strong> the warmest month below 22°C) and<br />
Cwa (mild humid climate with a dry w<strong>in</strong>ter season and a mean monthly temperature <strong>of</strong> the<br />
warmest month be<strong>in</strong>g more than 22°C). Most <strong>of</strong> the pr<strong>in</strong>cipal annual <strong>crop</strong>s applicable to<br />
this region can be grown under those conditions and these two climatic group<strong>in</strong>gs<br />
together cover most <strong>of</strong> the study area;<br />
Group A is also relevant from a <strong>ra<strong>in</strong></strong>-<strong>fed</strong> <strong>crop</strong>p<strong>in</strong>g perspective, as it def<strong>in</strong>es a tropical<br />
savannah type climate with constant high temperatures, and where all 12 months <strong>of</strong> the<br />
year have average temperatures <strong>of</strong> over 18°C. Sub-group Aw is dom<strong>in</strong>ant <strong>in</strong> the coastal<br />
areas <strong>of</strong> Mozambique where the average annual <strong>ra<strong>in</strong></strong>fall is generally high – exceed<strong>in</strong>g<br />
annual evaporation. However there is a strongly developed (albeit short) dry season with<br />
at least one month hav<strong>in</strong>g less than 60 mm <strong>ra<strong>in</strong></strong>fall.<br />
Crop Production Potential<br />
5<br />
F<strong>in</strong>al<br />
March 2010
Table 1 Koppen Geiger Climatic Zones for selected countries<br />
KOPPEN-GEIGER CLIMATIC ZONES - SOUTHERN AFRICA<br />
Climatic<br />
zones<br />
Aw<br />
A<br />
Major group<br />
Group characteristics<br />
Precipitation subgroup<br />
Temperature<br />
sub-group<br />
Ave T<br />
all<br />
months<br />
Ave<br />
T<br />
all<br />
max<br />
`<br />
T<br />
all<br />
m<strong>in</strong><br />
No.<br />
months<br />
T ave ><br />
10°C<br />
Area covered by each climatic group per country<br />
Malawi Mozambique Zambia Zimbabwe<br />
(°C) (°C) (°C) No. (km 2 ) (km 2 ) (km 2 ) (km 2 )<br />
Wet-Dry Tropical<br />
climate ; Pttn > PET w Dry w<strong>in</strong>ters Temp range > 18 12 9 300 441 000 88 262 0<br />
Savanna biome<br />
No cold season<br />
Wet summers<br />
>250 mm total 16°C 7% 56% 12% 0%<br />
All months <<br />
250 mm/month<br />
Dry climate<br />
Hot year<br />
Bwh B<br />
w Dry w<strong>in</strong>ters h round > 18 > 4 0 37,507 0 8,532<br />
PET > Pttn<br />
Wet summers 0% 5% 0% 3%<br />
BSh B<br />
Dry climate<br />
Steppe Biome PET ><br />
S Semi arid h<br />
Hot year<br />
round > 18 > 4 6 398 121 000 43 331 127 000<br />
200-750 mm <strong>ra<strong>in</strong></strong> > 0 7% 14% 7% 39%<br />
Pttn<br />
Cfb C Mild, humid climate f<br />
Some pptn <strong>in</strong> all<br />
months<br />
b<br />
Warm<br />
summers < 22 > 0 > 4 5 718 35 861 22 037 131 000<br />
Short dry season 6% 5% 3% 29%<br />
Cwa C Mild, humid climate w Dry w<strong>in</strong>ters a<br />
Hot<br />
summers > 22 > 0 > 4 73 000 137 000 573 000 125 000<br />
Wet summers;<br />
50% Pttn 79% 19% 78% 29%<br />
<strong>in</strong> warmest 6<br />
months<br />
94 416 772 368 726 630 391 532<br />
Crop Production Potential<br />
6<br />
F<strong>in</strong>al<br />
March 2010
Figure 1<br />
Classification <strong>of</strong> climate <strong>in</strong> selected countries<br />
Group B, which does not provide susta<strong>in</strong>able <strong>ra<strong>in</strong></strong>-<strong>fed</strong> <strong>crop</strong>p<strong>in</strong>g conditions, comprises arid<br />
and semi-rid areas where precipitation is less than <strong>potential</strong> evapotranspiration. Subgroup<br />
BWh occurs <strong>in</strong> southern Zimbabwe and <strong>in</strong> the south-western region <strong>of</strong><br />
Mozambique. BSh occurs <strong>in</strong> the south-west <strong>of</strong> Zambia, western Zimbabwe and southern<br />
and central Mozambique.<br />
Crop Production Potential<br />
7<br />
F<strong>in</strong>al<br />
March 2010
5 SOIL AND LAND USE MAPPING<br />
5.1 INTRODUCTION<br />
Relatively detailed soil mapp<strong>in</strong>g, at scales <strong>of</strong> 1:1 million or greater, has been carried out<br />
on an ad hoc basis over most <strong>of</strong> the study area (some 2 000 000 km 2 ). Some isolated<br />
mapp<strong>in</strong>g, particularly as the basis for agricultural development, has been carried out at the<br />
detailed scales <strong>of</strong> 1:10 000 and up to 1:2 000. However, the pedological systems used <strong>in</strong><br />
all four countries have differed considerably. To consolidate these maps would require<br />
significant <strong>in</strong>put from pedologists.<br />
For this specific exercise <strong>of</strong> determ<strong>in</strong><strong>in</strong>g the <strong>crop</strong>p<strong>in</strong>g <strong>potential</strong> <strong>of</strong> the four countries, it was<br />
necessary to adopt a common soil identification approach. Scale is important as the<br />
larger the scale the more soil types appear, and the complexity <strong>of</strong> analysis dramatically<br />
<strong>in</strong>creases. Too small a scale results <strong>in</strong> a reduction <strong>of</strong> usefulness <strong>of</strong> the maps and data.<br />
Dur<strong>in</strong>g the 1990s, the United States Department <strong>of</strong> Agriculture (USDA) undertook an<br />
exercise to accumulate soil survey data to produce a world soils map, based on the twelve<br />
pr<strong>in</strong>cipal taxonomic units <strong>of</strong> the USDA pedological system. The data base <strong>in</strong>corporated a<br />
variety <strong>of</strong> soil surveys carried out over time and employ<strong>in</strong>g many different classification<br />
systems. The soils <strong>of</strong> Africa were mapped at a scale <strong>of</strong> 1:12 million.<br />
The 1:12 million mapp<strong>in</strong>g – which covers the four-country study area, was considered to<br />
be the best available map for the detail required for this study. Unfortunately, the USDA<br />
Soil Taxonomy system is not widely used <strong>in</strong> southern Africa or well understood by<br />
agronomists <strong>in</strong> this region. Correlation with the <strong>South</strong> African Soil Taxonomic System is<br />
not straightforward, and no attempt is made <strong>in</strong> this report to match the systems. The<br />
USDA system has, however, been adapted and expanded from a “Soil Types” to a “Land<br />
Capability” type system or “Agro-Ecological” zon<strong>in</strong>g system. This can then be related to<br />
<strong>crop</strong>p<strong>in</strong>g <strong>potential</strong>. The expansion <strong>of</strong> the USDA pedology system has been effectively<br />
carried out by Eswaran et.al. (ref. 9) and this approach has been adopted <strong>in</strong> this study to<br />
classify the arable <strong>potential</strong> <strong>of</strong> the soils <strong>in</strong> the target countries.<br />
5.2 THE USDA LAND CLASSIFICATION SYSTEM (LCS)<br />
In 1996, under the auspices <strong>of</strong> the World Soil Resources Survey Division, USDA Natural<br />
Resources Conservation Service, an important publication authored by Eswaran et al,<br />
(ref. 9) related the 1:12 million soils maps to a „Soil Quality‟ maps. This identified soil<br />
areas with similar <strong>potential</strong>s for susta<strong>in</strong>able development, and had the effect <strong>of</strong> convert<strong>in</strong>g<br />
the pedology map <strong>in</strong>to a readily understandable Land Capability map.<br />
Eswaran identified five land classes, and whilst accept<strong>in</strong>g that the mapp<strong>in</strong>g scale was<br />
relatively small, it was considered that the classes so identified were reasonably accurate<br />
when the results were compared to <strong>in</strong>dividual maps <strong>of</strong> greater detail.<br />
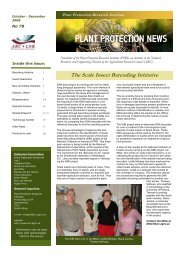
The five classes are: Premium land, High <strong>potential</strong> land, Medium <strong>potential</strong> land, Low<br />
<strong>potential</strong> land and areas which are def<strong>in</strong>ed as Unsusta<strong>in</strong>able land. The LSC classes are<br />
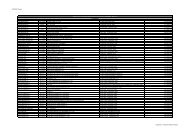
described <strong>in</strong> Table 2, their distribution <strong>in</strong> the study area is shown <strong>in</strong> Figure 2 and the<br />
estimated area (ha) <strong>of</strong> each class <strong>in</strong> the four countries is given <strong>in</strong> Table 3.<br />
Crop Production Potential<br />
8<br />
F<strong>in</strong>al<br />
March 2010
Table 2 Land classification system for southern Africa (after Eswaran, ref. 9)<br />
Land classification<br />
Ma<strong>in</strong> soil types found show<strong>in</strong>g dom<strong>in</strong>ant characteristics<br />
General <strong>potential</strong><br />
Soil groups<br />
<strong>in</strong>clude<br />
(USDA taxonomy system)<br />
Some characteristics<br />
Premium land Alfisols Moderate to high base status<br />
Clay (Argillic) B horizon<br />
High <strong>potential</strong> land Ultisols Clay horizon but low base status; high <strong>ra<strong>in</strong></strong>fall areas<br />
Some Oxisols<br />
Highly weathered, red colouration, low clay<br />
Medium <strong>potential</strong> land Oxisols Highly weathered, red colouration, low clay<br />
Some Ultisols<br />
Acid; low base status<br />
Low <strong>potential</strong> land Inceptisols Undeveloped soils<br />
Some Aridisols<br />
Some Entisols<br />
Dry, light coloured, some sal<strong>in</strong>e/sodic.<br />
Young m<strong>in</strong>eral soils<br />
Unsusta<strong>in</strong>able Mixed Many soil types.<br />
Degraded with low <strong>crop</strong>p<strong>in</strong>g <strong>potential</strong><br />
The International Soil Reference and Information Centre (ISRIC) mapp<strong>in</strong>g series <strong>of</strong> 2003<br />
(ref. 15) provides a very much more detailed study <strong>of</strong> <strong>South</strong>ern Africa, where geology, soil<br />
type and ter<strong>ra<strong>in</strong></strong> are <strong>in</strong>cluded to produce „Soster Units‟, but these classification units are<br />
too detailed for the requirements <strong>of</strong> this study. Similarly, the FAO (UNESCO) „Major Soils<br />
for Africa‟, 2007, at a scale <strong>of</strong> 1:5 million is available, but is considerably more detailed<br />
than the USDA mapp<strong>in</strong>g, and is also too detailed for the requirements <strong>of</strong> this study.<br />
However these systems could be valuable for any follow-up work that may arise from this<br />
study.<br />
Table 2 Land classification show<strong>in</strong>g areas per country (km 2 and %)<br />
Land classification<br />
Malawi Mozambique Zambia Zimbabwe<br />
(km 2 ) (%) (km 2 ) (%) (km 2 ) (%) (km 2 ) (%)<br />
Premium land 19 064 20 266 427 35 143 369 20 220 729 57<br />
High <strong>potential</strong> land 0 0 0 0 250 355 35 0 0<br />
Medium <strong>potential</strong> land 21 960 23 143 973 19 100 632 14 5 672 1<br />
Low <strong>potential</strong> land 52 952 56 147 969 19 150 240 21 77 001 20<br />
Unsusta<strong>in</strong>able 0 0 213 874 28 79 435 11 87 096 22<br />
Total 93 976 772 244 724 031 390 498<br />
Crop Production Potential<br />
9<br />
F<strong>in</strong>al<br />
March 2010
Figure 2<br />
Land classification<br />
5.3 AREAS EXCLUDED FROM THE LAND CLASSES IN THE STUDY AREA<br />
In order to estimate the area <strong>of</strong> available land with high <strong>potential</strong> for grow<strong>in</strong>g <strong>ra<strong>in</strong></strong>-<strong>fed</strong> field<br />
<strong>crop</strong>s, two ma<strong>in</strong> assumptions were made. Firstly only the two <strong>of</strong> the land classes,<br />
“Premium land” and “High <strong>potential</strong> land” are considered <strong>in</strong> the analysis and certa<strong>in</strong> area<br />
exclusions are made for other forms <strong>of</strong> land use<br />
5.3.1 Pr<strong>in</strong>cipal exclusions<br />
Reserve land<br />
There is a considerable area <strong>of</strong> land that has been set aside with<strong>in</strong> each <strong>of</strong> the four<br />
countries for conservation purposes, <strong>in</strong>clud<strong>in</strong>g environmentally sensitive areas, tourist<br />
attractions and other protected areas <strong>of</strong> national and <strong>in</strong>ternational <strong>in</strong>terest. This study has<br />
adopted the mapp<strong>in</strong>g del<strong>in</strong>eations <strong>of</strong> the International Union for the Conservation <strong>of</strong><br />
Nature (IUCN) (ref. 13). These maps del<strong>in</strong>eate exist<strong>in</strong>g conservation areas (e.g. game<br />
reserves, national parks, wetlands, etc) but also <strong>in</strong>clude areas that are deemed<br />
ecologically sensitive, and are targeted for <strong>in</strong>clusion or expansion <strong>in</strong> terms <strong>of</strong> exist<strong>in</strong>g<br />
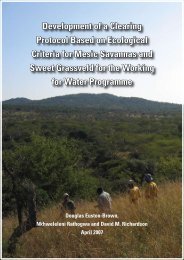
protected areas. Figure 3 shows the pr<strong>in</strong>cipal IUCN reserve areas.<br />
Crop Production Potential<br />
10<br />
F<strong>in</strong>al<br />
March 2010
EXCLUSIONS: LAKES, RESERVE AND STEEP LAND, HIGH POPULATIONS, RIVERS, ETC<br />
River<br />
Reserve areas<br />
Steep ter<strong>ra<strong>in</strong></strong><br />
Lakes<br />
Populations > 250/km 2<br />
Capital City<br />
Figure 3<br />
Pr<strong>in</strong>cipal exclusion from possible <strong>crop</strong>p<strong>in</strong>g areas<br />
Population concentrations<br />
<strong>An</strong>other land use that must be considered is urban development and population density.<br />
A gridded population map <strong>of</strong> Africa produced by CIESIN (Columbia University – compiled<br />
<strong>in</strong> 2005) was used as the basis for assess<strong>in</strong>g population distribution <strong>in</strong> this study area<br />
(Figure 3 and Figure 4).<br />
Crop Production Potential<br />
11<br />
F<strong>in</strong>al<br />
March 2010
PREMIUM AGRICULTURAL LAND WITH OVERLAY OF<br />
POPULATION DENSITY > 25/km 2<br />
Figure 4<br />
Premium agricultural land and population distribution<br />
CIESIN has def<strong>in</strong>ed six population density groups (persons per km 2 ):<br />
1 000.<br />
The capital cities <strong>of</strong> the four countries (Harare, Maputo, Lilongwe and Lusaka) all have<br />
more than 1 000 persons per km 2 . Many <strong>of</strong> the bigger towns (e.g. Bulawayo, Blantyre,<br />
Beira, Nampula, Kitwe/Ndola etc.) have similar large populations, but such densities with<strong>in</strong><br />
consolidated urban areas are not widespread <strong>in</strong> these countries. The populations are<br />
mostly rural, which <strong>in</strong>cludes many smaller towns and villages.<br />
The number <strong>of</strong> urban areas (spatial areas where population group<strong>in</strong>gs >5 000) together<br />
with total populations is given <strong>in</strong> Table 4 (latest dependable data for all four countries is at<br />
year 2000).<br />
Crop Production Potential<br />
12<br />
F<strong>in</strong>al<br />
March 2010
Table 4: Population details for four southern African countries<br />
Country<br />
Number <strong>of</strong> urban<br />
areas<br />
Population (2000)<br />
Country area<br />
(km 2 )<br />
Malawi 31 11 308 000 94 958<br />
Mozambique 69 18 292 000 777 123<br />
Zambia 35 10 421 000 745 317<br />
Zimbabwe 23 12 627 000 389 055<br />
The large majority <strong>of</strong> land <strong>in</strong> Zambia (>80%) has an average population <strong>in</strong> the CIESIN<br />
group<strong>in</strong>g 5-24 people/km 2 . Zimbabwe has approximately equal areas <strong>of</strong> 5-24 and 25-249<br />
people/km 2 . Mozambique has 45% <strong>of</strong> 5-24 people/km 2 , 35% 5-24 people/km 2 and 20%<br />
25-249 people/km 2 . Malawi has by far the highest density <strong>of</strong> people over their area, with<br />
88% 25-249 people/km 2 , 7% 1-4 people/km 2 (<strong>in</strong> the mounta<strong>in</strong>ous areas) and 5% 250-999<br />
people/km 2 .<br />
It can be seen that a very small percentage <strong>of</strong> the study area has population densities <strong>in</strong><br />
the group<strong>in</strong>gs larger than 249 people/km 2 .<br />
The CIESIN map shows that <strong>in</strong> some areas – particularly Malawi (as a whole), the<br />
Zimbabwe highveld and the Mozambique coastal areas are densely populated. Other<br />
areas, <strong>in</strong>clud<strong>in</strong>g northern and central Zambia and the Mozambique <strong>in</strong>terior, have low<br />
populations.<br />
Whilst population density is important <strong>in</strong> respect <strong>of</strong> availability <strong>of</strong> land for <strong>crop</strong>p<strong>in</strong>g<br />
purposes, it is also important <strong>in</strong> terms <strong>of</strong> land tenure, land occupation patterns and labour<br />
availability. In general, small numbers <strong>of</strong> people would <strong>in</strong>dicate that a relatively large area<br />
is available for <strong>crop</strong>p<strong>in</strong>g. However, at the scale <strong>of</strong> mapp<strong>in</strong>g used for this study, population<br />
distribution (apart from towns and cities) is not considered to have a significant <strong>in</strong>fluence<br />
on demarcat<strong>in</strong>g agricultural land use, and is only shown as an overlay to <strong>in</strong>dicate<br />
population pressure on the land.<br />
Topography<br />
The soil types and their availability for <strong>crop</strong>p<strong>in</strong>g are strongly <strong>in</strong>fluenced by topography.<br />
Land with slopes above 8% is usually excluded from row-<strong>crop</strong> agriculture. Malawi and<br />
Mozambique are especially penalized <strong>in</strong> terms <strong>of</strong> slope. Zambia and Zimbabwe benefit<br />
from their extensive plateau areas and are ma<strong>in</strong>ly affected by their escarpments<br />
bracket<strong>in</strong>g major river valleys. Much <strong>of</strong> the steeper land is forested, either <strong>in</strong>digenous<br />
(<strong>in</strong>clud<strong>in</strong>g dense bush) or under plantation. More <strong>of</strong> this land is expected to be planted to<br />
commercial forests <strong>in</strong> future.<br />
Allied to topography, but also a factor on its own, is soil depth. In Africa <strong>in</strong> general, it has<br />
been estimated that more than 50% <strong>of</strong> the soils are problematic <strong>in</strong> terms <strong>of</strong> effective depth<br />
for <strong>in</strong>tensive <strong>crop</strong> <strong>production</strong> (Eswaran) (ref. 9).<br />
Crop Production Potential<br />
13<br />
F<strong>in</strong>al<br />
March 2010
A soil map at the scale used <strong>in</strong> this study will not usually be able to discrim<strong>in</strong>ate aga<strong>in</strong>st<br />
steepness <strong>of</strong> slope <strong>in</strong> the pedology group<strong>in</strong>gs. A broad del<strong>in</strong>eation <strong>of</strong> steep and or broken<br />
ter<strong>ra<strong>in</strong></strong> has therefore been mapped for removal from the high-<strong>potential</strong> <strong>crop</strong>p<strong>in</strong>g areas.<br />
The identification and del<strong>in</strong>eation <strong>of</strong> these areas has been sourced from a number <strong>of</strong><br />
topographic maps, pr<strong>in</strong>cipal amongst which are the ISRIC depository <strong>of</strong> Africa maps at<br />
Wagen<strong>in</strong>gen <strong>in</strong> the Netherlands and Wikipedia relief maps (<strong>in</strong>ternet).<br />
Crops such as tea, c<strong>of</strong>fee, orchard <strong>crop</strong>s and some food security <strong>crop</strong>s could be grown <strong>in</strong><br />
these “excluded” areas, but for commercial-scale grow<strong>in</strong>g <strong>of</strong> g<strong>ra<strong>in</strong></strong>s and other field <strong>crop</strong>s,<br />
these areas would be unsuitable. The areas excluded, based on topography, are shown<br />
<strong>in</strong> Figure 3.<br />
6 COMBINED SUITABILITY ANALYSIS<br />
6.1 PREMIUM LAND USE POTENTIAL AND POPULATION OVERLAY<br />
Figure 4 shows a comb<strong>in</strong>ation <strong>of</strong> the Premium and High <strong>potential</strong> land-use classes which<br />
have been comb<strong>in</strong>ed, and for the purposes <strong>of</strong> this study, have been termed the “Premium<br />
agricultural land-use” class. The “Premium” land-use class, <strong>in</strong> turn, overlays the<br />
population group<strong>in</strong>g 25 to 249 persons per km 2 . This group<strong>in</strong>g is considered to be<br />
significant <strong>in</strong> that it <strong>in</strong>dicates some pressure on the land (but not excessive), but also<br />
<strong>in</strong>dicates the availability <strong>of</strong> labour and probably some usable <strong>in</strong>frastructure.<br />
6.2 AGRO-ECOLOGICAL ZONES BASED ON “PREMIUM” LAND-USE POTENTIAL,<br />
CLIMATIC ZONES AND PRIMARY EXCLUSIONS<br />
Figure 5 shows the comb<strong>in</strong>ation <strong>of</strong> (a) the Premium land-use class, (b) the climatic zones<br />
that are suitable for <strong>ra<strong>in</strong></strong>-<strong>fed</strong> <strong>crop</strong> <strong>production</strong> (Cfb, Cwa and Aw optimal and BSh suboptimal)<br />
and (c) the primary exclusions that are described above. The result is four agroecological<br />
zones, three <strong>of</strong> which are optimal and one sub-optimal for <strong>ra<strong>in</strong></strong>-<strong>fed</strong> <strong>crop</strong><br />
<strong>production</strong>.<br />
6.3 SECONDARY EXCLUSIONS<br />
Secondary exclusions from the high-<strong>potential</strong> <strong>crop</strong> <strong>production</strong> areas are discussed here<br />
because they cannot be <strong>in</strong>corporated <strong>in</strong>to the above GIS component <strong>of</strong> the analysis as<br />
they can only be quantified on a percentage-<strong>of</strong>-land-area basis.<br />
The secondary exclusions conta<strong>in</strong> such items as: small towns, villages and various<br />
<strong>in</strong>frastructure, heavily populated rural areas, afforestation, scattered areas <strong>of</strong> broken land<br />
and rocky out<strong>crop</strong>s, badly eroded (degraded) areas, local wetlands, streams and rivers,<br />
sal<strong>in</strong>e and sodic areas, d<strong>ra<strong>in</strong></strong>age-ways, flood pla<strong>in</strong>s, dams, roads and other servitudes,<br />
land established for graz<strong>in</strong>g and rangelands and forests.<br />
For the purposes <strong>of</strong> this study the secondary exclusions have been estimated at 50% <strong>of</strong><br />
the Premium land-use class. This is an arbitrary estimate based on experience and a<br />
wide range <strong>of</strong> practical evidence <strong>in</strong> southern Africa.<br />
Crop Production Potential<br />
14<br />
F<strong>in</strong>al<br />
March 2010
PREMIUM AGRICULTURAL LAND<br />
INCLUDING CLIMATIC POTENTIAL<br />
Figure 5<br />
Premium agricultural land <strong>in</strong>clud<strong>in</strong>g climatic suitability<br />
6.4 NET HIGH-POTENTIAL CROPPING AREAS (km 2 )<br />
The net high-<strong>potential</strong> <strong>crop</strong>p<strong>in</strong>g area (km2) for each <strong>of</strong> the selected countries, based on<br />
the three high-<strong>potential</strong> climatic zones Cbf, Cwa and Aw , the “Premium” land-use class<br />
and secondary reductions, is shown <strong>in</strong> Table 5.<br />
Table 5 Net high <strong>potential</strong> <strong>crop</strong>p<strong>in</strong>g areas (km 2 )<br />
Country<br />
Net area for high <strong>potential</strong><br />
<strong>crop</strong>p<strong>in</strong>g (km 2 )<br />
Malawi 4 022<br />
Mozambique 88 722<br />
Zambia 110 828<br />
Zimbabwe 63 261<br />
Total 266 832<br />
Crop Production Potential<br />
15<br />
F<strong>in</strong>al<br />
March 2010
The total net area <strong>of</strong> 266 832 km 2 (26,6 million ha) <strong>of</strong> high-<strong>potential</strong> <strong>crop</strong>p<strong>in</strong>g area,<br />
constitutes about 13% <strong>of</strong> the total land area <strong>of</strong> the four countries. This compares with<br />
about 3,2 million ha (3.0%) for <strong>South</strong> Africa.<br />
The net area (km 2 ) <strong>of</strong> high-<strong>potential</strong> <strong>crop</strong>p<strong>in</strong>g area for each <strong>of</strong> the ma<strong>in</strong> climatic zones is<br />
shown <strong>in</strong> Table 6. The table <strong>in</strong>cludes the area (km 2 ) <strong>of</strong> high <strong>potential</strong> before the<br />
secondary exclusions are deducted.<br />
Table 6<br />
Net high <strong>potential</strong> <strong>crop</strong>p<strong>in</strong>g areas (km 2 ) for each <strong>of</strong> the high <strong>potential</strong><br />
climatic zones<br />
Country<br />
Secondary<br />
reduction <strong>of</strong><br />
Premium land<br />
area<br />
(%)<br />
Climatic zones<br />
Aw Cfb Cwa<br />
Total<br />
Malawi 0 3 437 476 4 129 8 042<br />
50 1 719 238 2 065 4 022<br />
Mozambique<br />
0 157 480 0 19 964 177 444<br />
50 78 740 0 9 982 88 722<br />
Zambia 0 3 372 3 723 214 559 221 654<br />
50 1 686 1 862 107 280 110 828<br />
Zimbabwe 0 0 84 982 41 539 126 521<br />
50 0 42 491 20 770 63 261<br />
Total<br />
0 164 289 89 181 280 191 533 661<br />
50 82 145 44 591 140 096 266 832<br />
Expressed <strong>in</strong> hectares, the countries possess the follow<strong>in</strong>g areas <strong>of</strong> high-<strong>potential</strong><br />
<strong>crop</strong>p<strong>in</strong>g land:<br />
Zambia 11,1 million ha<br />
Mozambique 8,8 million ha<br />
Zimbabwe 6,3 million ha<br />
Malawi 0,4 million ha<br />
Clearly, the study area has a rich <strong>potential</strong> for <strong>ra<strong>in</strong></strong>-<strong>fed</strong> <strong>crop</strong> <strong>production</strong> and, <strong>in</strong> the context<br />
<strong>of</strong> the SADC countries as a whole, provides a highly significant opportunity for agricultural<br />
development <strong>in</strong> the region and an opportunity to substitute high-<strong>potential</strong> <strong>ra<strong>in</strong></strong>-<strong>fed</strong> <strong>crop</strong><br />
<strong>production</strong> for expensive and water-<strong>in</strong>efficient irrigation <strong>of</strong> annual field <strong>crop</strong>s <strong>in</strong> <strong>South</strong><br />
Africa.<br />
Crop Production Potential<br />
16<br />
F<strong>in</strong>al<br />
March 2010
7 CROP SUITABILITY<br />
A range <strong>of</strong> <strong>crop</strong>s has been considered for their suitability to the climatic zones def<strong>in</strong>ed<br />
above. The <strong>crop</strong>s have been grouped <strong>in</strong>to the follow<strong>in</strong>g broad categories:<br />
(1) Summer annual <strong>crop</strong>s which <strong>in</strong>clude maize, soybean, groundnuts, cotton and<br />
sorghum. Of these, maize and groundnuts are the most widely grown under<br />
irrigation <strong>in</strong> <strong>South</strong> Africa;<br />
(2) W<strong>in</strong>ter annual <strong>crop</strong>s which <strong>in</strong>clude wheat, barley and dry pea. Of these, wheat is<br />
the most widely grown under irrigation <strong>in</strong> <strong>South</strong> Africa;<br />
(3) Perennial sub-tropical fruit and nuts and sugarcane. Most <strong>of</strong> these <strong>crop</strong>s are grown<br />
under irrigation <strong>in</strong> <strong>South</strong> Africa<br />
Table 7 lists these <strong>crop</strong>s and describes the climatic and soil conditions that are required<br />
for their optimum <strong>production</strong>. A suitability matrix between <strong>crop</strong>s, climate and soil is<br />
derived from the data conta<strong>in</strong>ed <strong>in</strong> this table.<br />
Table 8 shows the adaptability <strong>of</strong> these <strong>crop</strong>s to the selected high-<strong>potential</strong> climatic<br />
zones. Adaptability is described <strong>in</strong> terms <strong>of</strong> four categories; “Suitable”, “Marg<strong>in</strong>al”, “Not<br />
Suited” and “Suitable under Irrigation” It should be noted that all <strong>crop</strong>s would probably<br />
benefit from supplementary irrigation, especially where <strong>ra<strong>in</strong></strong> is concentrated <strong>in</strong> a limited<br />
number <strong>of</strong> months. However, <strong>ra<strong>in</strong></strong>-<strong>fed</strong> agriculture is commonly practiced <strong>in</strong> the Cwa and<br />
Cfb areas, as the <strong>ra<strong>in</strong></strong> mostly is derived from the Inter-Tropical Convergence Zone<br />
<strong>in</strong>fluence which (with the obvious exception <strong>of</strong> drought years) is a relatively reliable <strong>ra<strong>in</strong></strong><br />
bear<strong>in</strong>g system.<br />
However, <strong>in</strong> respect <strong>of</strong> cotton and sugarcane, excellent grow<strong>in</strong>g areas do exist but<br />
irrigation is essential – not the least because they have a long grow<strong>in</strong>g period and are<br />
„<strong>in</strong>ter-seasonal‟.<br />
Table 9 lists those <strong>crop</strong>s that are well adapted to the high-<strong>potential</strong> climatic zones <strong>of</strong> each<br />
country and quantifies the area available on high-<strong>potential</strong> soils for their <strong>production</strong>. The<br />
<strong>crop</strong>s considered <strong>in</strong> the table are summer annual <strong>crop</strong>s, w<strong>in</strong>ter annual <strong>crop</strong>s and<br />
sugarcane.<br />
It should be noted that w<strong>in</strong>ter <strong>crop</strong>p<strong>in</strong>g is made viable <strong>in</strong> the “suitable‟ areas through<br />
specialized <strong>crop</strong>p<strong>in</strong>g practices as the area is dom<strong>in</strong>ated by long dry periods and/or where<br />
temperatures may not be low enough for flower<strong>in</strong>g or frosts may occur after flower<strong>in</strong>g. For<br />
example, early plant<strong>in</strong>g <strong>of</strong> short season wheat and barley varieties is practiced where soil<br />
moisture levels from the previous <strong>ra<strong>in</strong></strong>y season are high enough.<br />
Crop Production Potential<br />
17<br />
F<strong>in</strong>al<br />
March 2010
Table 3<br />
Requirements for optimum growth <strong>of</strong> <strong>crop</strong>s selected for consideration <strong>in</strong> the study area<br />
Crop Production Potential<br />
18<br />
F<strong>in</strong>al<br />
March 2010
Table 8<br />
Crop adaptability to the high-<strong>potential</strong> climate zones <strong>of</strong> the study area<br />
Koppen<br />
<strong>An</strong>nual <strong>crop</strong>s<br />
Perennial <strong>crop</strong>s<br />
Geiger<br />
climate<br />
groups<br />
Summer W<strong>in</strong>ter Sub-tropical fruit Plantation<br />
maize sorghum soybean groundnut dry-bean cotton wheat barley dry-pea orange mango sugarcane<br />
Cwa suitable suitable suitable suitable suitable not suited not suited not suited not suited suit.+ irrig. not suited marg<strong>in</strong>al<br />
Cfb suitable suitable suitable suitable suitable not suited suitable suitable suitable suitable not suited not suited<br />
Aw suitable suitable marg<strong>in</strong>al marg<strong>in</strong>al marg<strong>in</strong>al marg<strong>in</strong>al not suited not suited not suited not suited suitable suit.+ irrig.<br />
BSh not suited marg<strong>in</strong>al not suited not suited not suited suit.+ irrig. suit.+ irrig. suit.+ irrig. suit.+ irrig. not suited suit.+ irrig. suit.+ irrig.<br />
Bwh not suited marg<strong>in</strong>al not suited not suited not suited suit.+ irrig. not suited not suited not suited not suited suit.+ irrig. suit.+ irrig.<br />
suitable<br />
grown as an 'out <strong>of</strong> season' <strong>crop</strong> <strong>in</strong> Spr<strong>in</strong>g or Autumn<br />
Crop Production Potential<br />
19<br />
F<strong>in</strong>al<br />
March 2010
Table 9<br />
The adaptability and area (km 2 ) <strong>of</strong> summer annual <strong>crop</strong>s w<strong>in</strong>ter annual<br />
<strong>crop</strong>s and sugarcane <strong>in</strong> the high-<strong>potential</strong> climatic zones <strong>in</strong> each <strong>of</strong> the<br />
countries <strong>in</strong> the study area<br />
Country<br />
Cwa Cfb Aw BSh<br />
(km 2 ) / suitable <strong>crop</strong>s<br />
Total (km 2 )<br />
Malawi 2 065 238 1 719 474 4 496<br />
maize maize maize Cotton<br />
sorghum sorghum sorghum Wheat<br />
soybean soybean sugarcane Barley<br />
groundnut groundnut dry-pea<br />
dry-bean dry-bean Sugarcane<br />
wheat<br />
barley<br />
dry pea<br />
Mozambique 9 982 0 78 740 6 546 95 268<br />
maize maize Cotton<br />
sorghum sorghum Wheat<br />
soybean sugarcane Barley<br />
groundnut<br />
dry-bean<br />
dry-pea<br />
Sugarcane<br />
Zambia 107 280 1 862 1 686 2 735 113 563<br />
maize maize maize Cotton<br />
sorghum sorghum sorghum Wheat<br />
soybean soybean sugarcane Barley<br />
groundnut groundnut dry-pea<br />
dry-bean dry-bean Sugarcane<br />
wheat<br />
barley<br />
dry pea<br />
Zimbabwe 20 770 42 491 0 13 539 76 800<br />
maize maize Cotton<br />
sorghum sorghum Wheat<br />
soybean soybean Barley<br />
groundnut groundnut dry-pea<br />
dry-bean dry-bean Sugarcane<br />
wheat<br />
barley<br />
dry-pea<br />
Total 140 097 44 591 82 145 23 294 290 127<br />
Notes:<br />
requires significant irrigation<br />
summer <strong>crop</strong><br />
w<strong>in</strong>ter <strong>crop</strong><br />
Crop Production Potential<br />
20<br />
F<strong>in</strong>al<br />
March 2010
8 CONSTRAINTS TO THE DEVELOPMENT OF THE EXTENSIVE RAIN-FED<br />
CROPPING POTENTIAL<br />
The socio-economic const<strong>ra<strong>in</strong></strong>ts to the development <strong>of</strong> the extensive <strong>ra<strong>in</strong></strong>-<strong>fed</strong> <strong>crop</strong>p<strong>in</strong>g<br />
<strong>potential</strong> that exists <strong>in</strong> the selected neighbour<strong>in</strong>g countries, though not <strong>in</strong>surmountable,<br />
should not be underestimated. Of particular importance is:<br />
The communal land tenure system that exists throughout the study area and the<br />
wide-spread population sprawl that mitigates aga<strong>in</strong>st large-scale commercial <strong>crop</strong><br />
<strong>production</strong>. This can to some extent be overcome through jo<strong>in</strong>t-venture<br />
arrangements between local communities and commercial operators or land<br />
leas<strong>in</strong>g from the government/communities (particularly <strong>in</strong> low-population areas)<br />
The poor <strong>in</strong>frastructure (or lack <strong>of</strong> <strong>in</strong>frastructure <strong>in</strong> some areas) with respect to<br />
roads, power supply, storage facilities and agricultural support <strong>in</strong>frastructure and<br />
services such as <strong>in</strong>put supplies, transport, operat<strong>in</strong>g credit facilities, mechanical<br />
equipment ma<strong>in</strong>tenance etc, places a special challenge on any commercial<br />
agricultural development <strong>in</strong>itiative. However, <strong>South</strong> African farmers operat<strong>in</strong>g <strong>in</strong><br />
countries like Mozambique and Zambia, with full government back<strong>in</strong>g, have<br />
shown that these const<strong>ra<strong>in</strong></strong>t can be overcome, but at a substantial cost.<br />
The lack <strong>of</strong> a supportive political environment <strong>in</strong> Zimbabwe does, for the<br />
foreseeable future, place a serious const<strong>ra<strong>in</strong></strong>t on commercial <strong>in</strong>vestment <strong>of</strong> any<br />
mean<strong>in</strong>gful scale. The lack <strong>of</strong> any security <strong>of</strong> land tenure implies no f<strong>in</strong>ancial<br />
back<strong>in</strong>g from banks for <strong>in</strong>frastructure development and <strong>production</strong> loans which<br />
effectively stifles commercial agricultural development. However, the situation <strong>in</strong><br />
Mozambique and Zambia is far more positive with many examples <strong>of</strong> agricultural<br />
commercialisation emerg<strong>in</strong>g.<br />
9 IRRIGATION<br />
Whilst the pr<strong>in</strong>cipal objective <strong>of</strong> this study is to identify areas that are suited to <strong>ra<strong>in</strong></strong>-<strong>fed</strong><br />
<strong>crop</strong> <strong>production</strong>, the existence <strong>of</strong> a considerable network <strong>of</strong> largely „un-tapped‟ surface<br />
water resources (streams and rivers), especially <strong>in</strong> Zambia and Mozambique must, be<br />
noted.<br />
Table 10 <strong>in</strong>dicates the low level <strong>of</strong> exploitation <strong>of</strong> water resources for irrigation <strong>in</strong> the four<br />
study countries. Figures are for 2004 (ref. 8).<br />
There is clearly an opportunity for expanded utilisation <strong>of</strong> the water resources <strong>in</strong> these<br />
countries for irrigation where there is a higher irrigation <strong>potential</strong>, <strong>in</strong> terms <strong>of</strong> both soils and<br />
climate, than exists for many <strong>of</strong> the irrigated areas <strong>of</strong> <strong>South</strong> Africa.<br />
Crop Production Potential<br />
21<br />
F<strong>in</strong>al<br />
March 2010
Table 10: Irrigated land and water consumption<br />
Country<br />
Irrigated land<br />
(2004) as a % <strong>of</strong><br />
cultivated land<br />
<strong>An</strong>nual water<br />
consumption as a %<br />
<strong>of</strong> total water<br />
resources<br />
Estimated irrigation<br />
demand<br />
(million m 3 /annum)<br />
Malawi 1.7 2.0 1 820<br />
Mozambique 4.0 1.0 3 000<br />
Zambia 0.9 1.0 1 580<br />
Zimbabwe 7.0 5.0 4 980<br />
10 CONCLUSIONS<br />
The key conclusions drawn from this study are summarised as follows:<br />
The four countries possess about 26,6 million ha <strong>of</strong> high-<strong>potential</strong> <strong>crop</strong>p<strong>in</strong>g land:<br />
o Zambia 11,1 million ha<br />
o Mozambique 8,8 million ha<br />
o Zimbabwe 6,3 million ha<br />
o Malawi 0,4 million ha<br />
The <strong>ra<strong>in</strong></strong>-<strong>fed</strong> <strong>crop</strong> <strong>production</strong> <strong>potential</strong> <strong>in</strong>cludes a wide range <strong>of</strong> summer field<br />
<strong>crop</strong>s such as maize soybean, dry bean, groundnuts and sorghum which are<br />
adapted to parts <strong>of</strong> all four <strong>of</strong> the target countries and w<strong>in</strong>ter <strong>ra<strong>in</strong></strong>-<strong>fed</strong> field <strong>crop</strong>s<br />
such as wheat, barley and dry pea which can be grown extensively <strong>in</strong> all the<br />
countries except Mozambique.<br />
The study area therefore displays a rich <strong>potential</strong> for <strong>ra<strong>in</strong></strong>-<strong>fed</strong> <strong>crop</strong> <strong>production</strong><br />
and, <strong>in</strong> the context <strong>of</strong> the SADC countries as a whole, provides a highly<br />
significant opportunity for agricultural development <strong>in</strong> the region and an<br />
opportunity to substitute high-<strong>potential</strong> <strong>ra<strong>in</strong></strong>-<strong>fed</strong> <strong>crop</strong> <strong>production</strong> for expensive and<br />
water-<strong>in</strong>efficient irrigation <strong>of</strong> annual field <strong>crop</strong>s <strong>in</strong> <strong>South</strong> Africa.<br />
The four countries experience a number <strong>of</strong> major socio-economic const<strong>ra<strong>in</strong></strong>ts to<br />
the exploitation <strong>of</strong> this excellent <strong>potential</strong>. The const<strong>ra<strong>in</strong></strong>ts <strong>in</strong>clude land tenure<br />
issues (the majority <strong>of</strong> the high <strong>potential</strong> <strong>ra<strong>in</strong></strong>-<strong>fed</strong> <strong>crop</strong>p<strong>in</strong>g area is occupied by<br />
subsistence farmers on communally owned land), population (the high rural<br />
population spread presents a challenge to commercialisation <strong>of</strong> agriculture),<br />
present land use (widespread subsistence farm<strong>in</strong>g), poor or lack<strong>in</strong>g <strong>in</strong>frastructure<br />
and poor agricultural support services., However the const<strong>ra<strong>in</strong></strong>ts are not<br />
considered <strong>in</strong>surmountable. With the appropriate vision, <strong>in</strong>vestment and support<br />
from the governments <strong>of</strong> the respective countries there are significant<br />
opportunities for extensive commercial agricultural development which could<br />
<strong>in</strong>volve and benefit local farmers and their communities. The recent examples <strong>of</strong><br />
<strong>South</strong> African farmers operat<strong>in</strong>g successfully <strong>in</strong> Mozambique and Zambia, with<br />
full government back<strong>in</strong>g, have shown that these const<strong>ra<strong>in</strong></strong>ts can be overcome.<br />
Crop Production Potential<br />
22<br />
F<strong>in</strong>al<br />
March 2010
Whilst the pr<strong>in</strong>cipal objective <strong>of</strong> this study is to identify areas that are suited to<br />
<strong>ra<strong>in</strong></strong>-<strong>fed</strong> <strong>crop</strong> <strong>production</strong>, the existence <strong>of</strong> a considerable network <strong>of</strong> largely „untapped‟<br />
surface water resources, especially <strong>in</strong> Zambia and Mozambique, is<br />
highlighted. There is therefore an opportunity for expanded utilisation <strong>of</strong> the<br />
water resources <strong>in</strong> these countries for irrigation where there is a higher irrigation<br />
<strong>potential</strong>, <strong>in</strong> terms <strong>of</strong> both soils and climate, than exists for many <strong>of</strong> the irrigated<br />
areas <strong>of</strong> <strong>South</strong> Africa.<br />
Crop Production Potential<br />
23<br />
F<strong>in</strong>al<br />
March 2010
APPENDIX A<br />
Notes on Mapp<strong>in</strong>g
Notes on mapp<strong>in</strong>g<br />
The maps used <strong>in</strong> this report are derived from maps published by:<br />
Melbourne University (Koppen Geiger Map Of Africa)<br />
USDA (Hari Eswaran report <strong>of</strong> 1996 show<strong>in</strong>g soils and land quality maps)<br />
CIESIN, Columbia University (Africa: Population Density, 2000)<br />
The maps were all published on A4 sized paper, and were subsequently copied and adjusted to<br />
show the <strong>South</strong>ern Africa Region <strong>in</strong> more detail. The polygons on the maps were abstracted<br />
and re-drawn <strong>in</strong> CAD. The scale <strong>of</strong> the orig<strong>in</strong>al maps was <strong>in</strong> the order <strong>of</strong> 1:35 000 000. It must<br />
be noted, therefore, that the maps published <strong>in</strong> this document will have lost some accuracy <strong>in</strong><br />
the abstraction process. The maps shown <strong>in</strong> this report are approximately 1:12 500 000,<br />
approximately three times larger than the orig<strong>in</strong>al mapp<strong>in</strong>g.
APPENDIX B<br />
Eswaran‟s def<strong>in</strong>itions <strong>of</strong> Land<br />
Quality
Premium land<br />
With<strong>in</strong> the study area, this land type ma<strong>in</strong>ly comprises Alfisols with some Ultisols – which are<br />
not as fertile as the Alfisols as they are more weathered and acidic. Alfisols comprise relatively<br />
young, deep, permeable soils (generally without impermeable horizons) with loamy to clayey<br />
textures and good tilth characteristics. They usually have an adequate supply <strong>of</strong> nutrients.<br />
Lands are mostly level to gently undulat<strong>in</strong>g. Water hold<strong>in</strong>g capacity is more than 150 mm/m.<br />
Cropp<strong>in</strong>g performance is generally good, and they respond well to good management. They<br />
have high resilience to degradation and can readily be brought back to previous productivity<br />
levels.<br />
High <strong>potential</strong> land<br />
Mostly Oxisol soils <strong>of</strong> low activity, highly weathered, crumbly and eluviated, hav<strong>in</strong>g no argillic<br />
(clay rich) horizon. They have dist<strong>in</strong>ctly red-coloured subsurface horizon. Also <strong>in</strong>termixed with<br />
Ultisols, which have an argillic horizon, but with low base saturation, <strong>of</strong>ten very acidic. These<br />
soil types have some m<strong>in</strong>or limitations. These may <strong>in</strong>clude, for example, root restrict<strong>in</strong>g<br />
horizons (<strong>of</strong>ten laterite) and sandy or gravelly layers.<br />
They have the <strong>potential</strong> to be highly productive with proper management – but where this is<br />
sub-optimal and <strong>in</strong>puts are limited, they can be severely stressed. Their resilience is less than<br />
the Prime Lands, and so can be permanently damaged with mismanagement<br />
Medium and Low <strong>potential</strong> lands<br />
These lands have major const<strong>ra<strong>in</strong></strong>ts for low-<strong>in</strong>put agriculture. There are high risks for resourcepoor<br />
farmers, and the probability <strong>of</strong> <strong>crop</strong> failure is high. Soil limitations <strong>in</strong>clude some <strong>of</strong> the<br />
follow<strong>in</strong>g – low organic matter, impermeable layers, surface crust<strong>in</strong>g, acidity or sal<strong>in</strong>ity, low<br />
water hold<strong>in</strong>g capacity, shallow depths. The phosphate fix<strong>in</strong>g characteristics <strong>of</strong> the more acid<br />
soils can be severe. They <strong>of</strong>ten have high water and w<strong>in</strong>d erosion risks. Soil types <strong>in</strong>clude<br />
Aridisols (dry soils, with light coloured surface horizons that may be sal<strong>in</strong>e or sodic), Inceptisols<br />
(young soils <strong>of</strong> low fertility), Entisols (light soils hav<strong>in</strong>g m<strong>in</strong>imal pr<strong>of</strong>ile development, <strong>of</strong>ten<br />
shallow and with low clay content and low water-hold<strong>in</strong>g capacity) and vertisols. The latter are<br />
<strong>in</strong>cluded due to the difficulties <strong>of</strong> their management (heavy, black swell<strong>in</strong>g clays)<br />
Unsusta<strong>in</strong>able<br />
These lands are considered very fragile <strong>in</strong> terms <strong>of</strong> agricultural development and are easily<br />
degraded. They are not productive and do not respond well to management. They require very<br />
high <strong>in</strong>vestments <strong>in</strong> order to make them productive (eg <strong>in</strong>tensive drip irrigation, w<strong>in</strong>d breaks etc).<br />
They <strong>in</strong>clude some sal<strong>in</strong>e, sodic and waterlogged areas. Soils <strong>in</strong>cluded are aridisols, entisols<br />
<strong>in</strong>ceptisols, vertisols and Oxisols – but all have been „downgraded‟ by severe climatic or erosive<br />
<strong>in</strong>fluences.
APPENDIX C<br />
Climate Information
Meteorological data<br />
Temperature and <strong>ra<strong>in</strong></strong>fall data from a number <strong>of</strong> weather stations with<strong>in</strong> the study area was<br />
compiled (see table on next page) by way <strong>of</strong> a further check on the validity <strong>of</strong> the Koppen-<br />
Geiger system and to <strong>in</strong>dicate the <strong>ra<strong>in</strong></strong>fall quantities available dur<strong>in</strong>g the plant<strong>in</strong>g season.<br />
These stations were chosen to represent, where possible, the several climatic zones <strong>in</strong> the<br />
area. The coverage is not comprehensive, however, as the stations with reliable long term data<br />
are limited. The choice <strong>of</strong> station was also made <strong>in</strong> an effort to achieve a spatially widespread<br />
network. The figure below shows the Koppen-Geiger climate zones together with the spread <strong>of</strong><br />
meteorological stations. The majority <strong>of</strong> zones comply with the parameters set by the system‟s<br />
guidel<strong>in</strong>es.<br />
Meterological stations show<strong>in</strong>g Characteristic zonal data
Climate Variability<br />
Climate variability concerns seasonal and annual variations <strong>in</strong> temperature and <strong>ra<strong>in</strong></strong>fall patterns<br />
with<strong>in</strong> and between regions. Many factors come <strong>in</strong>to play; important <strong>in</strong> this region are the w<strong>in</strong>d<br />
circulation systems, seasonal pressure systems, the ITCZ and the strength and tim<strong>in</strong>g <strong>of</strong> its<br />
southward progression, sea temperatures – and especially the cyclical El Niño <strong>South</strong>ern<br />
Oscillation (ENSO) phenomenon.<br />
Droughts and flood<strong>in</strong>g, especially <strong>of</strong> major river flood pla<strong>in</strong>s, are common; southern Africa is<br />
characterized by considerable climatic variation, both spatially and temporally and this affects<br />
both low and high <strong>ra<strong>in</strong></strong>fall areas, more especially the latter.<br />
This can be seen to add a degree <strong>of</strong> uncerta<strong>in</strong>ty to „dry-land‟ farm<strong>in</strong>g.<br />
practice throughout the world accepts weather-related risk as normal.<br />
However, farm<strong>in</strong>g<br />
The figure below gives an <strong>in</strong>dication <strong>of</strong> the long-term variability <strong>of</strong> <strong>ra<strong>in</strong></strong>fall <strong>in</strong> the study area (data<br />
records from over 80 years). The wide variation will have affected the natural vegetation and so<br />
<strong>in</strong>fluenced the Koppen approach to climatic zon<strong>in</strong>g. However, this relatively short timescale (<strong>in</strong><br />
comparison to global changes) may well not represent an equilibrium state.<br />
The agro-ecological zones – which <strong>in</strong>clude the effects <strong>of</strong> other factors such as temperature<br />
fluctuations, soils etc, are an <strong>in</strong>tegration <strong>of</strong> these <strong>in</strong>fluences and <strong>crop</strong> suitability, for any<br />
particular area - are <strong>in</strong>fluenced by a comb<strong>in</strong>ation <strong>of</strong> these limitations.<br />
Most <strong>of</strong> the summer annual <strong>crop</strong>s <strong>of</strong> commercial importance require between 500-700 mm <strong>of</strong><br />
moisture; w<strong>in</strong>ter <strong>crop</strong>s about half this amount. Consider<strong>in</strong>g the long-term average <strong>ra<strong>in</strong></strong>fall<br />
figures, it can be seen that most <strong>of</strong> the study area receives more than 600 mm, which can be<br />
considered a positive <strong>in</strong>dicator for expanded commercial <strong>crop</strong>p<strong>in</strong>g. However, the temporal<br />
distribution <strong>of</strong> this <strong>ra<strong>in</strong></strong> has not been assessed. This may be problematical <strong>in</strong> some areas –<br />
particularly <strong>in</strong> regard to the affect <strong>of</strong> moisture stress on <strong>crop</strong> sensitive growth periods.
APPENDIX D<br />
References
1. AGRHYMET Network, (2001). Information Center, FAO Rome. http://www.agrhymet .<br />
2. Agriculture and Food – Country pr<strong>of</strong>ile – Malawi. World resource Institute website.<br />
3. Aquastat – FAO Information System on Water and Agriculture,<br />
www.fao.org/nr/water/aquastat/dbases.<br />
4. Archive <strong>of</strong> Soil Maps (EuDASM) - Soil Maps <strong>of</strong> Africa. EUR 21657 EN, 386 pp.<br />
5. Bowen, Merle L. 2000. The State Aga<strong>in</strong>st Peasantry. Rural Struggles <strong>in</strong> Colonial and<br />
Postcolonial Mozambique. Charlottesville, VA: University Press <strong>of</strong> Virg<strong>in</strong>ia.<br />
6. Bot AJ, Nachtergaele FO and Young A, (2000). Land Resource Potential and<br />
Const<strong>ra<strong>in</strong></strong>ts at Regional and Country Levels. FAO 90, Rome.<br />
7. Brady N and Weil RR, (1999). The Nature and Property <strong>of</strong> soils. Twelfth Edition,<br />
Prentice Hall International.<br />
8. Chenje M and Johnson P (edit.). (1996). Water <strong>in</strong> <strong>South</strong>ern Africa (Report by SADC,<br />
IUCN and SARDC), ISBN 0-7974-1672-2<br />
9. Eswaran H et al, (1996). <strong>An</strong> Assessment <strong>of</strong> the Soil Resources <strong>of</strong> Africa <strong>in</strong> Relation to<br />
Productivity, USDA Natural Resources Conservation Service, Wash<strong>in</strong>gton DC.<br />
10. FAO, 2005/2006. Database – Malawi (website http://apps.fao.org/)<br />
11. FAO/UNESCO Soil Map <strong>of</strong> the World for Africa; Grid Version, UNEP/Grid-Geneva.<br />
12. FitzPatrick EA, (1983). Soils, Their Formation, Classification and Distribution, Longmans<br />
Group Ltd. ISBN 0-582-30116-5<br />
13. Green MJB and Pa<strong>in</strong>e J, (1997). State <strong>of</strong> the worlds protected areas at the end <strong>of</strong> the<br />
twentieth century, IUCN Commission on Protected Areas Symposium, Albany, Australia.<br />
14. ISRIC depository <strong>of</strong> Africa maps at Wagen<strong>in</strong>gen <strong>in</strong> the Netherlands and Wikipedia relief<br />
maps (<strong>in</strong>ternet).<br />
15. National Statistical Office, 2000. GoM, Lilongwe, Malawi<br />
16. Peel, MC et al, (2007), Updated World Map <strong>of</strong> the Koppen-Geiger Climate Classification.<br />
Hydrology and Earth System Sciences, 11. 1633-1644, Copernicus Publications.<br />
17. SEEPA, 2006. Climate change and African agriculture- Zambia. Policy note No.39.<br />
18. Selvaradjou SK, Montanarella L, Spaargaren O and Dent D, (2005). European Digital<br />
19. Smith M, Climwat for Cropwat, (1993). FAO Irrigation and D<strong>ra<strong>in</strong></strong>age Paper 49, FAO<br />
Rome.<br />
20. The World Bank. 2000. World Development Report 2000/2001. Attack<strong>in</strong>g Poverty.<br />
New York, N.Y.: Oxford University Press. The complete report is available on-l<strong>in</strong>e:<br />
http://worldbank.org/poverty/wdrpoverty/report/<br />
21. UN System <strong>in</strong> Mozambique. 2000. Mozambique: District Development Pr<strong>of</strong>iles.<br />
http://www.unsystmmoz.org/<br />
22. Van Heerden PS, Crosby CT et al, (2009). Integrat<strong>in</strong>g and upgrad<strong>in</strong>g <strong>of</strong> Sapwat and<br />
Planwat, Water Research Commission report no TT391/08.
23. Wester<strong>in</strong>k RM, 1995. Potential <strong>ra<strong>in</strong></strong><strong>fed</strong> <strong>crop</strong> <strong>production</strong> and land suitability for<br />
Mozambique. Nota tecnica No. 7. Do Instituto Nacional de Investigacao Agronomica.<br />
24. Zulu, B. et.al. 2007. Smallholder household maize <strong>production</strong> and market<strong>in</strong>g behavior<br />
<strong>in</strong> Zambia and its <strong>in</strong>fluence on policy. Department <strong>of</strong> agricultural Economics, Michigan<br />
State University. http://www.aec.msu.edu/fs2/zambia/wp_22.pdf