Rapid Analysis of Aminothiols by UHPLC with Boron ... - Dionex
Rapid Analysis of Aminothiols by UHPLC with Boron ... - Dionex
Rapid Analysis of Aminothiols by UHPLC with Boron ... - Dionex

Create successful ePaper yourself
Turn your PDF publications into a flip-book with our unique Google optimized e-Paper software.
mL, n=3)<br />
R² = 0.9986<br />
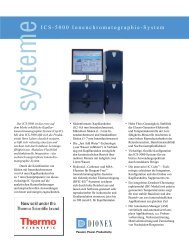
FIGURE 6. Overlay <strong>of</strong> chromatograms <strong>of</strong> standard (black trace) vs.<br />
whole blood (blue trace)<br />
2.00<br />
µA<br />
1.80<br />
R² = 0.9997<br />
R² = 0.9892<br />
1.60<br />
1.40<br />
1.20<br />
es<br />
GSSG<br />
R² = 0.9996<br />
R² = 0.9998<br />
20 25<br />
elation Slope<br />
ficient.<br />
989 0.0481<br />
.00 0.0509<br />
999 0.0736<br />
.00 0.0268<br />
.00 0.0170<br />
improved design features<br />
ensitivity. The small cell<br />
nts which helps minimize<br />
shown in Figure 5<br />
ch compound can be<br />
N) for this standard are<br />
ction (LOD) <strong>with</strong> a S/N<br />
n (LOD) <strong>with</strong> S/N ratio <strong>of</strong><br />
imately 67 pg, while the<br />
(400 pg on column)<br />
1.00<br />
0.80<br />
0.60<br />
0.40<br />
0.20<br />
-0.00<br />
-0.20<br />
CysGly<br />
GSH<br />
Methionine<br />
Whole blood<br />
5 ug/mL mix<br />
0.00 0.25 0.50 0.75 1.00 1.25 1.50 1.75 2.00 2.25 2.50 2.75 3.00 3.25 3.50 3.75 4.00 4.25 4.50 4.75 5.00<br />
Table 3. Aminothiol levels (µM) observed in whole blood (n=3) using the BDD<br />
electrode<br />
CysGly GSH Methionine GSSG<br />
Level µM 55.9±13.0 1017.2±26.2 107.4±52.7 71.1±25.9<br />
Figure 6 shows an overlay <strong>of</strong> chromatograms for a standard mixture <strong>of</strong> aminothiols<br />
and a sample <strong>of</strong> deproteinized whole blood. The levels <strong>of</strong> GSH and GSSG was<br />
easily measured in small samples <strong>of</strong> whole blood (