The development and application of a surface plasmon ... - DCU
The development and application of a surface plasmon ... - DCU
The development and application of a surface plasmon ... - DCU

You also want an ePaper? Increase the reach of your titles
YUMPU automatically turns print PDFs into web optimized ePapers that Google loves.
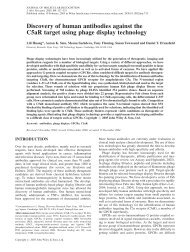
Journal <strong>of</strong> Immunological Methods 291 (2004) 11 – 25<br />
Research paper<br />
<strong>The</strong> <strong>development</strong> <strong>and</strong> <strong>application</strong> <strong>of</strong> a <strong>surface</strong> <strong>plasmon</strong><br />
resonance-based inhibition immunoassay for the determination<br />
<strong>of</strong> warfarin in plasma ultrafiltrate<br />
Brian Fitzpatrick, Richard O’Kennedy*<br />
School <strong>of</strong> Biotechnology <strong>and</strong> National Centre for Sensor Research, Dublin City University, Glasnevin, Dublin 9, Irel<strong>and</strong><br />
Received 5 January 2004; received in revised form 26 February 2004; accepted 8 March 2004<br />
Available online 5 June 2004<br />
www.elsevier.com/locate/jim<br />
Abstract<br />
Warfarin is the most widely prescribed oral anticoagulant for the management <strong>of</strong> a wide variety <strong>of</strong> thromboembolic disorders<br />
such as atrial fibrillation <strong>and</strong> deep vein thrombosis. A panel <strong>of</strong> warfarin–protein conjugates were produced <strong>and</strong> characterised<br />
<strong>and</strong> subsequently used for the production <strong>of</strong> monoclonal antibodies to warfarin. Following characterisation, the monoclonal<br />
antibodies were used in the <strong>development</strong> <strong>of</strong> a <strong>surface</strong> <strong>plasmon</strong> resonance-based inhibition immunoassay for the determination <strong>of</strong><br />
the physiologically active ‘nonprotein’-bound fraction <strong>of</strong> the drug in plasma ultrafiltrate. <strong>The</strong> inhibition immunoassay was<br />
compared with an existing high-performance liquid chromatography (HPLC) chromatographic technique for the determination<br />
<strong>of</strong> warfarin in plasma ultrafiltrate, <strong>and</strong> an excellent correlation was achieved between the two independent analytical techniques.<br />
<strong>The</strong> lig<strong>and</strong>-binding capacity <strong>and</strong> stability <strong>of</strong> various immobilised lig<strong>and</strong>s were also compared. <strong>The</strong> BIACore-based inhibition<br />
immunoassay demonstrated an assay precision range <strong>of</strong> approximately 4–250 ng/ml, which is within the clinical range <strong>and</strong><br />
demonstrated good reproducibility <strong>and</strong> robustness.<br />
D 2004 Elsevier B.V. All rights reserved.<br />
Keywords: Warfarin; Inhibition immunoassay; Surface <strong>plasmon</strong> resonance; Nonprotein bound; Ultrafiltration<br />
1. Introduction<br />
Abbreviations: RU, Response units; HPLC, high-performance<br />
liquid chromatography; BSA, bovine serum albumin; KLH, keyhole<br />
limpet haemocyanin; CM, carboxymethylated; IR, infrared; NMR,<br />
nuclear magnetic resonance; ELISA, enzyme-linked immunosorbent<br />
assay; ANOVA, analysis <strong>of</strong> variance; DMSO, dimethyl<br />
sulphoxide; HBS, HEPES-buffered saline; EDC, N-ethyl-N-(dimethylaminopropyl)-carbodiimide<br />
hydrochloride; NHS, N-hydroxysuccinimide;<br />
PDA, photo-diode array.<br />
* Corresponding author. Tel.: +353-17005319; fax: +353-<br />
17005412.<br />
E-mail address: r.okennedy@dcu.ie (R. O’Kennedy).<br />
<strong>The</strong> oral anticoagulants emerged from veterinary<br />
research carried out in the 1920s, showing that a<br />
haemorrhagic disorder affecting cattle was caused by<br />
the consumption <strong>of</strong> spoiled sweet clover hay. <strong>The</strong><br />
<strong>of</strong>fending agent was subsequently identified by Link<br />
(1943–1944) as dicoumarol (3,3V-methylenebis-4-<br />
hydroxycoumarin), which occurs during the spoilage<br />
<strong>of</strong> cured hay, whereby coumarin is oxidised to 4-<br />
hydroxycoumarin, which, when coupled with formaldehyde<br />
leads to the production <strong>of</strong> dicoumarol. Link<br />
0022-1759/$ - see front matter D 2004 Elsevier B.V. All rights reserved.<br />
doi:10.1016/j.jim.2004.03.015
12<br />
B. Fitzpatrick, R. O’Kennedy / Journal <strong>of</strong> Immunological Methods 291 (2004) 11–25<br />
<strong>and</strong> his team synthesised over 100 4-hydroxycoumarin-type<br />
compounds <strong>and</strong> found that the minimal<br />
structural requirements for anticoagulant activity<br />
were an intact 4-hydroxycoumarin residue with the<br />
3-position substituted by a carbon residue. Warfarin<br />
was subsequently synthesised (Ikawa et al., 1944)<br />
<strong>and</strong> is currently the most widely prescribed oral<br />
anticoagulant for the management <strong>of</strong> a variety <strong>of</strong><br />
thromboembolic disorders including atrial fibrillation,<br />
deep vein thrombosis <strong>and</strong> threatened stroke<br />
(Hirsh et al., 1995).<br />
Warfarin exerts its anticoagulant effect by inhibiting<br />
the posttranslational carboxylation <strong>of</strong> the vitamin<br />
K-dependent precursor proteins factors II, VII, IX<br />
<strong>and</strong> X, resulting in the production <strong>of</strong> partially carboxylated<br />
forms <strong>of</strong> these vitamin K-dependent proteins.<br />
<strong>The</strong> presence <strong>of</strong> these partially carboxylated<br />
proteins, named PIVKAs (proteins induced by vitamin<br />
K antagonism), results in a slower activation <strong>of</strong><br />
the coagulation cascade, as the g-carboxyglutamyl<br />
residues confer unique metal-binding properties to<br />
the proteins. Upon occupancy <strong>of</strong> these metal-binding<br />
sites, these proteins undergo a conformational<br />
change, which permit interactions with the phospholipid<br />
bilayers <strong>and</strong> cell membrane providing a template<br />
for the clotting mechanism (Cooke et al.,<br />
1997).<br />
Warfarin is administered orally as a racemic mixture<br />
<strong>of</strong> (R-) <strong>and</strong> (S-) warfarin <strong>and</strong> is rapidly absorbed from<br />
the gastrointestinal tract reaching peak plasma concentrations<br />
within 60–90 min following administration<br />
(King et al., 1995). Following absorption, the drug is<br />
highly bound to plasma proteins (>99%), leaving only<br />
a small fraction <strong>of</strong> the free drug available for metabolism.<br />
It is the ‘nonprotein’-bound or ‘nonprotein’-free<br />
fraction <strong>of</strong> the administered drug that dictates its<br />
pharmacokinetic pr<strong>of</strong>ile. <strong>The</strong> primary warfarin-binding<br />
site on human serum albumin (HSA) has been identified<br />
on domain II with a secondary binding site on<br />
domain I (Dockal et al., 1999). <strong>The</strong> (S-) enantiomer has<br />
been shown to have a higher affinity for HSA than the<br />
corresponding (R-) enantiomer (Bertucci et al., 1999).<br />
This high degree <strong>of</strong> protein binding predisposes warfarin<br />
to a range <strong>of</strong> possible drug interactions, which in<br />
turn can greatly affect the degree <strong>of</strong> anticoagulation<br />
achieved (Wells et al., 1994). Moreover, the (S-)<br />
enantiomer has also approximately five times the<br />
anticoagulant potency <strong>of</strong> the (R-) enantiomer.<br />
Warfarin has also shown promising results as a<br />
potent HIV-1 inhibitor in vitro, <strong>and</strong> this has led to the<br />
<strong>development</strong> <strong>of</strong> a potent orally bioavailable class <strong>of</strong><br />
5,6-dihydro-4-hydroxy-2-pyrones compounds, which<br />
are undergoing clinical trials (Thaisrivongs <strong>and</strong> Strohbach,<br />
1999). Warfarin has also demonstrated potential<br />
as an antimetastatic agent <strong>and</strong> has shown particularly<br />
promising results with small cell carcinoma <strong>of</strong> the<br />
lung, a tumour cell type that is characterised by a<br />
coagulation-associated pathway (Zacharski et al.,<br />
1984; Amirkhosravi <strong>and</strong> Francis, 1995).<br />
<strong>The</strong>re is currently a wide range <strong>of</strong> analytical<br />
techniques available for the determination <strong>of</strong> warfarin<br />
in biological fluids ranging from chromatography to<br />
phosphorescence-based measurements (Capitán-Vallvey<br />
et al., 1999; Ring <strong>and</strong> Bostick, 2000). <strong>The</strong><br />
majority <strong>of</strong> these analytical techniques involve<br />
lengthy sample pretreatment, derivatisation schemes<br />
<strong>and</strong> postcolumn reactions for the determination <strong>of</strong> the<br />
free ‘unbound’ fraction <strong>of</strong> warfarin in plasma samples<br />
<strong>and</strong>, consequently, are not routinely applicable for the<br />
detection <strong>of</strong> warfarin in clinical samples. <strong>The</strong> use <strong>of</strong><br />
chromatographic techniques relies on the inherent<br />
physicochemical properties <strong>of</strong> the analyte in question,<br />
<strong>and</strong> the measured response is usually directly proportional<br />
to the concentration <strong>of</strong> the analyte <strong>and</strong> is best<br />
represented by a linear calibration model. <strong>The</strong> physicochemical<br />
properties <strong>of</strong> a given analyte <strong>and</strong> the lack<br />
<strong>of</strong> suitable chromophoric or electrochemically active<br />
groups can therefore be limiting factors for the detailed<br />
analysis <strong>of</strong> the pharmacokinetic pr<strong>of</strong>ile <strong>of</strong><br />
particular drug molecules. Immunoassays rely on the<br />
specific interaction between antibody <strong>and</strong> antigen for<br />
analyte determination, <strong>and</strong> the measured response<br />
usually gives rise to a calibration plot that is inherently<br />
sigmoidal in nature <strong>and</strong> best represented by a<br />
four-parameter logistic fit (Findlay et al., 2000).<br />
Recent advances in antibody technology have permitted<br />
the st<strong>and</strong>ardisation <strong>of</strong> antibody preparations <strong>and</strong><br />
revolutionised their use as clinical <strong>and</strong> diagnostic<br />
tools. <strong>The</strong> capability <strong>of</strong> producing antibodies <strong>and</strong><br />
fragments there<strong>of</strong> with enhanced affinities (i.e.,<br />
K D =10<br />
15 M; Boder et al., 2000) allied with <strong>development</strong>s<br />
in transduction technologies have greatly<br />
advanced the potential <strong>of</strong> antibody-based techniques<br />
for the detection <strong>of</strong> low molecular weight analytes in<br />
solution. Similarly, given the unique specificity <strong>of</strong><br />
antibodies <strong>and</strong> the use <strong>of</strong> antibody libraries, common
B. Fitzpatrick, R. O’Kennedy / Journal <strong>of</strong> Immunological Methods 291 (2004) 11–25 13<br />
biosensor formats can now be easily <strong>and</strong> quickly<br />
adapted for the detection <strong>of</strong> specific analytes in<br />
solution without the need for developing individual<br />
chromatographic assay separation techniques. <strong>The</strong><br />
current trend in warfarin therapy is towards lower<br />
intensity treatment. Consequently, there is the need to<br />
develop more sensitive analytical techniques capable<br />
<strong>of</strong> detecting lower concentrations <strong>of</strong> warfarin in<br />
biological fluids for the accurate determination <strong>of</strong><br />
the physiological-free fraction <strong>of</strong> warfarin in plasma<br />
ultrafiltrate.<br />
Surface <strong>plasmon</strong> resonance-based techniques using<br />
BIACore have been successfully described for the<br />
detection <strong>of</strong> low molecular weight analytes (Crooks<br />
et al., 1998; Daly et al., 2000; Brennan et al., 2003).<br />
<strong>The</strong> majority <strong>of</strong> these techniques generally employ<br />
inhibition-based assay formats, whereby an equilibrium<br />
antibody–antigen mixture is passed over the<br />
<strong>surface</strong> <strong>of</strong> a functionalised chip <strong>surface</strong> (see Jönsson<br />
et al., 1991 for a more detailed description on the<br />
mode <strong>and</strong> operation <strong>of</strong> BIACore). Unbound antibody<br />
in the equilibrated mixtures is available for binding to<br />
the derivatised chip <strong>surface</strong> as the equilibrium mixtures<br />
pass over the chip <strong>surface</strong>. <strong>The</strong> measured binding<br />
response is therefore inversely proportional to the<br />
concentration <strong>of</strong> free analyte in solution. Here, we<br />
describe the <strong>development</strong> <strong>and</strong> <strong>application</strong> <strong>of</strong> a <strong>surface</strong><br />
<strong>plasmon</strong> resonance-based inhibition immunoassay for<br />
the detection <strong>of</strong> the free fraction <strong>of</strong> warfarin in plasma<br />
ultrafiltrate <strong>and</strong> comparison <strong>of</strong> the inhibition immunoassay<br />
with a chromatographic technique. <strong>The</strong> suitability,<br />
lig<strong>and</strong>-binding capacity <strong>and</strong> assay performance<br />
characteristics <strong>of</strong> various immobilised lig<strong>and</strong>s are also<br />
addressed.<br />
2. Materials <strong>and</strong> methods<br />
2.1. Equipment<br />
A Brucker 400 MHz AC400 nuclear magnetic<br />
resonance (NMR) spectrometer (Coventry, Engl<strong>and</strong>)<br />
was used for NMR analysis <strong>of</strong> 4V-aminowarfarin. A<br />
Nicloet infrared (IR) spectrometer (Madison, WI,<br />
USA) was used to generate the IR spectra <strong>of</strong> 4V-aminowarfarin.<br />
A Beckman System Gold high-performance<br />
liquid chromatography (HPLC) apparatus with photodiode<br />
array (PDA) detection (Fullerton, CA, USA) was<br />
used for the analysis <strong>of</strong> the drug–protein conjugates.<br />
Protein fractions were analysed using a Shimadzu UV-<br />
160A spectrophotometer (Kyoto, Japan). Concentration<br />
<strong>of</strong> plasma ultrafiltrate <strong>and</strong> tissue culture supernatant<br />
was carried using an Amicon Ultrafiltration Stirred<br />
Cell 8400 (Beverley, MA, USA). A BIACorek 3000<br />
biosensor instrument <strong>and</strong> CM5 Chips (Pharmacia Biosensor,<br />
St. Albans, Hertfordshire, Engl<strong>and</strong>) controlled<br />
with BIAEvaluation s<strong>of</strong>tware version 3.1 were used to<br />
perform the biosensor study. Warfarin detection by<br />
HPLC was carried out using a Supelco Discoveryk<br />
column (Bellefonte, PA, USA) <strong>and</strong> a Varian Star 9030<br />
pump, 9012 UV detector, fluorescence detector <strong>and</strong> AI-<br />
200 autosampler system modules obtained from JVA<br />
Analytical (Dublin, Irel<strong>and</strong>).<br />
2.2. Reagents<br />
4V-Nitrowarfarin, acenocoumarin (SintromR) was<br />
kindly donated by Ciba-Geigy (Dublin, Irel<strong>and</strong>).<br />
Zinc granules, acetic acid, sodium chloride, Tris,<br />
Freund’s Complete adjuvant, N-hydroxy-succinimide<br />
(NHS), N-ethyl-N-(dimethylaminopropyl)-carbodiimide<br />
hydrochloride (EDC), Ethanolamine, EDTA,<br />
Tween-20, sodium nitrite, bovine serum albumin<br />
(BSA), thyroglobulin, keyhole limpet haemocyanin<br />
(KLH), 10 kDa dialysis tubing, protein-G Sepharose<br />
4B <strong>and</strong> warfarin were all purchased from Sigma<br />
(Poole, Dorset, Engl<strong>and</strong>). BALB/c mice were purchased<br />
from Harlan UK (Bicester, Oxon, Engl<strong>and</strong>).<br />
TLC plates <strong>and</strong> silica gel grade 40 were purchased<br />
from Riedel de Haën (Hanover, Germany). Deuterated<br />
dimethyl sulphoxide (DMSO) was purchased<br />
from Aldrich Chemical (Gillingham, Dorset, Engl<strong>and</strong>).<br />
Filters (0.2 Am) were purchased from AGB<br />
Scientific (Dublin, Irel<strong>and</strong>). Acetonitrile <strong>and</strong> HPLC<br />
vials were purchased from JVA Analytical (Dublin,<br />
Irel<strong>and</strong>).<br />
2.3. Preparation <strong>and</strong> characterisation <strong>of</strong><br />
4V-aminowarfarin<br />
4V-Nitrowarfarin (2.00 g) was reduced in the<br />
presence <strong>of</strong> 3.00 g zinc <strong>and</strong> 50 ml <strong>of</strong> 30% (v/v)<br />
dilute acetic acid with constant stirring to yield the<br />
‘putative’ 4V-aminowarfarin product. 4V-Aminowarfarin<br />
was partially purified from the initial reaction<br />
mixture by filtration through Whatman filter paper
14<br />
B. Fitzpatrick, R. O’Kennedy / Journal <strong>of</strong> Immunological Methods 291 (2004) 11–25<br />
(grade number 1). <strong>The</strong> partially purified reaction<br />
mixture following filtration was then purified to<br />
homogeneity by silica gel column chromatography<br />
through a 20-cm glass column containing silica gel<br />
grade 40 using a mobile phase <strong>of</strong> methanol/chlor<strong>of</strong>orm<br />
(2:98, v/v), <strong>and</strong> 10 ml fractions was collected.<br />
Fractions were analysed by thin layer chromatography<br />
(TLC), <strong>and</strong> those fractions containing 4V-aminowarfarin<br />
were evaporated to dryness using a rotary<br />
evaporator. <strong>The</strong> reaction product 4V-aminowarfarin<br />
was characterised by a combination <strong>of</strong> IR <strong>and</strong> NMR<br />
spectral studies.<br />
2.4. Preparation <strong>and</strong> characterisation <strong>of</strong> 4V-azowarfarin–protein<br />
conjugates<br />
4V-Aminowarfarin (350 mg) was dissolved in 50 ml<br />
<strong>of</strong> a solution containing 0.1 M HCl <strong>and</strong> 7 mM<br />
potassium bromide. Ten milliliters <strong>of</strong> a 0.014 M<br />
solution <strong>of</strong> sodium nitrite was added dropwise to the<br />
solution containing 4V-aminowarfarin, <strong>and</strong> continuous<br />
stirring was maintained on an ice bath for 1 h. <strong>The</strong><br />
activated 4V-aminowarfarin solution was then added<br />
dropwise to 10 ml <strong>of</strong> a 5% (w/v) solution <strong>of</strong> bovine<br />
serum albumin (BSA), the pH maintained between 9.0<br />
<strong>and</strong> 9.5 with the simultaneous addition <strong>of</strong> 0.1 M NaOH<br />
<strong>and</strong> was stirred overnight at 4 jC (Satoh et al., 1982).<br />
<strong>The</strong> resulting dark brown solution was then dialysed<br />
against several changes <strong>of</strong> PBS, pH 7.4 <strong>and</strong> lyophilised<br />
prior to further studies. While BSA binds warfarin<br />
under physiological conditions, our studies indicated<br />
that it gave excellent levels <strong>of</strong> chemical conjugation to<br />
4V-azowarfarin. For the production <strong>of</strong> keyhole limpet<br />
haemocyanin (KLH) conjugates, the protein solution<br />
was made up in PBS, pH 7.4, containing 0.9 M NaCl,<br />
to allow for solubilisation <strong>of</strong> KLH. 4V-Aminowarfarin<br />
(100 mg) was activated <strong>and</strong> added to 40 mg <strong>of</strong> KLH<br />
<strong>and</strong> the reaction followed as described above. <strong>The</strong><br />
resulting drug–protein solution was dialysed against<br />
several changes <strong>of</strong> PBS, pH 7.4 with 1.0 M NaCl<br />
added. <strong>The</strong> resulting dark brown solution was lyophilised<br />
for further studies. <strong>The</strong> drug–protein conjugates<br />
following lyophilisation were characterised by UV<br />
spectroscopy by direct comparison <strong>of</strong> the reference<br />
spectra obtained for the drug–protein conjugate, 4Vaminowarfarin<br />
<strong>and</strong> a ‘control’ protein (i.e., a protein<br />
solution which had undergo the same chemical procedure<br />
as the conjugate solution except that the drug<br />
solution had been omitted from the coupling step)<br />
from 200 to 400 nm. HPLC-PDA studies using a<br />
Biosep SEC 4000 column were also recorded from<br />
200 to 400 nm using PBS, pH 7.4, as mobile phase at a<br />
flow rate <strong>of</strong> 1.0 ml/min.<br />
2.5. Monoclonal antibody production <strong>and</strong> purification<br />
<strong>of</strong> murine IgG by protein-G affinity chromatography<br />
Male BALB/c mice, 5–10 weeks <strong>of</strong> age, were used<br />
for the production <strong>of</strong> monoclonal antibodies to warfarin,<br />
as previously described (Fitzpatrick, 2001). All<br />
procedures involving the use <strong>of</strong> animals were approved<br />
<strong>and</strong> licensed by the Department <strong>of</strong> Health.<br />
Every precaution was taken to ensure the minimum<br />
distress to the animals. Hybridoma clones were<br />
screened for specific antibody production by direct<br />
enzyme-linked immunosorbent assay (ELISA), <strong>and</strong><br />
‘positive’ wells were propagated <strong>and</strong> cloned by limiting<br />
dilution. ‘Spent’ hybridoma supernatants from<br />
hapten-specific clones were collected <strong>and</strong> concentrated<br />
10-fold using an Amicon concentration device.<br />
Concentrated supernatant (10 ml) was passed through<br />
a column containing protein-G immobilised on<br />
Sepharose 4B, the eluate collected <strong>and</strong> passed through<br />
the column a second time. <strong>The</strong> column was then<br />
washed with 25 ml <strong>of</strong> PBS containing Tween<br />
(0.05%, v/v) <strong>and</strong> the retained protein eluted with 0.1<br />
M glycine–HCl (pH 2.5). Fractions (850 Al) were<br />
collected in eppendorf tubes containing 150 Al <strong>of</strong><br />
Tris–HCl (pH 8.5). <strong>The</strong> absorbance <strong>of</strong> each fraction<br />
was then measured at 280 nm for protein concentration<br />
determination.<br />
2.6. Sample preparation<br />
Blank plasma was filtered through an Amicon<br />
concentration device containing a 1-kDa molecular<br />
weight cut-<strong>of</strong>f membrane <strong>and</strong> collected under positive<br />
pressure <strong>and</strong> stored at 20 jC until required for<br />
further use. Antibody preparations were diluted in<br />
HEPES-buffered saline solution (HBS running buffer,<br />
pH 7.4) prior to sample analysis (i.e., nominally a<br />
1:100 dilution) <strong>and</strong> filtered through a 0.2-Am filter<br />
prior to use. A 10 mg/ml solution <strong>of</strong> warfarin was<br />
initially prepared in DMSO. Serial dilutions <strong>of</strong> warfarin<br />
were then prepared in plasma ultrafiltrate ranging<br />
from 0.48 to 500 ng/ml. An additional set <strong>of</strong> indepen-
B. Fitzpatrick, R. O’Kennedy / Journal <strong>of</strong> Immunological Methods 291 (2004) 11–25 15<br />
dent calibration st<strong>and</strong>ards <strong>of</strong> various concentrations<br />
spanning the range <strong>of</strong> the calibration plot was also<br />
prepared in plasma ultrafiltrate for each assay procedure<br />
carried out.<br />
2.7. Preparation <strong>of</strong> running buffer used in BIACore<br />
analyses<br />
HEPES-buffered saline (HBS), containing 50 mM<br />
NaCl, 10 mM HEPES, 3.4 mM EDTA <strong>and</strong> 0.05% (v/v)<br />
Tween-20, was prepared by dissolving 8.76 g <strong>of</strong> NaCl,<br />
2.56 g <strong>of</strong> HEPES, 1.27 g <strong>of</strong> EDTA <strong>and</strong> 500 Al <strong>of</strong><br />
Tween-20 in 600 ml <strong>of</strong> ultrapure water. <strong>The</strong> pH <strong>of</strong> this<br />
solution was adjusted to 7.4 with the addition <strong>of</strong> 2 M<br />
NaOH <strong>and</strong> the final volume adjusted to 1000 ml in a<br />
volumetric flask. <strong>The</strong> solution was then filtered<br />
through a 0.2-Am filter <strong>and</strong> degassed prior to use.<br />
2.8. Coupling <strong>of</strong> 4V-aminowarfarin to CM-dextran<br />
sensor chip <strong>surface</strong><br />
Initially direct immobilisation <strong>of</strong> 4V-aminowarfarin<br />
to the carboxymethylated (CM)-dextran sensor chip<br />
<strong>surface</strong> was performed external to the BIACore instrument,<br />
but it was also carried out in situ. HBS (40 Al)<br />
buffer was initially added to the well <strong>of</strong> the sensor chip<br />
for 5 min; this served to prime the chip <strong>surface</strong> <strong>and</strong> was<br />
removed using ‘lint-free’ absorbent paper. <strong>The</strong> chip<br />
<strong>surface</strong> was then activated by preparing the NHS/EDC<br />
reaction mixture, as described above, <strong>and</strong> adding 20<br />
Al <strong>of</strong> the reaction mixture to the well <strong>of</strong> the sensor chip<br />
for a period <strong>of</strong> 10 min. <strong>The</strong> EDC/NHS mixture was<br />
then removed from the sensor chip well using ‘lintfree’<br />
tissue paper. A solution <strong>of</strong> 50 Ag/ml<strong>of</strong>4V-aminowarfarin<br />
in 10 mM sodium acetate buffer (pH 4.5) was<br />
placed in the sensor chip well for 10 min. <strong>The</strong> drug<br />
solution was removed from the sensor chip well using<br />
‘lint-free’ tissue paper. <strong>The</strong> remaining unreacted sites<br />
on the chip <strong>surface</strong> were deactivated as described<br />
above. <strong>The</strong> chip was then washed extensively with<br />
water <strong>and</strong> dried under nitrogen.<br />
2.9. Coupling <strong>of</strong> 4V-azowarfarin-BSA to CM-dextran<br />
sensor chip <strong>surface</strong><br />
<strong>The</strong> carboxymethylated dextran (CM-dextran) <strong>surface</strong><br />
was activated by mixing equal volumes <strong>of</strong> 100<br />
mM N-hydroxy-succinimide (NHS) <strong>and</strong> 400 mM N-<br />
ethyl-N-(dimethylaminopropyl)-carbodiimide hydrochloride<br />
(EDC) <strong>and</strong> injecting the mixture over the<br />
sensor chip <strong>surface</strong> for 7 min at a flow rate <strong>of</strong> 5 Al/<br />
min. A solution containing 50 Ag/ml <strong>of</strong> 4V-azowarfarin–BSA<br />
in 10 mM acetate buffer (pH 4.5) was then<br />
injected over the <strong>surface</strong> for 10 min at a flow rate <strong>of</strong> 5<br />
Al/min. Unreacted sites on the sensor chip <strong>surface</strong> were<br />
then deactivated by injecting 1 M ethanolamine (pH<br />
8.5) for 7 min at a flow rate <strong>of</strong> 5 Al/min.<br />
2.10. Stability <strong>of</strong> the immobilised lig<strong>and</strong>/regeneration<br />
procedures<br />
<strong>The</strong> stability <strong>of</strong> the immobilised lig<strong>and</strong>s, namely,<br />
4V-azowarfarin-BSA <strong>and</strong> 4V-aminowarfarin, was<br />
assessed by performing consecutive binding–regeneration<br />
cycles. Antibody (40 Al) at the requisite<br />
dilution was injected over the derivatised chip<br />
<strong>surface</strong> at a flow rate <strong>of</strong> 10 Al/min <strong>and</strong> the binding<br />
response was recorded. Two successive injections <strong>of</strong><br />
5 Al <strong>of</strong> 30 mM HCl, at a flow rate <strong>of</strong> 10 Al/min,<br />
were used to dissociate the bound antibody/antigen<br />
complex from the chip <strong>surface</strong>. Greater than 100<br />
binding–regeneration cycles were conducted over<br />
each immobilised chip <strong>surface</strong>, <strong>and</strong> the measured<br />
binding response for each antibody injection was<br />
used to assess the stability (i.e., antibody-binding<br />
capacity) <strong>of</strong> the immobilised <strong>surface</strong>.<br />
2.11. Salt concentration assay<br />
Salt solutions ranging from 0.120 to 0.155 M<br />
NaCl were prepared in ultrapure water, sterile-filtered<br />
<strong>and</strong> were degassed prior to use. Antibody (80 Al)<br />
solution was mixed with 20 Al <strong>of</strong> the respective salt<br />
concentration using the BIACore autosampler <strong>and</strong><br />
was allowed to equilibrate for 5 min. <strong>The</strong> equilibrated<br />
mixtures were then r<strong>and</strong>omly injected in duplicate<br />
over the derivatised chip <strong>surface</strong> at a flow rate <strong>of</strong> 10<br />
Al/min for a period <strong>of</strong> 4 min, <strong>and</strong> the binding<br />
response was recorded. <strong>The</strong> bound antibody complex<br />
was then dissociated using 30 mM HCl.<br />
2.12. Nonspecific binding studies<br />
Nonspecific binding studies were carried out by<br />
passing antibody at the requisite dilution over both<br />
the blank CM-dextran chip <strong>surface</strong> <strong>and</strong> an immobi-
16<br />
B. Fitzpatrick, R. O’Kennedy / Journal <strong>of</strong> Immunological Methods 291 (2004) 11–25<br />
lised BSA chip <strong>surface</strong>. <strong>The</strong> binding response following<br />
each injection was used to determine the degree <strong>of</strong><br />
nonspecific binding <strong>of</strong> antibody to the blank dextran<br />
<strong>and</strong>/or immobilised BSA <strong>surface</strong>.<br />
2.13. BIACore inhibition immunoassay<br />
Antibody solution (80 Al) was mixed with 20<br />
Al <strong>of</strong> warfarin st<strong>and</strong>ard using the BIACore autosampler<br />
<strong>and</strong> was allowed to equilibrate for a period<br />
<strong>of</strong> 5 min. Samples were then injected in duplicate in<br />
r<strong>and</strong>om order at a flow rate <strong>of</strong> 10 Al/min for a<br />
period <strong>of</strong> 4 min over the derivatised chip <strong>surface</strong>,<br />
<strong>and</strong> the binding response was recorded. <strong>The</strong> bound<br />
antibody was then dissociated from the derivatised<br />
chip <strong>surface</strong> using two 30 s pulses <strong>of</strong> 30 mM HCl<br />
at a flow rate <strong>of</strong> 10 Al/min. <strong>The</strong> binding response<br />
was recorded for each warfarin st<strong>and</strong>ard concentration<br />
(R AG ) <strong>and</strong> divided by the response measured in<br />
the presence <strong>of</strong> zero antigen concentration (R 0 ) to<br />
give normalised binding responses (i.e., R AG /R 0 ). A<br />
logarithmic calibration plot was then constructed <strong>of</strong><br />
the normalised binding response versus warfarin<br />
concentration (ng/ml) using BIAEvaluationk s<strong>of</strong>tware<br />
version 3.1 <strong>and</strong> a four-parameter fit fitted to<br />
the calibration plot.<br />
2.14. HPLC studies<br />
<strong>The</strong> mobile phase for these studies was prepared by<br />
mixing 570 ml <strong>of</strong> acetonitrile with 426 ml <strong>of</strong> water<br />
<strong>and</strong> 4 ml <strong>of</strong> glacial acetic acid. <strong>The</strong> mobile phase was<br />
filtered through a 0.2-Am filter <strong>and</strong> was sonicated for<br />
20 min. Samples were analysed using a Supelco<br />
Discoveryk C18 column (150 4.6 mm, particle<br />
size 5 Am) with UV detection at 308 nm <strong>and</strong> a mobile<br />
phase flow rate <strong>of</strong> 1.0 ml/min. Postrun sample analysis<br />
<strong>of</strong> chromatograms was carried out using Varian<br />
Star s<strong>of</strong>tware (version 5.1).<br />
3. Results<br />
3.1. Stability <strong>of</strong> the immobilised lig<strong>and</strong> <strong>and</strong> nonspecific<br />
binding studies<br />
<strong>The</strong> binding capacity <strong>of</strong> directly immobilised 4Vaminowarfarin<br />
(Fig. 1) <strong>and</strong> 4V-azowarfarin–BSA (Fig.<br />
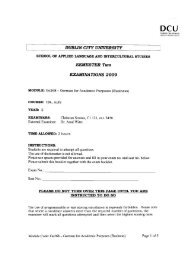
Fig. 1. Lig<strong>and</strong>-binding capacity <strong>of</strong> a 4V-aminowarfarin drug <strong>surface</strong>. One hundred forty consecutive binding–regeneration cycles <strong>of</strong> an<br />
antiwarfarin antibody over the directly immobilised 4V-aminowarfarin drug <strong>surface</strong> demonstrated a coefficient <strong>of</strong> variation for binding response<br />
over this cycle <strong>of</strong> 0.82%, with no change in the <strong>surface</strong> antibody-binding capacity (i.e., Cycle 1 = 446.2, Cycle 140 = 446.4).
B. Fitzpatrick, R. O’Kennedy / Journal <strong>of</strong> Immunological Methods 291 (2004) 11–25 17<br />
Fig. 2. Lig<strong>and</strong>-binding capacity <strong>of</strong> a 4V-azowarfarin–BSA <strong>surface</strong> following 75 consecutive binding–regeneration cycles <strong>of</strong> an antiwarfarin<br />
monoclonal antibody. <strong>The</strong> binding response can be observed to plateau after approximately 20 regeneration cycles. All assays performed using<br />
such <strong>surface</strong>s were thus exposed to at least 20 cycles prior to sample analysis. <strong>The</strong> binding response demonstrated a coefficient <strong>of</strong> variation <strong>of</strong><br />
1.88% following the initial priming cycles, with a decrease <strong>of</strong> approximately 7.2% in the antibody-binding capacity <strong>of</strong> the immobilised <strong>surface</strong><br />
over this regeneration cycle range.<br />
2) conjugate <strong>surface</strong>s was compared following a series<br />
<strong>of</strong> binding <strong>and</strong> regeneration sequences to ascertain<br />
which <strong>surface</strong> provided the optimal lig<strong>and</strong>-binding<br />
characteristics over the course <strong>of</strong> the regeneration<br />
studies. <strong>The</strong> <strong>surface</strong> regeneration studies conducted<br />
showed that the directly immobilised 4V-aminowarfarin<br />
drug <strong>surface</strong> provided excellent stability over the<br />
regeneration cycles performed (Fig. 1). <strong>The</strong> coefficient<br />
<strong>of</strong> variation <strong>of</strong> the measured antibody-binding response<br />
over the course <strong>of</strong> the 140 regeneration cycles was<br />
determined to be 0.82%, underlining the stability <strong>and</strong><br />
reproducibility <strong>of</strong> the measured binding response using<br />
the immobilised lig<strong>and</strong> 4V-aminowarfarin. Surface regeneration<br />
was achieved using two consecutive pulses<br />
<strong>of</strong> 30 mM HCl. Such <strong>surface</strong>s were found to be<br />
essentially ‘inexhaustible’ with respect to antibodybinding<br />
capacity <strong>and</strong> were in fact used for greater than<br />
1000 cycles.<br />
<strong>The</strong> immobilised 4V-azowarfarin–BSA conjugate<br />
<strong>surface</strong> initially demonstrated a relatively high decrease<br />
in antibody-binding capacity, which began to<br />
plateau after approximately 20 regeneration cycles<br />
(Fig. 2). This initial decrease in antibody-binding<br />
capacity may be attributed to poorly immobilised<br />
conjugate, <strong>and</strong> consequently all assays conducted<br />
using such <strong>surface</strong>s were subjected to at least 20<br />
binding regeneration cycles prior to sample analysis.<br />
<strong>The</strong> reduction in binding capacity <strong>of</strong> the immobilised<br />
<strong>surface</strong>, following these initial ‘priming’ regeneration<br />
cycles, showed a decrease in antibody-binding capacity<br />
<strong>of</strong> the immobilised <strong>surface</strong> <strong>of</strong> approximately<br />
7.2% over the following 50 regeneration cycles,<br />
which is within the previously recommended guidelines<br />
(Wong et al., 1997), which suggested that the<br />
<strong>surface</strong>-binding capacity should remain within 20%<br />
<strong>of</strong> the initial measured binding response over the<br />
course <strong>of</strong> the assay procedure.<br />
Dilutions <strong>of</strong> antibody, nominally 1:100, were<br />
prepared in HBS buffer <strong>and</strong> passed sequentially<br />
over both blank CM-dextran chips <strong>and</strong> immobilised<br />
BSA <strong>surface</strong>s to ascertain the degree <strong>of</strong> nonspecific<br />
binding <strong>of</strong> antibody to the chip <strong>surface</strong>s. <strong>The</strong><br />
binding in all cases was negligible, demonstrating<br />
that the measured binding response was solely due<br />
to antibody binding to the various warfarin immobilised<br />
chip <strong>surface</strong>s.
18<br />
B. Fitzpatrick, R. O’Kennedy / Journal <strong>of</strong> Immunological Methods 291 (2004) 11–25<br />
Fig. 3. Influence <strong>of</strong> salt composition on the antibody-binding response. <strong>The</strong> antibody-binding signal measured over the salt concentration range<br />
tested (0.120–0.155 M NaCl) spans twice the physiological range <strong>of</strong> plasma salt concentration normally observed. Results shown are the<br />
average <strong>of</strong> duplicate measurements.<br />
Fig. 4. Binding response curves for equilibrated antibody–warfarin mixtures. Overlaid interaction curves for various equilibrated antibody/<br />
warfarin concentrations in plasma ultrafiltrate. <strong>The</strong> measured binding response (R AG ) was used to calculate the normalised binding response<br />
values (R AG /R 0 ), which were subsequently used to construct the calibration curves. <strong>The</strong> bound antibody showed essentially no dissociation from<br />
the sensor chip. <strong>The</strong> sensor chip could be easily regenerated using two 30-s pulses <strong>of</strong> 30 mM HCl.
B. Fitzpatrick, R. O’Kennedy / Journal <strong>of</strong> Immunological Methods 291 (2004) 11–25 19<br />
3.2. Assessment <strong>of</strong> matrix composition on the<br />
antibody/antigen-binding reaction<br />
<strong>The</strong> composition <strong>of</strong> plasma within the general<br />
population is essentially homogenous, <strong>and</strong> the major<br />
contributor to the ionic strength <strong>of</strong> plasma is sodium<br />
(>90%) <strong>and</strong> its associated anions, whose ionic<br />
concentration is normally in the reference range<br />
0.133–0.145 M (Zilva <strong>and</strong> Pannell, 1979). To assess<br />
the potential effect <strong>of</strong> various salt concentrations on<br />
the measured antibody-binding response, a titration<br />
<strong>of</strong> salt concentration versus antibody-binding response<br />
was constructed using salt concentrations<br />
spanning more than twice the normal physiological<br />
ionic reference range for sodium (i.e., 0.120–0.155<br />
M NaCl). A 20-Al sample <strong>of</strong> the respective salt<br />
solution was allowed to equilibrate with 80 Al <strong>of</strong><br />
antibody solution for 5 min on the BIACore autosampler<br />
<strong>and</strong> injected in r<strong>and</strong>om fashion over a 4Vaminowarfarin<br />
sensor chip <strong>surface</strong> at a flow rate <strong>of</strong><br />
10 Al/min for 4 min, <strong>and</strong> the binding response was<br />
recorded.<br />
Over the range <strong>of</strong> salt concentrations tested, there<br />
was statistically no difference between the binding<br />
responses recorded as tested by analysis <strong>of</strong> variance<br />
(ANOVA). <strong>The</strong> plasma dilution step employed (i.e.,<br />
one part in five) was experimentally found to be<br />
optimal in serving to minimise the differences in the<br />
measured binding responses as a result <strong>of</strong> the<br />
altered salt composition. <strong>The</strong> coefficient <strong>of</strong> variation<br />
<strong>of</strong> the measured binding response over the normal<br />
physiological reference range for sodium was found<br />
to be 0.38%, demonstrating that the assay was<br />
sufficiently robust to withst<strong>and</strong> altered matrix com-<br />
Fig. 5. Intraassay (reproducibility) calibration <strong>and</strong> residual plot for the determination <strong>of</strong> warfarin in plasma ultrafiltrate (n = 3). <strong>The</strong> mean<br />
normalised response value (R AG /R 0 ) at each antigen concentration from three independent assays was used to calculate the calibration curve <strong>and</strong><br />
to determine the intraassay variation.
20<br />
B. Fitzpatrick, R. O’Kennedy / Journal <strong>of</strong> Immunological Methods 291 (2004) 11–25<br />
position without any significant effect on the measured<br />
antibody-binding response (Fig. 3).<br />
3.3. Application <strong>of</strong> the assay for the determination <strong>of</strong><br />
warfarin in plasma ultrafiltrate<br />
Dilutions <strong>of</strong> antibody were prepared in plasma<br />
ultrafiltrate as previously described ranging from<br />
0.48 to 500 ng/ml. Antibody solution (80 Al; i.e.,<br />
nominally 1:100 dilution) was then mixed with 20<br />
Al <strong>of</strong> the respective warfarin-spiked plasma ultrafiltrate<br />
sample <strong>of</strong> known concentration <strong>and</strong> allowed to<br />
equilibrate for 5 min on the BIACore autosampler.<br />
<strong>The</strong> equilibrated mixtures were then passed sequentially<br />
in r<strong>and</strong>om order over the chip <strong>surface</strong> to<br />
ensure that there was no bias in the recorded<br />
measurements (typical overlaid antibody/drug equilibrium<br />
mixture-binding curves are shown in Fig.<br />
4). <strong>The</strong> measured binding response at each warfarin<br />
concentration was then divided by the binding<br />
response measured in the presence <strong>of</strong> zero antigen<br />
concentration to give normalised response values<br />
[i.e., response measured in the presence <strong>of</strong> antigen<br />
(R AG )/response measured in the presence <strong>of</strong> zero<br />
antigen (R 0 )].<br />
BIAEvaluation version 3.1 s<strong>of</strong>tware was then<br />
used to construct a st<strong>and</strong>ard curve <strong>of</strong> average<br />
normalised binding response (R AG /R 0 ) versus warfarin<br />
concentration (ng/ml) <strong>and</strong> fitted with a fourparameter<br />
logistic fit (Fig. 5). To demonstrate the<br />
<strong>application</strong> <strong>and</strong> reproducibility <strong>of</strong> the inhibition<br />
immunosensor assay, the assay was conducted over<br />
3 days at 11 different drug concentrations ranging<br />
from 0.48 to 500 ng/ml with each st<strong>and</strong>ard measured<br />
in duplicate. Additionally, eight independent<br />
st<strong>and</strong>ards were also prepared in plasma ultrafiltrate<br />
for each calibration curve constructed. <strong>The</strong> intraassay<br />
degrees <strong>of</strong> accuracy are shown in Table 1 <strong>and</strong><br />
demonstrate the accuracy <strong>of</strong> the technique as observed<br />
from the percentage accuracy between the<br />
interpolated <strong>and</strong> nominal concentrations. <strong>The</strong> relative<br />
precision <strong>of</strong> the assay was also demonstrated by<br />
the low percentage difference determined between<br />
duplicate concentration determinations <strong>of</strong> each independent<br />
calibration st<strong>and</strong>ard interpolated from the<br />
four-parameter logistic fit using BIAEvaluation version<br />
3.1 (Table 2). <strong>The</strong> interassay variation degree<br />
<strong>of</strong> precision <strong>and</strong> recovery were also calculated<br />
Table 1<br />
Intraassay precision for the determination <strong>of</strong> warfarin plasma<br />
ultrafiltrate a (n =2)<br />
Concentration<br />
(ng/ml)<br />
BIACore<br />
interpolated<br />
concentration<br />
Percentage<br />
recovery b<br />
500 267.89 53.58<br />
250 208.79 83.52<br />
125 127.34 101.87<br />
62.5 66.36 106.18<br />
31.25 32.012 102.44<br />
15.63 15.86 101.48<br />
7.81 7.13 91.27<br />
3.91 4.50 115.21<br />
1.95 2.21 113.36<br />
a Duplicate st<strong>and</strong>ards were measured on the same day <strong>and</strong> the<br />
back-calculated concentration value interpolated by fitting the<br />
mean normalised response (R AG /R 0 ) to the st<strong>and</strong>ard curve constructed<br />
using the four-parameter logistic model in BIAEvaluation<br />
(version 3.1).<br />
b Percentage accuracy was determined by: (back-calculated<br />
concentration/nominal concentration) 100%.<br />
(Table 3), from which, the 95% upper <strong>and</strong> lower<br />
confidence limits were calculated (Chapuzet et al.,<br />
1997). In this manner a preliminary estimate <strong>of</strong> the<br />
upper limit <strong>of</strong> quantitation (ULOQ) <strong>and</strong> lower limit<br />
<strong>of</strong> quantitation (LLOQ) were determined for those<br />
samples whose 95% confidence limits were within<br />
F 25% <strong>of</strong> the nominal value (Fig. 6). <strong>The</strong> calibration<br />
<strong>and</strong> residual plot <strong>and</strong> low v 2 value obtained<br />
demonstrate the ‘goodness <strong>of</strong> the fit’ <strong>of</strong> the fourparameter<br />
calibration plot applied to the data set<br />
(Fig. 5).<br />
<strong>The</strong> coefficients <strong>of</strong> variation for the interassay<br />
curves were typically <strong>of</strong> the order <strong>of</strong> 2–7% over<br />
the assay precision range, which demonstrates the<br />
reproducibility <strong>and</strong> corresponding applicability <strong>of</strong> the<br />
assay procedure for routine sample analysis. <strong>The</strong><br />
estimated assay precision range was determined to<br />
be from approximately 4–250 ng/ml in plasma<br />
ultrafiltrate using the monoclonal antibody preparation<br />
3–2–19 on a directly immobilised 4V-aminowarfarin<br />
drug <strong>surface</strong> (Fig. 6).<br />
3.4. HPLC analysis <strong>of</strong> warfarin in plasma ultrafiltrate<br />
samples<br />
HPLC analysis <strong>of</strong> warfarin in the plasma ultrafiltrate<br />
samples was carried out using a slight
B. Fitzpatrick, R. O’Kennedy / Journal <strong>of</strong> Immunological Methods 291 (2004) 11–25 21<br />
Table 2<br />
Concentration <strong>of</strong> back-calculated calibration st<strong>and</strong>ards determined by HPLC <strong>and</strong> BIACore immunoassay<br />
Warfarin calibration<br />
st<strong>and</strong>ard concentration<br />
(ng/ml)<br />
BIACore<br />
replicate 1 a<br />
BIACore<br />
replicate 2 a<br />
Percentage<br />
difference <strong>of</strong><br />
replicates 1 <strong>and</strong> 2 b<br />
BIACore mean<br />
concentration<br />
(ng/ml)<br />
Percentage<br />
accuracy<br />
BIACore c<br />
HPLC assay<br />
mean concentration<br />
(ng/ml)<br />
Percentage<br />
accuracy<br />
HPLC c<br />
187.50 193.34 176.67 8.62 185.00 98.67 183.93 1.9<br />
112.50 116.46 109.31 6.14 112.88 100.34 108.55 3.51<br />
100.00 97.87 95.98 1.94 96.93 96.93 102.35 2.35<br />
93.75 110.67 106.47 3.80 108.57 115.81 95.12 1.46<br />
56.25 59.60 59.33 0.46 59.46 105.71 57.1 1.51<br />
50.00 54.61 53.21 2.57 53.91 107.82 47.35 5.3<br />
46.88 53.43 53.34 0.17 53.39 113.90 48.9 4.31<br />
28.13 26.15 24.88 4.85 25.51 90.72 30.55 3.86<br />
25.00 24.01 23.81 0.83 23.91 95.64 27.98 11.92<br />
23.44 22.25 21.17 4.82 21.71 92.63 16.09 14.44<br />
14.06 12.05 11.25 6.63 11.65 82.87 11.04 11.68<br />
12.50 11.97 11.90 0.58 11.94 95.48 12.87 9.81<br />
11.72 11.31 10.66 5.77 10.98 93.70 7.22 2.63<br />
7.03 7.37 7.06 4.27 7.21 102.60 6.28 0.48<br />
6.25 5.90 5.80 1.73 5.85 93.62 6.16 5.66<br />
5.86 6.24 5.75 7.77 5.99 102.28 N.D. N/A<br />
3.52 4.15 3.55 14.38 3.85 109.56 N.D. N/A<br />
N.D. = nondeterminable; N/A= not applicable.<br />
a BIACore concentration determinations were made by interpolation <strong>of</strong> the normalised response into the four-parameter st<strong>and</strong>ard curve using<br />
BIAEvaluation (version 3.1).<br />
b <strong>The</strong> percent difference between the replicates was determined by: [(replicate 1 replicate 2)/replicate 1] 100%.<br />
c Percent accuracy was determined for both analytical techniques using: (mean/nominal) 100%.<br />
modification <strong>of</strong> the method described (Ring <strong>and</strong><br />
Bostick, 2000), using a mobile phase flow rate <strong>of</strong><br />
1.0 ml/min with UV detection at 308 nm. Postrun<br />
analysis <strong>of</strong> the chromatograms was carried out using<br />
Varian Star s<strong>of</strong>tware (version 5.1). <strong>The</strong> retention<br />
time <strong>of</strong> warfarin under the specified experimental<br />
conditions was found to be 5.7 min. <strong>The</strong> lower limit<br />
<strong>of</strong> detection <strong>of</strong> the HPLC analytical technique was<br />
determined to be approximately 5 ng/ml. <strong>The</strong> peak<br />
area <strong>of</strong> the individual chromatograms was integrated<br />
Table 3<br />
Interassay variation for warfarin in plasma ultrafiltrate (n =3)<br />
Warfarin Concentration Calculated Concentration (ng/ml) (n =2) a % Recovery b<br />
(ng/ml)<br />
Day 1 Day 2 Day 3 Mean Day 1 Day 2 Day 3 Mean %CV<br />
500.00 301.29 267.89 262.60 277.26 60.26 53.58 52.52 55.45 4.20<br />
250.00 198.62 208.79 208.76 205.39 79.45 83.52 83.50 82.16 2.35<br />
125.00 132.92 127.34 129.41 129.89 106.34 101.87 103.53 103.91 2.26<br />
62.50 69.88 66.36 72.68 69.64 111.80 106.18 116.29 111.42 5.06<br />
31.25 30.31 32.01 30.96 31.09 96.98 102.44 99.08 99.50 2.75<br />
15.63 16.03 15.86 15.15 15.68 102.57 101.44 96.95 100.32 2.97<br />
7.81 7.42 7.13 7.96 7.50 95.03 91.30 101.92 96.08 5.39<br />
3.91 4.15 4.50 3.94 4.20 106.10 115.10 100.75 107.32 7.25<br />
1.95 2.08 2.21 2.01 2.10 106.58 113.54 102.99 107.71 5.36<br />
a Calculated concentration values were determined from the 4-parameter calibration curve using the mean normalised response value <strong>and</strong><br />
interpolated using BIAEvaluation version 3.1.<br />
b Percent recovery was calculated as: (calculated concentration/nominal concentration)*100%.
22<br />
B. Fitzpatrick, R. O’Kennedy / Journal <strong>of</strong> Immunological Methods 291 (2004) 11–25<br />
Fig. 6. Plot <strong>of</strong> mean percentage recovery versus log <strong>of</strong> warfarin concentration for the intraassay curves. A plot <strong>of</strong> the mean back-calculated<br />
concentration was constructed against the log <strong>of</strong> warfarin concentration. <strong>The</strong> 95% upper <strong>and</strong> lower confidence limits were then used to assess<br />
the assay precision range for those samples whose concentrations were within F 25% <strong>of</strong> the nominal concentration, from which preliminary<br />
estimates <strong>of</strong> the upper (ULOQ) <strong>and</strong> lower (LLOQ) could be made.<br />
<strong>and</strong> used to construct a calibration plot <strong>of</strong> peak area<br />
versus warfarin concentration (ng/ml; Fig. 7). From<br />
the equation <strong>of</strong> the best-fit regression line, it was<br />
possible to calculate the concentration <strong>of</strong> warfarin in<br />
the independent calibration st<strong>and</strong>ards as shown in<br />
Table 2.<br />
Fig. 7. St<strong>and</strong>ard curve for warfarin (.; 0–500 ng/ml) in plasma ultrafiltrate as determined by HPLC. <strong>The</strong> peak area determined at each warfarin<br />
concentration was plotted against the respective warfarin concentration (ng/ml). From the linear calibration plot constructed, the concentration<br />
<strong>of</strong> warfarin (ng/ml) in the independently prepared set <strong>of</strong> calibration st<strong>and</strong>ards (o) was back-calculated using the equation <strong>of</strong> the regression line<br />
from the constructed st<strong>and</strong>ard curve.
B. Fitzpatrick, R. O’Kennedy / Journal <strong>of</strong> Immunological Methods 291 (2004) 11–25 23<br />
Fig. 8. Comparison <strong>of</strong> analytical techniques. <strong>The</strong> concentration <strong>of</strong> warfarin (ng/ml) for the independent set <strong>of</strong> calibration st<strong>and</strong>ards was<br />
interpolated from each calibration curve using the two independent analytical techniques (i.e., HPLC <strong>and</strong> BIACore). ANOVA analysis <strong>of</strong> the<br />
data sets demonstrated no significant difference between the two analytical techniques for the determination <strong>of</strong> warfarin in plasma ultrafiltrate<br />
samples.<br />
3.5. Comparison <strong>of</strong> the independent analytical<br />
techniques<br />
To assess whether there was any statistical difference<br />
between the two independent analytical techniques,<br />
ANOVA analysis was performed on the backcalculated<br />
concentration <strong>of</strong> the independent st<strong>and</strong>ards<br />
determined with each assay procedure performed (Table<br />
2). ANOVA analysis showed there to be no<br />
statistical difference between the two analytical techniques.<br />
<strong>The</strong> constructed X–Y correlation plot <strong>of</strong> the<br />
back-calculated concentration values for each analytical<br />
technique demonstrated excellent correlation between<br />
the two techniques (R 2 = 0.991; Fig. 8).<br />
4. Discussion<br />
<strong>The</strong> biosensor assay format developed for the analysis<br />
<strong>of</strong> warfarin had excellent performance characteristics.<br />
<strong>The</strong> directly immobilised 4V-aminowarfarin drug<br />
<strong>surface</strong> demonstrated very high stability over the<br />
course <strong>of</strong> the regeneration cycle studied, with no loss<br />
in antibody-binding capacity <strong>and</strong> high reproducibility<br />
in the measured binding signal. Any decrease in<br />
<strong>surface</strong>-binding capacity was well within the previously<br />
recommended immunosensor guidelines, which<br />
suggests that the binding capacity remain within 20%<br />
<strong>of</strong> the initial measured binding response over the course<br />
<strong>of</strong> the assay study conducted (Wong et al., 1997).<br />
Directly immobilised drug <strong>surface</strong>s could be used for<br />
greater than 1000 regeneration cycles with no loss in<br />
antibody-binding capacity. An additional advantage <strong>of</strong><br />
such <strong>surface</strong>s is their ability to withst<strong>and</strong> the use <strong>of</strong><br />
harsh regeneration solutions, such as 3 M guanidine<br />
hydrochloride, for the dissociation <strong>of</strong> particularly highaffinity<br />
antibodies, which can be problematic for conjugate<br />
<strong>surface</strong>s as the harsh regeneration conditions<br />
required for dissociation <strong>of</strong> the antibody/antigen complex<br />
frequently reduce the lig<strong>and</strong>-binding capacity <strong>and</strong><br />
integrity <strong>of</strong> the immobilised conjugates (Daly et al.,<br />
2000). In this instance, the bound monoclonal antibodies<br />
could be routinely dissociated from the drug–<br />
protein conjugate <strong>surface</strong> using pulses (i.e., 30 s) <strong>of</strong><br />
mild acid. Protein-A/G may provide specific orientation<br />
<strong>of</strong> immobilised antibodies that are capable <strong>of</strong><br />
reproducibly being used for greater than 120 cycles<br />
(Quinn et al., 1999). However, longterm repeated<br />
regeneration can result in a very significant reduction<br />
in antibody-binding capacity. <strong>The</strong> key benefit arising<br />
from the use <strong>of</strong> directly immobilised drug <strong>surface</strong>s is<br />
that the sensitivity <strong>of</strong> the assay is enhanced when<br />
detecting the large change in mass, which occurs on<br />
binding antibody from solution. <strong>The</strong> degree <strong>of</strong> nonspe-
24<br />
B. Fitzpatrick, R. O’Kennedy / Journal <strong>of</strong> Immunological Methods 291 (2004) 11–25<br />
cific binding <strong>of</strong> both antibody <strong>and</strong> plasma ultrafiltrate<br />
to the CM-dextran <strong>surface</strong> <strong>and</strong> derivatised <strong>surface</strong>s was<br />
negligible.<br />
<strong>The</strong> use <strong>of</strong> a plasma dilution step was employed to<br />
minimise the variation in antibody-binding response<br />
due to differing salt concentrations. This proved effective<br />
in normalising the measured antibody-binding<br />
response over the salt concentration range assayed,<br />
which spanned more than twice the normal physiological<br />
reference range. <strong>The</strong> coefficient <strong>of</strong> variation for the<br />
measured binding response over the normal physiological<br />
salt concentration reference range was determined<br />
to be 0.38%, which underlines the robustness <strong>of</strong><br />
the assay procedure to withst<strong>and</strong> variations in matrix<br />
composition <strong>and</strong> its applicability for the analysis <strong>of</strong><br />
samples <strong>of</strong> plasma ultrafiltrate. <strong>The</strong> use <strong>of</strong> ultrafiltration<br />
techniques has gained widespread use in the<br />
clinical setting for the preparation <strong>of</strong> patient plasma<br />
samples (Menguy et al., 1998; Jortani et al., 1999). It<br />
<strong>of</strong>fers several advantages over other techniques, such<br />
as equilibrium dialysis, for the determination <strong>of</strong> the<br />
pharmacologically active ‘nonprotein’-bound fraction<br />
<strong>of</strong> a drug in plasma. <strong>The</strong>se include rapidity <strong>and</strong> ease <strong>of</strong><br />
use, with the elimination <strong>of</strong> the ‘dilution’ effects<br />
observed using other techniques. Similarly, the essentially<br />
pure <strong>and</strong> homogenous nature <strong>of</strong> plasma ultrafiltrate<br />
greatly simplifies many <strong>of</strong> the difficulties<br />
associated with plasma, particularly the nonspecific<br />
matrix effects routinely observed.<br />
<strong>The</strong> inhibition immunoassay demonstrated excellent<br />
reproducibility as shown by the interassay variation<br />
(Table 3). <strong>The</strong> residual plots constructed <strong>and</strong> the<br />
low v 2 values obtained illustrate the ‘goodness <strong>of</strong> the<br />
fit’ <strong>of</strong> the four-parameter equation employed. <strong>The</strong><br />
heteroscedastic nature <strong>of</strong> the residual plot (Fig. 5)<br />
illustrates that there is no bias in the constructed plot<br />
unlike linear calibration models that, when fitted to<br />
such immunoassay curves, generally exhibit both negative<br />
<strong>and</strong> positive deviations from the fitted calibration<br />
model at both the upper <strong>and</strong> lower extremities <strong>of</strong> the<br />
curve. <strong>The</strong> preliminary estimated assay precision range<br />
(4–250 ng/ml) is within the expected physiological<br />
concentration for warfarin in patient plasma ultrafiltrate<br />
samples. <strong>The</strong> percentage difference determined between<br />
the replicate determinations for the calibration<br />
st<strong>and</strong>ards <strong>and</strong> closeness <strong>of</strong> the interpolated mean values<br />
to the nominal concentration values demonstrates both<br />
the relative precision <strong>and</strong> accuracy <strong>of</strong> the immunoassay<br />
(Table 2). <strong>The</strong> constructed regression plot <strong>of</strong> the backcalculated<br />
concentration values for the independent<br />
calibrators demonstrates that excellent correlation<br />
was achieved between both independent analytical<br />
techniques (i.e., HPLC assay <strong>and</strong> BIACore inhibition<br />
immunoassay, R 2 = 0.991). Indeed, several <strong>of</strong> the independent<br />
calibrators quantifiable using the immunosensor<br />
assay were below the limit <strong>of</strong> detection <strong>of</strong> the<br />
chromatographic technique.<br />
<strong>The</strong> work cited in this particular instance highlights<br />
the applicability <strong>of</strong> the described immunosensor assay<br />
format for the detection <strong>of</strong> any target analyte by simply<br />
altering the specificity <strong>of</strong> the antibody <strong>and</strong> the immobilised<br />
lig<strong>and</strong> used, without the need for developing<br />
individual, chromatographic separation techniques.<br />
<strong>The</strong> time required for the analysis <strong>of</strong> patient samples,<br />
using the technique described, is typically <strong>of</strong> the<br />
order <strong>of</strong> 30 min from receipt <strong>of</strong> sample, which is<br />
considerably less than those <strong>of</strong> many chromatographic<br />
techniques which <strong>of</strong>ten require extensive sample pretreatment,<br />
extraction <strong>and</strong> derivatisation schemes <strong>and</strong><br />
are typically <strong>of</strong> the order <strong>of</strong> hours.<br />
5. Conclusion<br />
This paper describes the <strong>development</strong> <strong>and</strong> <strong>application</strong><br />
<strong>of</strong> a BIACore-based inhibition immunoassay<br />
for the detection <strong>of</strong> the nonprotein-bound fraction <strong>of</strong><br />
warfarin in plasma ultrafiltrate. <strong>The</strong> use <strong>of</strong> directly<br />
immobilised drug <strong>surface</strong>s provide exceptional assay<br />
performance characteristics, stability <strong>and</strong> reproducibility<br />
with respect to antibody-binding capacity <strong>and</strong>,<br />
consequently, should be employed whenever direct<br />
attachment <strong>of</strong> the target analyte to the chip <strong>surface</strong> is<br />
feasible. Use <strong>of</strong> such immunosensor-based assay<br />
procedures provides a viable alternative to conventional<br />
chromatographic procedures for the quantitation<br />
<strong>of</strong> low molecular weight analytes <strong>and</strong> may have<br />
additional advantages with respect to assay performance,<br />
speed <strong>and</strong> detection limits attainable.<br />
Acknowledgements<br />
<strong>The</strong> support <strong>of</strong> PRTLI (Irel<strong>and</strong>) <strong>and</strong> the National<br />
Centre for Sensor Research (Irel<strong>and</strong>) is gratefully<br />
acknowledged. We wish to thank Dr. R. O’Donnell,
B. Fitzpatrick, R. O’Kennedy / Journal <strong>of</strong> Immunological Methods 291 (2004) 11–25 25<br />
Beaumont Hospital, Dublin, for his encouragement<br />
<strong>and</strong> support. We also wish to thank Enterprise Irel<strong>and</strong><br />
for their support for this research.<br />
This paper is dedicated to Pr<strong>of</strong>. R.D. Thornes<br />
whose unfailing enthusiasm, support <strong>and</strong> advice have<br />
been <strong>of</strong> great benefit to our research <strong>and</strong> who died<br />
during the preparation <strong>of</strong> this manuscript.<br />
References<br />
Amirkhosravi, M., Francis, J.L., 1995. Coagulation activation by<br />
MC28 fibrosarcoma cells facilitates lung tumor formation.<br />
Thromb. Haemost. 73 (1), 59.<br />
Bertucci, C., Canepa, A., Ascoli, G.A., Guimaraes, L.F.L., Felix,<br />
G., 1999. Site I on human albumin: differences in the binding <strong>of</strong><br />
(R)- <strong>and</strong> (S)-warfarin. Chirality 11 (9), 675.<br />
Boder, E.T., Midelfort, K.S., Wittrup, K.D., 2000. Directed evolution<br />
<strong>of</strong> antibody fragments with monovalent femtomolar antigen-binding<br />
site. Proc. Natl. Acad. Sci. U. S. A. 97 (20), 10701.<br />
Brennan, J., Dillon, P., O’Kennedy, R., 2003. <strong>The</strong> production, purification<br />
<strong>and</strong> characterisation <strong>of</strong> genetically-derived scFv <strong>and</strong><br />
bifunctional antibody fragments capable <strong>of</strong> detecting illicit drug<br />
residues. J. Chromatogr., B, Biomed. Sci. Appl. 18, 217.<br />
Capitán-Vallvey, L.F., Deheldel, M.K.L., Avidad, R., 1999. Determination<br />
<strong>of</strong> warfarin in waters <strong>and</strong> human plasma by solid phase<br />
room-temperature transmitted phosphorescence. Arch. Environ.<br />
Contam. Toxicol. 37, 1.<br />
Chapuzet, E., Mercier, N., Bervoas-Martin, S., Boulanger, B., Chevalier,<br />
P., Chiap, P., Gr<strong>and</strong>jean, D., Hubert, P., Lagorce, P.,<br />
Lallier, M., Laparra, M.C., Laurentie, M., Nivet, J.C., 1997.<br />
Méthodes chromatographiques de dosage les milieus biologiques:<br />
stratégie de validation Rapport d’une commission SFSTP.<br />
STP Pharma Prat. 7 (3), 169.<br />
Cooke, D., Fitzpatrick, B., O’Kennedy, R., McCormack, T., Egan,<br />
D., 1997. In: O’Kennedy, R., Thornes, R.D. (Eds.), Coumarins:<br />
Biology, Applications <strong>and</strong> Mode <strong>of</strong> Action. Wiley, Chichester,<br />
p. 303.<br />
Crooks, S.R.H., Baxter, G.A., O’Connor, M., Elliot, C.T., 1998.<br />
Immunobiosensor—an alternative to enzyme immunoassay<br />
screening for residues <strong>of</strong> two sulfonamides in pigs. Analyst<br />
123, 2755.<br />
Daly, S.J., Keating, G.J., Dillon, P.P., Manning, B.M., O’Kennedy,<br />
R., Lee, H.A., Morgan, M.A., 2000. Development <strong>of</strong> <strong>surface</strong><br />
<strong>plasmon</strong> resonance-based immunoassay for Aflatoxin B 1 .<br />
J. Agric. Food Chem. 48 (11), 5097.<br />
Dockal, M., Carter, D.C., Ruker, F., 1999. <strong>The</strong> three recombinant<br />
domains <strong>of</strong> human serum albumin. J. Biol. Chem. 274 (41),<br />
29303.<br />
Findlay, J.W.A., Smith, W.C., Lee, J.W., Nordblom, G.D., Das, I.,<br />
DeSilva, B.S., Khan, M.N., Bowsher, R.R., 2000. Validation <strong>of</strong><br />
immunoassays for bioanalysis: a pharmaceutical industry perspective.<br />
J. Pharm. Biomed. Anal. 21, 1249.<br />
Fitzpatrick, B., 2001. <strong>The</strong> production, characterisation <strong>and</strong> <strong>application</strong>s<br />
<strong>of</strong> polyclonal <strong>and</strong> monoclonal antibodies to warfarin. PhD<br />
thesis, Dublin City University, Dublin, Irel<strong>and</strong>.<br />
Hirsh, J., Dalen, J.E., Deykin, D., Poller, L., Bussey, H., 1995. Oral<br />
Anticoagulants: mechanism <strong>of</strong> action, clinical effectiveness, <strong>and</strong><br />
optimal therapeutic range. Chest 108 (4), 231s.<br />
Ikawa, M., Stahmann, M.A., Link, K.P., 1944. Studies on 4-hydroxycoumarins:<br />
V. <strong>The</strong> condensation <strong>of</strong> a, h-unsaturated ketones<br />
with 4-hydroxycoumarins. J. Am. Chem. Soc. 66, 902.<br />
Jönsson, U., Fagerstam, L., Ivarsson, B., Lundh, K., Löfas, S.,<br />
Persson, B., Roos, H., Rönnberg, L., Sjöl<strong>and</strong>er, S., Stenberg,<br />
E., Stahlberg, R., Urbaniczky, C., Östlin, H., Malmqvist, M.,<br />
1991. Real-time biospecific interaction analysis using <strong>surface</strong><br />
<strong>plasmon</strong> resonance <strong>and</strong> a sensorchip technology. BioTechniques<br />
11, 620.<br />
Jortani, S.A., Pinar, A., Johnson, N.A., Valdes, R., 1999. Validity <strong>of</strong><br />
unbound digoxin measurement by immunoassays in presence <strong>of</strong><br />
antidote (Digibind). Clin. Chim. Acta 283, 159.<br />
King, S.-H.P., Joslin, M.A., Raudibaugh, K., Pieniaszek Jr., H.J.,<br />
Benedek, I.H., 1995. Dose-dependent pharmacokinetics <strong>of</strong> warfarin<br />
in healthy volunteers. Pharm. Res. 12 (12), 1874.<br />
Link, K.P., 1943–1944. <strong>The</strong> anticoagulant from spoiled sweet clover<br />
hay. Harvey Lect. Ser. 39, 162.<br />
Menguy, T., Chenevois, S., Guillain, F., le Maire, M., Falson, P.,<br />
Champeil, P., 1998. Lig<strong>and</strong> binding to macromolecules or<br />
micelles: use <strong>of</strong> centrifugal ultrafiltration to measure low-affinity<br />
binding. Anal. Biochem. 264 (2), 141.<br />
Quinn, J., Patel, P., Fitzpatrick, B., Manning, B., Dillon, P., Daly,<br />
S., O’Kennedy, R., Alcocer, M., Lee, H., Morgan, M., Lang, K.,<br />
1999. <strong>The</strong> use <strong>of</strong> regenerable, affinity lig<strong>and</strong>-based <strong>surface</strong>s for<br />
immunosensor <strong>application</strong>s. Biosens. Bioelectron. 14, 587.<br />
Ring, P.R., Bostick, J.M., 2000. Validation <strong>of</strong> a method for the<br />
determination <strong>of</strong> (R)-warfarin <strong>and</strong> (S)-warfarin in human plasma<br />
using LC with UV detection. J. Pharm. Biomed. Anal. 22, 573.<br />
Satoh, H., Hayashi, M., Satoh, S., 1982. Anti-warfarin antibody<br />
preparation <strong>and</strong> it’s characterisation for radioimmunoassay.<br />
J. Pharm. Pharmacol. 34, 429.<br />
Thaisrivongs, S., Strohbach, J.W., 1999. Structure-based discovery<br />
<strong>of</strong> Tipranavir disodium (PNU-140690E): a potent, orally bioavailable,<br />
nonpeptidic HIV protease inhibitor. Biopolymers 51<br />
(1), 51.<br />
Wells, P.S., Holbrook, A.M., Crowther, N.R., Hirsh, J., 1994. Interactions<br />
<strong>of</strong> warfarin with drugs <strong>and</strong> food. Ann. Intern. Med. 121<br />
(9), 676.<br />
Wong, R.L., Mytych, D., Jacobs, S., Bordens, R., Swanson, S.J.,<br />
1997. Validation parameters for a novel biosensor assay which<br />
simultaneously measures serum concentrations <strong>of</strong> a humanized<br />
monoclonal antibody <strong>and</strong> detects induced antibodies. J. Immunol.<br />
Methods 209, 1.<br />
Zacharski, L.R., Henderson, W.G., Rickles, F.R., Forman, W.B.,<br />
Cornell Jr., C.J., Jackson Forcier, R., Edwards, R.L., Headley,<br />
E., Kim, S.-H., O’Donnell, J.R., O’Dell, R., Tornyos, K.,<br />
Kwaan, H.C., 1984. Effect <strong>of</strong> warfarin anticoagulation on survival<br />
in carcinoma <strong>of</strong> the lung, colon, head <strong>and</strong> neck, <strong>and</strong> prostate.<br />
Final report <strong>of</strong> VA co-operative study no. 75. Cancer 53<br />
(10), 2046.<br />
Zilva, J.F., Pannell, P.R., 1979. Clinical Chemistry in Diagnosis <strong>and</strong><br />
Treatment, third edition. Lloyd-Duke, London, Engl<strong>and</strong>.