Problem Set 6 Solution - California State University, Sacramento
Problem Set 6 Solution - California State University, Sacramento
Problem Set 6 Solution - California State University, Sacramento

You also want an ePaper? Increase the reach of your titles
YUMPU automatically turns print PDFs into web optimized ePapers that Google loves.
Name: ______<strong>Solution</strong>s_________<br />
Department of Economics<br />
Professor Dowell<br />
<strong>California</strong> <strong>State</strong> <strong>University</strong>, <strong>Sacramento</strong> Spring 2013<br />
<strong>Problem</strong> <strong>Set</strong> #6<br />
Due in hard copy at beginning of lecture on Friday, April 19, 2013<br />
Important: Place all answers in the indicated spaces. Only your work and answers in the indicated<br />
spaces will be graded. All pages must be in order and stapled together.<br />
1. Fill in the blanks in the table below:<br />
To answer this question, use the formula<br />
information.<br />
1 <br />
Y<br />
G<br />
1<br />
MPC <br />
to solve for the missing<br />
MPC<br />
Spending<br />
Multiplier<br />
Change in<br />
Government<br />
Spending<br />
Change in<br />
Income<br />
0 10 100 100<br />
0.833 6 -50 -300<br />
0.75 4 200 800<br />
0.5 2 500 1,000<br />
2. Fill in the blanks in the table below:<br />
To answer this question, use the formula<br />
information.<br />
<br />
Y<br />
<br />
1<br />
MPC<br />
MPC<br />
<br />
T<br />
<br />
to solve for the missing<br />
MPC<br />
Spending<br />
Multiplier<br />
Change in Taxes<br />
Change in<br />
Income<br />
0.9091 -10 -100 1,000<br />
0.857 -6 50 -300<br />
0.75 -3 200 -600<br />
0.5 -1 -1,000 1,000
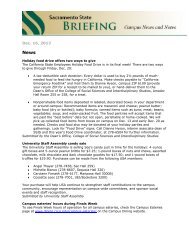
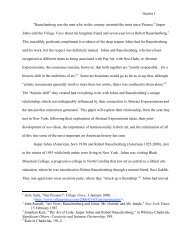
3. a. Use a pair of AS-AD diagrams to show that the multiplier effects are smaller when the AS curve<br />
is steeper. (Hint: Each diagram should have one AS curve, one steeper than the other and two<br />
AD curves, the same distance apart in each diagram.)<br />
AS<br />
P<br />
P<br />
AS<br />
AD 1<br />
AD 1<br />
AD 2<br />
AD 2<br />
Y<br />
∆Y 1 ∆Y 2<br />
Note that the horizontal shift of the AD curve is approximately the same in both panels above.<br />
Clearly though the change in income is less on the right hand side with the steeper AS curve.<br />
This is because as prices rise, so does money demand. This increases interest rates and reduces<br />
investment causing a movement up AD 2 to the point of equilibrium.<br />
b. Why is the multiplier reduced as the price level increase? (Hint: Think about what is happening<br />
in the money market.)<br />
The price level increases more along the steeper AS curve. As a result we move further up<br />
the new AD curve due to the real wealth effect, the interest rate effect and the foreign trade<br />
effect. The steeper the AS curve is, the more we move up the demand curve and the smaller<br />
the multiplier is.<br />
Y<br />
c. What is the value of the multiplier when the AS curve is vertical?<br />
Zero. If AS is vertical, output isn’t changing and as a result the multiplier is zero.<br />
4. On a separate sheet of paper, complete Study <strong>Problem</strong>s 1, 2 and 3 on pages 516-517 of the text.<br />
Staple these pages to the back of your problem set,<br />
2
Text Book <strong>Problem</strong>s<br />
Question 1:<br />
In general, demand side policies are focused on shifting aggregate demand while supply side policies<br />
are focused on shifting aggregate supply.<br />
a. A $1,000 per person tax cut is primarily a demand side policy in that it increases disposable<br />
income and hence spending. To the extent it increases after tax wages though, it may also<br />
increase labor supply resulting in a small supply side effect.<br />
b. Still predominantly a demand side effect though any reduction in taxes on income from<br />
innovation and investment will also have a supply side effect.<br />
c. Pell grants will have a demand side effect in the short run as they increase demand for education<br />
services. To the extent they increase human capital though, the grants will have a long-run<br />
supply side effect.<br />
d. Government prizes for new scientific discoveries will primarily have a supply side effect as they<br />
encourage technological innovation.<br />
e. Increasing unemployment compensation will primarily have a demand side effect as it offsets lost<br />
income. Some would argue though that it also has a negative supply side effect as it reduces the<br />
incentive to work.<br />
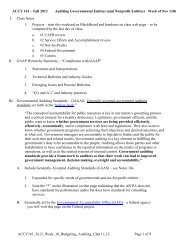
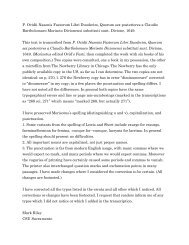
Question 2<br />
A.<br />
Interest<br />
Rate<br />
100<br />
S<br />
6%<br />
4%<br />
D 1<br />
D 2<br />
800<br />
860<br />
Savings, Investment and<br />
Gov’t Borrowing<br />
3
B. See demand curve D 2 above. Note that without knowing the slope of the curves or being<br />
given the change in the equilibrium values, you can’t illustrate unique exact values. I used<br />
the same model as that used in the example on pages 507-508 of the text in preparing this<br />
answer. Your numbers may be different than mine. So long as the interest rate and total<br />
amount outstanding in the loanable funds market both increase and the rest of your answer is<br />
internally consistent that is fine.<br />
C. New interest rate: 6%<br />
New quantity of loanable funds: $860<br />
D. Savings: $860<br />
Investment: $760<br />
New Government Spending: $100<br />
E. Private consumption fell by the increase in savings, $60.<br />
Question 3<br />
The New Classical critique is based on the idea of Ricardian equivalence which argues that people<br />
will save the proceeds of any tax cut in order to have the funds available to pay for the expected<br />
future tax increase that will be used to pay back the government debt. Note that if the government<br />
uses debt financing to increase spending rather than to cut taxes, consumers will still increase saving<br />
today in expectation of future tax increases. In either case, the supply of loanable funds increases by<br />
exactly the same amount (due to increased saving) as the demand for loanable funds resulting in no<br />
change in the interest rate and hence no crowding out.<br />
4