Tips for teachers of evidence-based medicine: 1. Relative risk ...
Tips for teachers of evidence-based medicine: 1. Relative risk ...
Tips for teachers of evidence-based medicine: 1. Relative risk ...

You also want an ePaper? Increase the reach of your titles
YUMPU automatically turns print PDFs into web optimized ePapers that Google loves.
Barratt et al<br />
ative <strong>risk</strong> as a prior step <strong>for</strong> calculating relative <strong>risk</strong> reduction;<br />
the <strong>for</strong>mulas <strong>for</strong> both appear in Appendix <strong>1.</strong> Finally, many<br />
learners have difficulty understanding that <strong>risk</strong> difference depends<br />
on the baseline <strong>risk</strong> and that relative <strong>risk</strong> reduction<br />
tends to be constant across populations. 8 The graphic approach<br />
we use makes this distinction intuitively evident.<br />
The script<br />
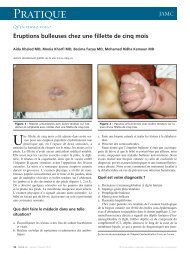
Figure 1 is the centrepiece <strong>of</strong> this tip, which focuses on<br />
the concept <strong>of</strong> 2 randomized trials <strong>of</strong> a therapy, per<strong>for</strong>med<br />
on 2 populations with different baseline <strong>risk</strong>s <strong>of</strong> the outcome.<br />
First, using a chalkboard, easel or overhead projector,<br />
draw the axes <strong>of</strong> the graph, labelling the vertical axis<br />
“Event rate.” To explain what you are doing, you can say,<br />
“In a group <strong>of</strong> 100 patients, the number who experience an<br />
adverse event such as death is the event rate.” Next, draw<br />
the first bar, telling learners that this is the event rate in a<br />
population with severe disease (that is, a group at high <strong>risk</strong><br />
<strong>of</strong> an adverse event). The event rate is 40 out <strong>of</strong> 100, or<br />
40%. Next, draw the second bar, telling learners that this is<br />
the event rate in severely diseased patients who receive a<br />
treatment. Ask participants to describe the effect <strong>of</strong> the<br />
treatment. Someone will probably say it reduces the event<br />
rate by one-quarter or by 25%. Now, ask them if there is<br />
any other way they could express the difference between<br />
the 2 bars. With luck, someone will suggest subtracting the<br />
event rate in the second (treated) group from the event rate<br />
in the first (control) group, which gives a value <strong>of</strong> 10%.<br />
The learners have now intuitively calculated the relative<br />
<strong>risk</strong> reduction and the <strong>risk</strong> difference. Add these labels to<br />
your graph and explain that the <strong>risk</strong> difference is so called<br />
because it represents the difference between event rates,<br />
i.e., the subtraction <strong>of</strong> one rate from another. <strong>Relative</strong> <strong>risk</strong><br />
reduction is so called because it involves presenting the<br />
change in <strong>risk</strong> as a proportion <strong>of</strong> (or relative to) the initial<br />
rate. At this point, you may want to tell them that absolute<br />
<strong>risk</strong> reduction is an alternative term <strong>for</strong> <strong>risk</strong> difference. For<br />
the remainder <strong>of</strong> this article we will use “<strong>risk</strong> difference”<br />
because we think the term is more self-explanatory and because<br />
it applies to both increases and decreases in <strong>risk</strong>.<br />
Have learners record the relative <strong>risk</strong> reduction and the<br />
<strong>risk</strong> difference. Next, suggest that a second trial has been<br />
per<strong>for</strong>med in a less severely affected patient population.<br />
Draw the third bar (showing an event rate <strong>of</strong> 10%), telling<br />
them that it represents the event rate in this lower-<strong>risk</strong><br />
group. Ask them, “If these people are also given the treatment<br />
and it is as effective as it was in the more severely diseased<br />
patients (i.e., the relative <strong>risk</strong> reduction is constant),<br />
what will the event rate be in the treated group?” Someone<br />
will <strong>of</strong>fer 7.5% as the answer, and you can draw, or ask the<br />
learner to draw, this bar on the graph. Finally, ask the<br />
learners to calculate the <strong>risk</strong> difference <strong>for</strong> the second pair<br />
<strong>of</strong> bars (only 2.5%). Have them compare the relative <strong>risk</strong><br />
reduction and the <strong>risk</strong> difference in the high-<strong>risk</strong> population<br />
(25% and 10% respectively) with the same values <strong>for</strong><br />
the low <strong>risk</strong> population (25% and 2.5% respectively).<br />
The bottom line<br />
• An event rate is the number <strong>of</strong> people experiencing an<br />
event as a proportion <strong>of</strong> the number <strong>of</strong> people in the population.<br />
• The <strong>risk</strong> difference (absolute <strong>risk</strong> reduction) is the arithmetic<br />
difference between 2 event rates.<br />
• The relative <strong>risk</strong> reduction is the difference in event rates<br />
expressed in a proportional or relative manner, in relation<br />
to the control event rate.<br />
• <strong>Relative</strong> <strong>risk</strong> reduction is <strong>of</strong>ten more impressive than<br />
the <strong>risk</strong> difference. Furthermore, the lower the event<br />
rate in the control group, the larger the difference between<br />
relative <strong>risk</strong> reduction and <strong>risk</strong> difference.<br />
See Appendix 2 <strong>for</strong> the summary card <strong>for</strong> this tip.<br />
Event rate, %<br />
40<br />
30<br />
20<br />
10<br />
0<br />
Trial 1: high<strong>risk</strong><br />
patients<br />
Control<br />
Treatment<br />
Trial 2: low<strong>risk</strong><br />
patients<br />
The <strong>risk</strong> difference (also called the absolute <strong>risk</strong> reduction) is the simple difference in the event<br />
rates (<strong>for</strong> trial 1, 40% – 30% = 10%).<br />
<strong>Relative</strong> <strong>risk</strong> reduction is the difference between the event rates in relative terms. In both trials,<br />
the event rate in the treatment group is 25% less than the event rate in the control group (i.e., the<br />
10% <strong>risk</strong> difference in trial 1 expressed as a proportion <strong>of</strong> the control rate is 10/40 or<br />
25% less).<br />
Fig. 1: Results <strong>of</strong> 2 hypothetical randomized controlled trials <strong>of</strong> a new therapy. The blue bar in each trial represents the rate <strong>of</strong> a<br />
specified adverse event in untreated patients, and the green bar represents the rate in patients treated with the new therapy. The 2<br />
trials are per<strong>for</strong>med in patients with different baseline <strong>risk</strong>s <strong>for</strong> the adverse outcome: a high baseline <strong>risk</strong> <strong>for</strong> patients in trial 1 and<br />
a low baseline <strong>risk</strong> <strong>for</strong> those in trial 2.<br />
Online-2 JAMC • 17 AOÛT 2004; 171 (4)