Tips for teachers of evidence-based medicine: 1. Relative risk ...
Tips for teachers of evidence-based medicine: 1. Relative risk ...
Tips for teachers of evidence-based medicine: 1. Relative risk ...

Create successful ePaper yourself
Turn your PDF publications into a flip-book with our unique Google optimized e-Paper software.
<strong>Tips</strong> <strong>for</strong> <strong>teachers</strong> <strong>of</strong> <strong>evidence</strong>-<strong>based</strong> <strong>medicine</strong>:<br />
<strong>1.</strong> <strong>Relative</strong> <strong>risk</strong> reduction, absolute <strong>risk</strong> reduction<br />
and number needed to treat<br />
Review<br />
Synthèse<br />
Alexandra Barratt, Peter C. Wyer, Rose Hatala, Thomas McGinn, Antonio L. Dans, Sheri Keitz,<br />
Virginia Moyer, Gordon Guyatt, <strong>for</strong> the Evidence-Based Medicine Teaching <strong>Tips</strong> Working Group<br />
Physicians, patients and policy-makers are affected<br />
not only by the results <strong>of</strong> studies but also by how authors<br />
present the results. 1-4 An adequate understanding<br />
<strong>of</strong> how to use quantitative estimates <strong>of</strong> effect is important<br />
<strong>for</strong> clinicians who seek to apply the results <strong>of</strong> clinical<br />
trials and systematic reviews to patient care. However,<br />
many physicians find the concepts, language and <strong>for</strong>mulas<br />
<strong>of</strong> relative <strong>risk</strong> reduction, <strong>risk</strong> difference (absolute <strong>risk</strong> reduction)<br />
and number needed to treat daunting. Furthermore,<br />
depending on which measures <strong>of</strong> effect are presented<br />
in a given study, the impact <strong>of</strong> an intervention may appear<br />
very large or quite small, even though the underlying data<br />
are the same. In this article we present scripts that <strong>teachers</strong><br />
<strong>of</strong> <strong>evidence</strong>-<strong>based</strong> <strong>medicine</strong> can use to help clinical learners<br />
understand these principles.<br />
For these “teaching scripts” to be useful, the teacher<br />
must have a basic understanding <strong>of</strong> the relevant concepts.<br />
We have framed this article primarily <strong>for</strong> clinical <strong>teachers</strong><br />
who already have a grasp <strong>of</strong> critical appraisal and some experience<br />
in teaching this type <strong>of</strong> material to clinical learners.<br />
Clinical <strong>teachers</strong> may use the approaches we <strong>of</strong>fer with<br />
a broad range <strong>of</strong> clinical learners, including medical students,<br />
residents and practising physicians. However, it is<br />
not our primary goal to instruct novices in <strong>evidence</strong>-<strong>based</strong><br />
<strong>medicine</strong> in the teaching <strong>of</strong> critical appraisal to any level <strong>of</strong><br />
learner. The “tips” in this article are adapted from approaches<br />
developed by educators with experience in teaching<br />
<strong>evidence</strong>-<strong>based</strong> <strong>medicine</strong> skills to clinicians. 5,6 A related<br />
article, intended <strong>for</strong> people who are learning these concepts,<br />
has been published in CMAJ. 7<br />
For each <strong>of</strong> the 3 tips covered in this article, we have<br />
provided guidance on when to use the tip, the teaching<br />
script <strong>for</strong> the tip, a “bottom line” section and a summary<br />
card. Tip 1 presents a method <strong>of</strong> introducing learners to<br />
the importance <strong>of</strong> specific measures <strong>of</strong> effect, including relative<br />
<strong>risk</strong> reduction, absolute <strong>risk</strong> reduction (also called the<br />
“<strong>risk</strong> difference”) and the number needed to treat. In tip 2,<br />
the teacher helps learners to use these “measures <strong>of</strong> association”<br />
to quantify the magnitude <strong>of</strong> benefit and harm <strong>for</strong> patients<br />
at various <strong>risk</strong>s <strong>of</strong> a poor outcome. In tip 3, the<br />
teacher helps learners to derive estimates <strong>of</strong> clinically important<br />
benefit with respect to standard therapeutic interventions.<br />
For each tip, we identify the target learner (on the<br />
basis <strong>of</strong> level <strong>of</strong> experience) and provide estimates <strong>of</strong> the<br />
time required <strong>for</strong> the exercise.<br />
Teaching tip 1: Understanding <strong>risk</strong> and <strong>risk</strong><br />
reduction<br />
When to use this tip<br />
This tip is suitable <strong>for</strong> beginners and intermediate-level<br />
learners, and the exercise takes about 10 minutes. The general<br />
objective is to introduce learners to the concepts <strong>of</strong> <strong>risk</strong><br />
and <strong>risk</strong> reduction, with the following specific objectives:<br />
• Learn how to determine control and treatment event<br />
rates from published studies<br />
• Learn how to determine relative and absolute <strong>risk</strong> reductions<br />
from published studies<br />
• Understand how relative and absolute <strong>risk</strong> reductions<br />
usually apply to different populations<br />
Stumbling blocks <strong>of</strong>ten arise in teaching <strong>risk</strong> and <strong>risk</strong> reduction.<br />
Arithmetic <strong>for</strong>mulas can confuse new learners, particularly<br />
those who are not com<strong>for</strong>table with numbers. As a<br />
result, we have deliberately avoided presenting <strong>for</strong>mulas in<br />
this tip, instead presenting a framework <strong>for</strong> learners to develop<br />
ways <strong>of</strong> calculating the relative <strong>risk</strong> reduction and <strong>risk</strong><br />
difference <strong>for</strong> themselves. We have also avoided defining rel-<br />
Other available resources<br />
• A companion version <strong>of</strong> this article directed to<br />
learners <strong>of</strong> <strong>evidence</strong>-<strong>based</strong> <strong>medicine</strong> has been<br />
published in CMAJ 7 and is available online through<br />
eCMAJ (www.cmaj.ca/cgi/content/full/171/4/353).<br />
• An interactive version <strong>of</strong> this article as well<br />
as other tools and resources are available at<br />
www.ebmtips.net/<strong>risk</strong>00<strong>1.</strong>asp.<br />
CMAJ • AUG. 17, 2004; 171 (4)<br />
Online-1<br />
© 2004 Canadian Medical Association or its licensors
Barratt et al<br />
ative <strong>risk</strong> as a prior step <strong>for</strong> calculating relative <strong>risk</strong> reduction;<br />
the <strong>for</strong>mulas <strong>for</strong> both appear in Appendix <strong>1.</strong> Finally, many<br />
learners have difficulty understanding that <strong>risk</strong> difference depends<br />
on the baseline <strong>risk</strong> and that relative <strong>risk</strong> reduction<br />
tends to be constant across populations. 8 The graphic approach<br />
we use makes this distinction intuitively evident.<br />
The script<br />
Figure 1 is the centrepiece <strong>of</strong> this tip, which focuses on<br />
the concept <strong>of</strong> 2 randomized trials <strong>of</strong> a therapy, per<strong>for</strong>med<br />
on 2 populations with different baseline <strong>risk</strong>s <strong>of</strong> the outcome.<br />
First, using a chalkboard, easel or overhead projector,<br />
draw the axes <strong>of</strong> the graph, labelling the vertical axis<br />
“Event rate.” To explain what you are doing, you can say,<br />
“In a group <strong>of</strong> 100 patients, the number who experience an<br />
adverse event such as death is the event rate.” Next, draw<br />
the first bar, telling learners that this is the event rate in a<br />
population with severe disease (that is, a group at high <strong>risk</strong><br />
<strong>of</strong> an adverse event). The event rate is 40 out <strong>of</strong> 100, or<br />
40%. Next, draw the second bar, telling learners that this is<br />
the event rate in severely diseased patients who receive a<br />
treatment. Ask participants to describe the effect <strong>of</strong> the<br />
treatment. Someone will probably say it reduces the event<br />
rate by one-quarter or by 25%. Now, ask them if there is<br />
any other way they could express the difference between<br />
the 2 bars. With luck, someone will suggest subtracting the<br />
event rate in the second (treated) group from the event rate<br />
in the first (control) group, which gives a value <strong>of</strong> 10%.<br />
The learners have now intuitively calculated the relative<br />
<strong>risk</strong> reduction and the <strong>risk</strong> difference. Add these labels to<br />
your graph and explain that the <strong>risk</strong> difference is so called<br />
because it represents the difference between event rates,<br />
i.e., the subtraction <strong>of</strong> one rate from another. <strong>Relative</strong> <strong>risk</strong><br />
reduction is so called because it involves presenting the<br />
change in <strong>risk</strong> as a proportion <strong>of</strong> (or relative to) the initial<br />
rate. At this point, you may want to tell them that absolute<br />
<strong>risk</strong> reduction is an alternative term <strong>for</strong> <strong>risk</strong> difference. For<br />
the remainder <strong>of</strong> this article we will use “<strong>risk</strong> difference”<br />
because we think the term is more self-explanatory and because<br />
it applies to both increases and decreases in <strong>risk</strong>.<br />
Have learners record the relative <strong>risk</strong> reduction and the<br />
<strong>risk</strong> difference. Next, suggest that a second trial has been<br />
per<strong>for</strong>med in a less severely affected patient population.<br />
Draw the third bar (showing an event rate <strong>of</strong> 10%), telling<br />
them that it represents the event rate in this lower-<strong>risk</strong><br />
group. Ask them, “If these people are also given the treatment<br />
and it is as effective as it was in the more severely diseased<br />
patients (i.e., the relative <strong>risk</strong> reduction is constant),<br />
what will the event rate be in the treated group?” Someone<br />
will <strong>of</strong>fer 7.5% as the answer, and you can draw, or ask the<br />
learner to draw, this bar on the graph. Finally, ask the<br />
learners to calculate the <strong>risk</strong> difference <strong>for</strong> the second pair<br />
<strong>of</strong> bars (only 2.5%). Have them compare the relative <strong>risk</strong><br />
reduction and the <strong>risk</strong> difference in the high-<strong>risk</strong> population<br />
(25% and 10% respectively) with the same values <strong>for</strong><br />
the low <strong>risk</strong> population (25% and 2.5% respectively).<br />
The bottom line<br />
• An event rate is the number <strong>of</strong> people experiencing an<br />
event as a proportion <strong>of</strong> the number <strong>of</strong> people in the population.<br />
• The <strong>risk</strong> difference (absolute <strong>risk</strong> reduction) is the arithmetic<br />
difference between 2 event rates.<br />
• The relative <strong>risk</strong> reduction is the difference in event rates<br />
expressed in a proportional or relative manner, in relation<br />
to the control event rate.<br />
• <strong>Relative</strong> <strong>risk</strong> reduction is <strong>of</strong>ten more impressive than<br />
the <strong>risk</strong> difference. Furthermore, the lower the event<br />
rate in the control group, the larger the difference between<br />
relative <strong>risk</strong> reduction and <strong>risk</strong> difference.<br />
See Appendix 2 <strong>for</strong> the summary card <strong>for</strong> this tip.<br />
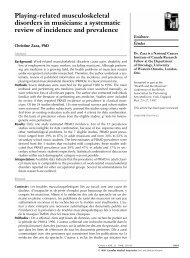
Event rate, %<br />
40<br />
30<br />
20<br />
10<br />
0<br />
Trial 1: high<strong>risk</strong><br />
patients<br />
Control<br />
Treatment<br />
Trial 2: low<strong>risk</strong><br />
patients<br />
The <strong>risk</strong> difference (also called the absolute <strong>risk</strong> reduction) is the simple difference in the event<br />
rates (<strong>for</strong> trial 1, 40% – 30% = 10%).<br />
<strong>Relative</strong> <strong>risk</strong> reduction is the difference between the event rates in relative terms. In both trials,<br />
the event rate in the treatment group is 25% less than the event rate in the control group (i.e., the<br />
10% <strong>risk</strong> difference in trial 1 expressed as a proportion <strong>of</strong> the control rate is 10/40 or<br />
25% less).<br />
Fig. 1: Results <strong>of</strong> 2 hypothetical randomized controlled trials <strong>of</strong> a new therapy. The blue bar in each trial represents the rate <strong>of</strong> a<br />
specified adverse event in untreated patients, and the green bar represents the rate in patients treated with the new therapy. The 2<br />
trials are per<strong>for</strong>med in patients with different baseline <strong>risk</strong>s <strong>for</strong> the adverse outcome: a high baseline <strong>risk</strong> <strong>for</strong> patients in trial 1 and<br />
a low baseline <strong>risk</strong> <strong>for</strong> those in trial 2.<br />
Online-2 JAMC • 17 AOÛT 2004; 171 (4)
<strong>Tips</strong> <strong>for</strong> <strong>teachers</strong> <strong>of</strong> <strong>evidence</strong>-<strong>based</strong> <strong>medicine</strong><br />
Teaching tip 2: Balancing benefits and adverse<br />
effects in individual patients<br />
When to use this tip<br />
This tip is suitable <strong>for</strong> intermediate to advanced learners,<br />
and the exercise requires 10–15 minutes. The general<br />
objective is to help learners apply <strong>evidence</strong> about intervention<br />
benefits and <strong>risk</strong>s to individual patients, with the following<br />
specific objectives:<br />
• Learn how to use a known relative <strong>risk</strong> reduction to estimate<br />
the <strong>risk</strong> <strong>of</strong> an event <strong>for</strong> a patient undergoing<br />
treatment, given an estimate <strong>of</strong> that individual’s <strong>risk</strong> <strong>of</strong><br />
the event without treatment.<br />
• Learn how to use <strong>risk</strong> differences (absolute <strong>risk</strong> reductions)<br />
to assess whether the benefits <strong>of</strong> therapy outweigh<br />
its harms.<br />
The script<br />
Walk the learners through the following hypothetical<br />
scenario. Each learner should imagine himself or herself as<br />
a family physician who is seeing Pat, a 69-year-old woman<br />
whose blood pressure during a routine examination is<br />
170/100 mm Hg. When Pat is seen again in a few weeks,<br />
her blood pressure is unchanged. She is otherwise well and<br />
has no history <strong>of</strong> cardiovascular or cerebrovascular disease.<br />
Tell the learners that they assess Pat’s <strong>risk</strong> <strong>of</strong> stroke at<br />
about 1% (or 1 in 100) per year. 9<br />
Tell the learners that a recent randomized trial <strong>of</strong> a<br />
newly released antihypertensive drug, drug X, reported a<br />
relative <strong>risk</strong> reduction <strong>for</strong> stroke <strong>of</strong> 33% over 3 years. Ask<br />
them to calculate Pat’s <strong>risk</strong> <strong>of</strong> stroke over 3 years with and<br />
without treatment with drug X. (Her <strong>risk</strong> over 3 years is<br />
3% without treatment and 2% with treatment, a <strong>risk</strong> difference<br />
<strong>of</strong> 1%.)<br />
Next, tell the learners about Dorothy, who is also 69<br />
years old and whose blood pressure is the same as Pat’s,<br />
170/100 mm Hg. However, because Dorothy had a<br />
stroke recently, the hypothetical physician assesses her<br />
<strong>risk</strong> <strong>of</strong> subsequent stroke as substantially greater than<br />
Pat’s, perhaps 10% per year. 10 Now, ask the learners to<br />
calculate the <strong>risk</strong> difference <strong>for</strong> Dorothy over 3 years,<br />
with and without drug X, using the same relative <strong>risk</strong> reduction<br />
(33%). You can use a blank version <strong>of</strong> Table 1<br />
to help learners determine the potential benefit <strong>of</strong> the<br />
drug. Insert the estimated 3-year event rates <strong>for</strong><br />
Dorothy and then apply the relative <strong>risk</strong> reduction<br />
(33%) expected if she takes drug X. It should be evident<br />
that Dorothy’s <strong>risk</strong> over 3 years falls from 30% to 20%,<br />
a <strong>risk</strong> difference <strong>of</strong> 10%.<br />
Finally, remind the learners that they need to factor any<br />
potential harms (adverse effects associated with using the<br />
drug) into their clinical decisions. You can tell them that in<br />
the clinical trials <strong>of</strong> drug X, the <strong>risk</strong> <strong>of</strong> severe gastric bleeding<br />
increased 3-fold over 3 years in patients who received<br />
the drug (a relative <strong>risk</strong> <strong>of</strong> 3). You can also tell them that a<br />
population-<strong>based</strong> study has reported the <strong>risk</strong> <strong>of</strong> severe gastric<br />
bleeding <strong>for</strong> women in your patients’ age group at<br />
about 0.1% per year (regardless <strong>of</strong> their <strong>risk</strong> <strong>of</strong> stroke).<br />
Have them work out the <strong>risk</strong> <strong>of</strong> severe gastric bleeding <strong>for</strong><br />
both Pat and Dorothy over 3 years with and without treatment<br />
with drug X. They should find that the <strong>risk</strong> is 0.3%<br />
without treatment and 0.9% with treatment, an absolute<br />
difference <strong>of</strong> 0.6%.<br />
By now, your learners should have filled in the table to<br />
look like Table <strong>1.</strong><br />
Ask them whether, given the results <strong>of</strong> this exercise,<br />
they would give drug X to Pat, to Dorothy or to both.<br />
You can anticipate that the discussion will ensue along the<br />
following lines. Pat will experience a small benefit (<strong>risk</strong><br />
difference over 3 years <strong>of</strong> about 1% <strong>for</strong> stroke), but this<br />
will be considerably <strong>of</strong>fset by the increased <strong>risk</strong> <strong>of</strong> gastric<br />
bleeding (<strong>risk</strong> difference over 3 years <strong>of</strong> 0.6%). The potential<br />
benefit <strong>for</strong> Dorothy (<strong>risk</strong> difference over 3 years <strong>of</strong><br />
about 10%) is much greater than the increased <strong>risk</strong> <strong>of</strong><br />
harm (<strong>risk</strong> difference over 3 years <strong>of</strong> 0.6%). There<strong>for</strong>e,<br />
the net benefit <strong>of</strong> treatment is likely to be greater <strong>for</strong><br />
Dorothy (who is at higher <strong>risk</strong> <strong>of</strong> stroke) than <strong>for</strong> Pat<br />
(who is at lower <strong>risk</strong>). Learners may also notice that assessment<br />
<strong>of</strong> the balance between benefits and harms de-<br />
Table 1: Benefit and harm table, as completed by learners (tip 2)<br />
3-yr event rate <strong>for</strong> stroke, %<br />
3-yr event rate <strong>for</strong> severe gastric<br />
bleeding, %<br />
Patient group<br />
No<br />
treatment<br />
With<br />
treatment<br />
(drug X)<br />
Absolute <strong>risk</strong><br />
reduction<br />
(no treatment –<br />
treatment)<br />
No<br />
treatment<br />
With<br />
treatment<br />
(drug X)<br />
Absolute <strong>risk</strong><br />
increase<br />
(treatment – no<br />
treatment)<br />
At lower <strong>risk</strong><br />
(e.g., Pat) 3 2 1 0.3 0.9 0.6<br />
At higher <strong>risk</strong><br />
(e.g., Dorothy) 30 20 10 0.3 0.9 0.6<br />
*Based on data from randomized controlled trials <strong>of</strong> drug X reporting a 33% relative <strong>risk</strong> reduction <strong>for</strong> the outcome (stroke) over 3 years and a 3-fold increase <strong>for</strong> the<br />
adverse effect (severe gastric bleeding) over the same period.<br />
CMAJ • AUG. 17, 2004; 171 (4)<br />
Online-3
Barratt et al<br />
pends on the value that patients place on reducing their<br />
<strong>risk</strong> <strong>of</strong> stroke in relation to the increased <strong>risk</strong> <strong>of</strong> gastric<br />
bleeding.<br />
Extension <strong>for</strong> more advanced learners<br />
Explain to the learners that these assessments are only<br />
valid if the relative <strong>risk</strong> reduction associated with the treatment<br />
and the <strong>risk</strong> <strong>of</strong> harm are constant at different levels<br />
<strong>of</strong> <strong>risk</strong> <strong>for</strong> the relevant outcome. This is generally true, 8<br />
and the assumption is helpful in calculating <strong>risk</strong> differences<br />
<strong>for</strong> individuals. 11 However, there are documented examples<br />
<strong>of</strong> relative <strong>risk</strong> varying with baseline <strong>risk</strong>. 12 Encourage the<br />
learners to discuss whether they think that the assumptions<br />
<strong>of</strong> constant relative <strong>risk</strong>s pertaining to benefit <strong>of</strong> therapy<br />
are likely to hold in this example. In the case <strong>of</strong> harm, <strong>risk</strong><br />
differences are likely to be stable and unrelated to the <strong>risk</strong>s<br />
<strong>of</strong> adverse outcomes from the underlying disease.<br />
The bottom line<br />
• Clinicians can tailor trial data to an individual patient<br />
by calculating <strong>risk</strong> differences if they know or can estimate<br />
the individual’s <strong>risk</strong> <strong>of</strong> the relevant outcomes (with<br />
and without treatment).<br />
• Presenting data as <strong>risk</strong> differences makes the benefits<br />
and harms <strong>of</strong> therapy easier to compare.<br />
See Appendix 2 <strong>for</strong> the summary card <strong>for</strong> this tip.<br />
Teaching tip 3: Calculating and using number<br />
needed to treat<br />
When to use this tip<br />
This tip is suitable <strong>for</strong> intermediate-level learners, and the<br />
exercise takes 15–20 minutes. The general objective is to introduce<br />
learners to the calculation and use <strong>of</strong> number needed<br />
to treat (NNT), with the following specific objectives:<br />
• Develop an understanding <strong>of</strong> the concept <strong>of</strong> NNT and<br />
how it is calculated from the <strong>risk</strong> difference.<br />
• Gain familiarity with the concept <strong>of</strong> NNT by comparing<br />
the NNTs that correspond to common interventions.<br />
Number needed to treat: definitions<br />
Number needed to treat: the number <strong>of</strong> patients who<br />
would have to receive the treatment <strong>for</strong> one <strong>of</strong> them to<br />
benefit; calculated as 100 divided by the absolute <strong>risk</strong><br />
reduction expressed as a percentage (or 1 divided by<br />
the absolute <strong>risk</strong> reduction expressed as a proportion;<br />
see Appendix 1)<br />
Number needed to harm: the number <strong>of</strong> patients who<br />
would have to receive the treatment <strong>for</strong> one <strong>of</strong> them to<br />
experience an adverse effect; calculated as 100 divided<br />
by the absolute <strong>risk</strong> increase expressed as a percentage<br />
(or 1 divided by the absolute <strong>risk</strong> increase expressed as<br />
a proportion)<br />
• Learn how to interpret the NNT and develop an understanding<br />
<strong>of</strong> how the “threshold NNT” varies depending<br />
on the patient’s values and preferences, the<br />
severity <strong>of</strong> possible outcomes and the adverse effects<br />
(harms) <strong>of</strong> therapy.<br />
Be<strong>for</strong>e they begin work on NNT, learners must already<br />
be familiar with event rates and <strong>risk</strong> difference. We have<br />
noticed that learners regularly stumble over the calculation<br />
<strong>of</strong> NNT. In particular, they experience confusion over<br />
whether to divide into 100 or into <strong>1.</strong> However, once they<br />
have grasped the concept, many learners find NNT an intuitively<br />
helpful way <strong>of</strong> presenting estimates <strong>of</strong> effect. As a<br />
bonus, this tip <strong>of</strong>fers learners some common values <strong>of</strong><br />
NNTs that can act as reference points <strong>for</strong> the interpretation<br />
<strong>of</strong> other values.<br />
The script<br />
The key to this tip is a table that is built up from learner<br />
contributions and which is then compared with “the truth,”<br />
as reported in published clinical trials. Three populations, interventions<br />
and outcomes <strong>for</strong>m the basis <strong>of</strong> the tip (Table 2).<br />
Start by asking the learners to imagine that a trial has<br />
been per<strong>for</strong>med in connection with each <strong>of</strong> these 3 situations<br />
in which patients con<strong>for</strong>ming to the population as<br />
described have been randomly assigned to receive either<br />
the specified intervention or a placebo. Ask them to guess,<br />
Table 2: Table <strong>of</strong> patients, interventions and outcomes, presented to learners at<br />
outset <strong>of</strong> tip 3<br />
Population Intervention Outcome <strong>of</strong> interest<br />
60-year-old patients with mild hypertension Diuretics Stroke over 5 years<br />
(blood pressure 150/95 mm Hg)<br />
60-year-old patients presenting 1 month after β-Blockers Death over 2 years<br />
myocardial infarction, with no heart failure<br />
60-year-old patients presenting with acute<br />
myocardial infarction Streptokinase Death over 5 weeks<br />
Online-4 JAMC • 17 AOÛT 2004; 171 (4)
<strong>Tips</strong> <strong>for</strong> <strong>teachers</strong> <strong>of</strong> <strong>evidence</strong>-<strong>based</strong> <strong>medicine</strong><br />
from their own experience or expectations, what the event<br />
rates would be in the control and treatment groups and<br />
also to guess the <strong>risk</strong> difference <strong>for</strong> each treatment and<br />
how many patients would have to be treated to prevent<br />
one outcome. For example, in 60-year-olds with mild hypertension<br />
(e.g., blood pressure 150/95 mm Hg), what<br />
event rate would be expected in the control group and the<br />
treatment group and what <strong>risk</strong> difference and NNT would<br />
be expected if the treatment group received diuretics over<br />
5 years to prevent stroke?<br />
Remember that the learners have not yet been told how<br />
to calculate NNT, nor have they been given a <strong>for</strong>mal definition<br />
<strong>of</strong> it. As a result, they will usually struggle and complain<br />
that they do not know how to calculate the numbers.<br />
This is to be expected, and they should be encouraged to<br />
guess or estimate (rather than calculate) each number.<br />
After the learners have struggled with this exercise <strong>for</strong> a<br />
few minutes, construct Table 3 and, without filling in any<br />
<strong>of</strong> the values yourself, ask them to independently write<br />
down their own estimates and then ask some (or all) <strong>of</strong><br />
them to write these estimates on the board. The learners’<br />
guesses may be very strange — the <strong>risk</strong> differences may be<br />
huge and there will be no mathematical relationship between<br />
the <strong>risk</strong> difference and the NNT because the learners<br />
will have guessed rather than calculated the numbers.<br />
Put no restrictions on these guesses – if they are wildly<br />
wrong then the impact <strong>of</strong> the exercise is only enhanced.<br />
After the learners have written their various estimates on<br />
the board, you can add the event rates <strong>for</strong> control and intervention<br />
groups <strong>for</strong> each condition, taken from published<br />
trials 13-15 (Table 3). The final column, labelled “NNT” will<br />
still be blank.<br />
Using these event rates, you can explain how to calculate<br />
NNT <strong>for</strong> those who do not already know. Learners not familiar<br />
with NNT will almost certainly stumble over the<br />
calculations. Confusion is <strong>of</strong>ten caused by the possibility <strong>of</strong><br />
presenting <strong>risk</strong> difference as a proportion (e.g., 0.25) or as a<br />
percentage (e.g., 25%). You can help them with this potential<br />
pitfall by emphasizing that if they have expressed <strong>risk</strong><br />
difference as a percentage, then they calculate NNT by dividing<br />
the <strong>risk</strong> difference into 100. Alternatively, if they<br />
have used a proportion to express the <strong>risk</strong> difference, then<br />
they calculate NNT by dividing the <strong>risk</strong> difference into <strong>1.</strong><br />
In Table 3, we have expressed all the rates and <strong>risk</strong> differences<br />
as percentages.<br />
An alternative to simply providing the <strong>for</strong>mula <strong>for</strong> NNT<br />
is to use the following approach, in which learners derive<br />
the <strong>for</strong>mula <strong>for</strong> themselves. Ask the following question: “If<br />
a disease has a mortality rate <strong>of</strong> 100% without treatment,<br />
and therapy reduces that mortality rate to 50%, how many<br />
people would you need to treat to prevent 1 death?” (Answer:<br />
2.) Continue with more examples, until the learners<br />
work out <strong>for</strong> themselves that NNT = 1/<strong>risk</strong> difference expressed<br />
as a proportion or 100/<strong>risk</strong> difference expressed as<br />
a percentage.<br />
You will now have completed the final column <strong>of</strong> Table<br />
3, and you will probably find that the learners are interested<br />
in the actual numbers <strong>for</strong> treatments they may be <strong>of</strong>fering<br />
on a daily basis. Most physicians overestimate the<br />
effects <strong>of</strong> their interventions, particularly in the treatment<br />
<strong>of</strong> hypertension.<br />
This exercise gives learners an opportunity to discuss<br />
how they would decide what is a reasonable NNT and introduces<br />
them to the concept <strong>of</strong> a threshold NNT, the<br />
maximum NNT that they and their patients would accept<br />
as justifying the <strong>risk</strong>s and costs <strong>of</strong> treatment. Determinants<br />
<strong>of</strong> the threshold NNT include the patient’s values<br />
and preferences, the severity <strong>of</strong> the outcome prevented,<br />
and the costs and side effects <strong>of</strong> the intervention. The<br />
learners will discover there is no simple answer to the<br />
question <strong>of</strong> when an NNT is sufficiently low to warrant<br />
treatment.<br />
Extension <strong>for</strong> more advanced learners<br />
For highly motivated learners, or if you have the luxury<br />
<strong>of</strong> running a workshop rather than just a 1-hour session,<br />
you can extend the discussion by looking at the marginal<br />
gain <strong>of</strong> using tissue plasminogen activator (t-PA) instead <strong>of</strong><br />
streptokinase in the treatment <strong>of</strong> acute myocardial infarction.<br />
The NNT <strong>for</strong> the marginal benefit <strong>of</strong> t-PA over<br />
streptokinase is about 100 to prevent 1 death over 30<br />
days. 16 Ask the learners if they think that number is clinically<br />
significant and what their own threshold NNT might<br />
Table 3: Estimates derived from published trials, to be presented to learners <strong>for</strong> comparison with their<br />
independent estimates (tip 3)<br />
Event rate, %<br />
Population, intervention and outcome <strong>of</strong> interest Control group Treatment group Risk difference, % NNT<br />
60-year-old patients with hypertension, diuretics, 2.9 <strong>1.</strong>9 <strong>1.</strong>0 100<br />
stroke over 5 years 13<br />
60-year-old patients 1 month after MI,<br />
9.8 7.3 2.5 40<br />
β-blockers, death over 2 years 14<br />
60-year-old patients with acute MI, streptokinase,<br />
death over 5 weeks 15 12.0 9.2 2.8 36<br />
Note: MI = myocardial infarction, NNT = number needed to treat.<br />
CMAJ • AUG. 17, 2004; 171 (4)<br />
Online-5
Barratt et al<br />
be. Point out that the NNT (as well as the <strong>risk</strong> difference)<br />
may vary significantly with the mortality <strong>risk</strong> <strong>of</strong> the individual<br />
patient, as has been demonstrated in the earlier tips<br />
in this article.<br />
The bottom line<br />
• NNT is a concise, clinically useful presentation <strong>of</strong> the<br />
effect <strong>of</strong> an intervention.<br />
• NNT is easily calculated from the <strong>risk</strong> difference.<br />
• Check whether the <strong>risk</strong> difference is presented as a percentage<br />
or a proportion and use a numerator <strong>of</strong> 100<br />
or 1 accordingly.<br />
• Care should be taken not to overestimate the effect <strong>of</strong><br />
treatments (i.e., use a value <strong>of</strong> <strong>risk</strong> difference that is too<br />
high) and thereby underestimate the NNT. 17<br />
See Appendix 2 <strong>for</strong> the summary card <strong>for</strong> this tip.<br />
Report on field-testing<br />
One <strong>of</strong> the authors (S.K.), an experienced teacher <strong>of</strong> <strong>evidence</strong>-<strong>based</strong><br />
<strong>medicine</strong> who was not involved in developing<br />
the scripts, field-tested the scripts in February 2000 with 16<br />
US medical residents during a <strong>1.</strong>5-hour teaching session.<br />
Of the 16 residents, 3 were naive learners with very little<br />
experience in <strong>evidence</strong>-<strong>based</strong> <strong>medicine</strong>, 10 had a working<br />
knowledge <strong>of</strong> <strong>evidence</strong>-<strong>based</strong> <strong>medicine</strong>, and 3 were already<br />
familiar and com<strong>for</strong>table with <strong>evidence</strong>-<strong>based</strong> <strong>medicine</strong><br />
concepts and skills.<br />
<strong>Tips</strong> 1 and 2 worked well to help learners understand<br />
relative <strong>risk</strong> reduction and <strong>risk</strong> difference, and the impact <strong>of</strong><br />
different baseline <strong>risk</strong>s on <strong>risk</strong> difference. Initially, the<br />
event and control rates in tip 1 were chosen to give a relative<br />
<strong>risk</strong> <strong>of</strong> 0.5. This had the advantage <strong>of</strong> very simple calculations<br />
but the disadvantage that the relative <strong>risk</strong> and the<br />
relative <strong>risk</strong> reduction had the same numeric value, which<br />
led to confusion. We there<strong>for</strong>e changed the event rates to<br />
avoid this problem.<br />
Tip 3 was the most popular with learners and sparked<br />
lively discussion. In the version used in the field testing,<br />
relative <strong>risk</strong> reduction was included in the tables. Learners<br />
became com<strong>for</strong>table converting between relative <strong>risk</strong><br />
reduction, <strong>risk</strong> difference and NNT. The ability to do<br />
these conversions was rated as the most important skill<br />
learners acquired by working through these exercises.<br />
S.K. found it helpful to distribute abstracts from ACP<br />
Journal Club, with the event rates left in but the relative<br />
<strong>risk</strong> reduction, <strong>risk</strong> difference and NNT blanked out.<br />
This exercise gave learners a further opportunity to practice,<br />
using real data.<br />
When asked about the relevance <strong>of</strong> the content and the<br />
clarity <strong>of</strong> the presentations, the learners gave high scores to<br />
all scripts (between 8.5 and 9.5 out <strong>of</strong> 10, on average),<br />
which indicates that they found the material both highly<br />
relevant and clear. As noted above, learners thought the<br />
most important message was the difference between relative<br />
<strong>risk</strong> reduction and <strong>risk</strong> difference and felt that it was<br />
important to be able to calculate both.<br />
Conclusions<br />
The ability to understand and calculate relative <strong>risk</strong> reduction,<br />
<strong>risk</strong> difference and NNT from data presented in<br />
clinical trials and systematic reviews is an essential skill <strong>for</strong><br />
clinicians seeking to apply clinical <strong>evidence</strong> to the care <strong>of</strong><br />
individual patients. We have presented a series <strong>of</strong> tips previously<br />
developed and used by experienced <strong>teachers</strong> <strong>of</strong> <strong>evidence</strong>-<strong>based</strong><br />
<strong>medicine</strong> <strong>for</strong> the purpose <strong>of</strong> overcoming<br />
common pitfalls that learners experience in acquiring<br />
these skills. The results <strong>of</strong> field-testing <strong>of</strong> these tips by an<br />
independent teacher, who was skilled in teaching <strong>evidence</strong>-<strong>based</strong><br />
<strong>medicine</strong> to clinical learners but was previously<br />
unfamiliar with these approaches, suggests that<br />
other educators may find this material useful in their own<br />
teaching.<br />
This article has been peer reviewed.<br />
From the School <strong>of</strong> Public Health, University <strong>of</strong> Sydney, Sydney, Australia (Barratt);<br />
the Columbia University College <strong>of</strong> Physicians and Surgeons, New York, NY<br />
(Wyer); the Department <strong>of</strong> Medicine, University <strong>of</strong> British Columbia, Vancouver,<br />
BC (Hatala); Mount Sinai Medical Center, New York, NY (McGinn); the Department<br />
<strong>of</strong> Internal Medicine, University <strong>of</strong> the Philippines College <strong>of</strong> Medicine,<br />
Manila, The Philippines (Dans); Durham Veterans Affairs Medical Center and<br />
Duke University Medical Center, Durham, NC (Keitz); the Department <strong>of</strong> Pediatrics,<br />
University <strong>of</strong> Texas, Houston, Tex. (Moyer); and the Departments <strong>of</strong> Medicine<br />
and <strong>of</strong> Clinical Epidemiology and Biostatistics, McMaster University, Hamilton,<br />
Ont. (Guyatt)<br />
Competing interests: None declared.<br />
Contributors: Alexandra Barratt contributed tip 2, drafted the manuscript, coordinated<br />
input from coauthors and reviewers and from field-testing, and revised all<br />
drafts. Peter Wyer edited drafts and provided guidance in developing the final <strong>for</strong>mat.<br />
Rose Hatala contributed tip 1, coordinated the internal review process and<br />
provided comments throughout development <strong>of</strong> the manuscript. Thomas McGinn<br />
contributed tip 3 and provided comments throughout development <strong>of</strong> the manuscript.<br />
Antonio Dans reviewed all drafts and provided comments throughout development<br />
<strong>of</strong> the manuscript. Sheri Keitz conducted field-testing <strong>of</strong> the tips and contributed<br />
material from the field-testing to the manuscript. Virginia Moyer<br />
reviewed and contributed to the final version <strong>of</strong> the manuscript. Gordon Guyatt<br />
helped to write the manuscript (as an editor and coauthor).<br />
References<br />
<strong>1.</strong> Malenka DJ, Baron JA, Johansen S, Wahrenberger JW, Ross JM. The framing<br />
effect <strong>of</strong> relative and absolute <strong>risk</strong>. J Gen Intern Med 1993;8:543-8.<br />
2. Forrow L, Taylor WC, Arnold RM. Absolutely relative: How research results<br />
are summarized can affect treatment decisions. Am J Med 1992;92:121-4.<br />
3. Naylor CD, Chen E, Strauss B. Measured enthusiasm: Does the method <strong>of</strong><br />
reporting trial results alter perceptions <strong>of</strong> therapeutic effectiveness? Ann Intern<br />
Med 1992;117:916-2<strong>1.</strong><br />
4. Fahey T, Griffiths S, Peters TJ. Evidence <strong>based</strong> purchasing: understanding<br />
results <strong>of</strong> clinical trials and systematic reviews. BMJ 1995;311:1056-60.<br />
5. Wyer PC, Keitz S, Hatala R, Hayward R, Barratt A, Montori V, et al. <strong>Tips</strong><br />
<strong>for</strong> learning and teaching <strong>evidence</strong>-<strong>based</strong> <strong>medicine</strong>: introduction to the series<br />
[editorial]. CMAJ 2004;171(4):347-8.<br />
6. Guyatt G, Rennie D, editors. Users’ guides to the medical literature: a manual <strong>for</strong><br />
<strong>evidence</strong>-<strong>based</strong> clinical practice. Chicago: AMA Publications; 2002.<br />
7. Barratt A, Wyer PC, Hatala R, McGinn T, Dans AL, Keitz S, et al. <strong>Tips</strong> <strong>for</strong><br />
learners <strong>of</strong> <strong>evidence</strong>-<strong>based</strong> <strong>medicine</strong>: <strong>1.</strong> <strong>Relative</strong> <strong>risk</strong> reduction, absolute <strong>risk</strong><br />
reduction and number needed to treat. CMAJ 2004;171(4):353-8.<br />
8. Schmid CH, Lau J, McIntosh MW, Cappelleri JC. An empirical study <strong>of</strong> the<br />
effect <strong>of</strong> the control rate as a predictor <strong>of</strong> treatment efficacy in meta-analysis<br />
<strong>of</strong> clinical trials. Stat Med 1998;17:1923-42.<br />
Online-6 JAMC • 17 AOÛT 2004; 171 (4)
<strong>Tips</strong> <strong>for</strong> <strong>teachers</strong> <strong>of</strong> <strong>evidence</strong>-<strong>based</strong> <strong>medicine</strong><br />
9. SHEP Cooperative Research Group. Prevention <strong>of</strong> stroke by anti-hypertensive<br />
drug treatment in older persons with isolated systolic hypertension. Final<br />
results <strong>of</strong> the Systolic Hypertension in the Elderly Program (SHEP). JAMA<br />
1991;265:3255-64.<br />
10. SALT Collaborative Group. Swedish Aspirin Low-dose Trial (SALT) <strong>of</strong><br />
75mg aspirin as secondary prophylaxis after cerebrovascular events. Lancet<br />
1991;338:1345-9.<br />
1<strong>1.</strong> Glasziou P, Irwig L. An <strong>evidence</strong> <strong>based</strong> approach to individualising treatment.<br />
BMJ 1995;311:356-9.<br />
12. Rothwell PM. Can overall results <strong>of</strong> clinical trials be applied to all patients?<br />
Lancet 1995;345:1616-9.<br />
13. Psaty BM, Smith NL, Siscovick DS, Koepsell TD, Weiss NS, Heckbert SR.<br />
Health outcomes associated with antihypertensive therapies used as first-line<br />
agents. A systematic review and meta-analysis. JAMA 1997;277:739-45.<br />
14. β-Blocker Health Attack Trial Research Group. A randomized trial <strong>of</strong> propranolol<br />
in patients with acute myocardial infarction. I. Mortality results.<br />
JAMA 1982;247:1707-14.<br />
15. ISIS-2 Collaborative Group. Randomised trial <strong>of</strong> intravenous streptokinase,<br />
oral aspirin, both or neither among 17 187 cases <strong>of</strong> suspected acute myocardial<br />
infarction: ISIS-2. Lancet 1988;2:349-60.<br />
16. The GUSTO Investigators. An international randomized trial comparing<br />
four thrombolytic strategies <strong>for</strong> acute myocardial infarction. N Engl J Med<br />
1993;329:673-82.<br />
17. Chatellier G, Zapletal E, Lemaitre D, Menard J, Degoulet P. The number<br />
needed to treat: a clinically useful nomogram in its proper context. BMJ<br />
1996;312:426-9.<br />
Correspondence to: Dr. Peter C. Wyer, 446 Pelhamdale Ave.,<br />
Pelham NY 10803; fax 212 305-6792; pwyer@worldnet.att.net<br />
Members <strong>of</strong> the Evidence-Based Medicine Teaching <strong>Tips</strong><br />
Working Group: Peter C. Wyer (project director), Columbia<br />
University College <strong>of</strong> Physicians and Surgeons, New York, NY;<br />
Deborah Cook, Gordon Guyatt (general editor), Ted Haines,<br />
Roman Jaeschke, McMaster University, Hamilton, Ont.; Rose<br />
Hatala (internal review coordinator), Department <strong>of</strong> Medicine,<br />
University <strong>of</strong> British Columbia, Vancouver, BC; Robert Hayward<br />
(editor, online version), Bruce Fisher, University <strong>of</strong> Alberta,<br />
Edmonton, Alta.; Sheri Keitz (field test coordinator), Durham<br />
Veterans Affairs Medical Center and Duke University, Durham,<br />
NC; Alexandra Barratt, University <strong>of</strong> Sydney, Sydney, Australia;<br />
Pamela Charney, Albert Einstein College <strong>of</strong> Medicine, Bronx, NY;<br />
Antonio L. Dans, University <strong>of</strong> the Philippines College <strong>of</strong><br />
Medicine, Manila, The Philippines; Barnet Eskin, Morristown<br />
Memorial Hospital, Morristown, NJ; Jennifer Kleinbart, Emory<br />
University, Atlanta, Ga.; Hui Lee, <strong>for</strong>merly Group Health Centre,<br />
Sault Ste. Marie, Ont. (deceased); Rosanne Leipzig, Thomas<br />
McGinn, Mount Sinai Medical Center, New York, NY; Victor M.<br />
Montori, Department <strong>of</strong> Medicine, Mayo Clinic College <strong>of</strong><br />
Medicine, Rochester, MN; Virginia Moyer, University <strong>of</strong> Texas,<br />
Houston, Tex.; Thomas B. Newman, University <strong>of</strong> Cali<strong>for</strong>nia, San<br />
Francisco, Calif.; Jim Nishikawa, University <strong>of</strong> Ottawa, Ottawa,<br />
Ont.; W. Scott Richardson, Wright State University, Dayton,<br />
Ohio; Mark C. Wilson, University <strong>of</strong> Iowa, Iowa City, Iowa<br />
Appendix 1: Formulas <strong>for</strong> commonly used measures <strong>of</strong> therapeutic effect<br />
Measure <strong>of</strong> effect<br />
<strong>Relative</strong> <strong>risk</strong><br />
<strong>Relative</strong> <strong>risk</strong> reduction<br />
Risk difference (absolute<br />
<strong>risk</strong> reduction)<br />
Number needed to treat<br />
Formula<br />
(Event rate in intervention group) ÷ (event rate in control group)<br />
1 – relative <strong>risk</strong><br />
or<br />
(Risk difference) ÷ (event rate in control group)<br />
(Event rate in intervention group) – (event rate in control group)<br />
1 ÷ (<strong>risk</strong> difference)<br />
For Appendix 2, please turn over to the next page.<br />
CMAJ • AUG. 17, 2004; 171 (4)<br />
Online-7
Barratt et al<br />
Appendix 2: Summary cards <strong>for</strong> 3 teaching tips on relative <strong>risk</strong> reduction, <strong>risk</strong> difference and number needed to treat<br />
This appendix has been designed so that it can be printed on a single sheet <strong>of</strong> 8 fi × 11 inch paper. The individual summary cards can then be cut<br />
out, if desired, <strong>for</strong> use during teaching sessions.<br />
Teaching tip 1: Understanding <strong>risk</strong> and <strong>risk</strong> reduction<br />
Scenario: Consider randomized trials <strong>of</strong> a therapy done on 2 populations, one with a high rate <strong>of</strong> a serious disease and the other with a<br />
lower rate. In each population, half the people are randomly assigned to receive a treatment <strong>for</strong> the disease.<br />
<strong>1.</strong> Draw 2 bars side by side to represent the results in the high-<strong>risk</strong> population:<br />
bar 1 is the event rate in the control group (40%), bar 2 is the event rate in the treatment group (30%).<br />
2. Ask the learners to describe the impact <strong>of</strong> treatment (<strong>risk</strong> difference 10%, relative <strong>risk</strong> reduction 25%).<br />
3. Repeat the process with bars 3 and 4 representing the results <strong>of</strong> the trial in the low-<strong>risk</strong> population: bar 3 is the event rate in the control<br />
group (10%), bar 4 is the event rate in the treatment group (7.5%), <strong>risk</strong> difference is 2.5%, and relative <strong>risk</strong> reduction is 25%.<br />
4. Learners discover the relation between the <strong>risk</strong> difference and the event rate in the control group.<br />
Summary points<br />
• Event rate is the percentage <strong>of</strong> people in a group experiencing an outcome event <strong>of</strong> interest.<br />
• Risk difference is the arithmetic difference in event rates achieved by therapy.<br />
• <strong>Relative</strong> <strong>risk</strong> reduction is the proportional decrease in event rates achieved by therapy.<br />
• <strong>Relative</strong> <strong>risk</strong> reduction is impressively larger than the <strong>risk</strong> difference when event rates are low.<br />
Teaching tip 2: Balancing benefits and adverse effects in individual patients<br />
Scenario: Consider 2 hypertensive patients (mean blood pressure 170/100 mm Hg); one patient (Pat) is asymptomatic, and the other<br />
(Dorothy) has a history <strong>of</strong> stroke. Both are being considered <strong>for</strong> a new antihypertensive, drug X, with relative <strong>risk</strong> reduction <strong>for</strong> stroke <strong>of</strong> 33%<br />
over 3 years. Drug X also increases the <strong>risk</strong> <strong>of</strong> severe gastric bleeding 3-fold over 3 years.<br />
<strong>1.</strong> a) Estimate Pat’s baseline <strong>risk</strong> <strong>of</strong> stroke as 1% per year or 3% over 3 years.<br />
b) Learners calculate Pat’s 3-year <strong>risk</strong> <strong>of</strong> stroke with drug X (2%).<br />
c) Learners calculate Pat’s 3-year <strong>risk</strong> difference <strong>for</strong> stroke (1%).<br />
2. a) Estimate Dorothy’s baseline <strong>risk</strong> <strong>of</strong> stroke as 10% per year or 30% over 3 years.<br />
b) Learners calculate Dorothy’s 3-year <strong>risk</strong> <strong>of</strong> stroke with drug X (20%).<br />
c) Learners calculate Dorothy’s 3-year <strong>risk</strong> difference <strong>for</strong> stroke (10%).<br />
3. a) Estimate Pat’s and Dorothy’s <strong>risk</strong> <strong>of</strong> severe gastric bleeding as 0.1% per year.<br />
b) Learners calculate the <strong>risk</strong> difference <strong>for</strong> severe gastric bleeding over 3 years <strong>for</strong> Pat and Dorothy (baseline <strong>risk</strong> = 0.3% over 3 years;<br />
with drug X = 0.9%; <strong>risk</strong> difference = 0.6%.)<br />
4. a) Learners compare the <strong>risk</strong> differences <strong>for</strong> Pat and Dorothy <strong>for</strong> both stroke and severe gastric bleeding.<br />
b) Learners discuss whether they would treat either <strong>of</strong> these 2 patients with drug X.<br />
Summary point<br />
• Trial data can be individualized by calculating and comparing <strong>risk</strong> differences <strong>for</strong> benefits and harms if a patient's <strong>risk</strong> <strong>of</strong> the relevant<br />
outcomes with and without treatment are known or can be estimated.<br />
Teaching tip 3: Calculating and using number needed to treat (NNT)<br />
Scenario: Consider 3 patients: a 60-year-old person with mild hypertension who is being treated with a diuretic to prevent stroke over 5 years; a<br />
60-year-old who had a myocardial infarction 1 month previously, has no congestive heart failure and is being treated with a β-blocker to prevent<br />
death over 2 years; and a 60-year-old with acute myocardial infarction treated with streptokinase to prevent death over 5 weeks.<br />
<strong>1.</strong> Learners guess the <strong>risk</strong> differences and NNTs <strong>for</strong> each treatment.<br />
2. Provide event rates in control and treatment groups, and calculate the <strong>risk</strong> differences (event rates <strong>for</strong> control group 2.9%, 9.8%, 12.0%<br />
respectively; event rates <strong>for</strong> treatment groups <strong>1.</strong>9%, 7.3%, 9.2% respectively; <strong>risk</strong> differences <strong>1.</strong>0%, 2.5%, 2.8% respectively).<br />
3. Explain how to calculate NNT from the <strong>risk</strong> difference (RD): NNT = 100/RD (NNTs 100, 40, 36 respectively)<br />
4. Compare learners’ guesses with the real data.<br />
5. Discuss threshold NNT.<br />
Summary points<br />
• NNT is a clinically useful measure <strong>of</strong> effectiveness.<br />
• NNT is easily calculated from <strong>risk</strong> difference.<br />
• Risk difference = control event rate - treatment event rate.<br />
• If the <strong>risk</strong> difference is expressed as a proportion, divide into 1; if expressed as a percentage, divide into 100.<br />
• Physicians <strong>of</strong>ten overestimate the effectiveness <strong>of</strong> treatments and underestimate the corresponding NNTs.<br />
Online-8 JAMC • 17 AOÛT 2004; 171 (4)