View - Clinical Chemistry
View - Clinical Chemistry
View - Clinical Chemistry

You also want an ePaper? Increase the reach of your titles
YUMPU automatically turns print PDFs into web optimized ePapers that Google loves.
CLIN. CHEM. 22/9, 1472-1482 (1976)<br />
A Minicomputer-Automated<br />
for Liquid-Chromatographic<br />
Array Spectrometer<br />
Detection of Metabolites<br />
Raymond E. Dessy,1 Warren D. Reynolds,2’3 Wayne G. Nunn,”<br />
Christopher A. Titus,1 and Gregory F. Moler2<br />
A third-9eneration multiwavelength array spectrometer<br />
was developed as a detector for the high-resolution liquid-chromatographic<br />
characterization of metabolites.<br />
Components include a PDP-8/e minicomputer, matched<br />
pair of linear photodiode arrays, holographically-ruled<br />
gratings, fiber optics, flow cells, and high intensity xenon<br />
light source. The wavelength range is 256 nm differential<br />
with 1-nm resolution and can be adjusted from 200 to 800<br />
nm. The system is capable of storing 20 spectra per second<br />
(200-456 nm) in a dual-beam mode. Special features<br />
include minicomputer-driven signal enhancement via integration<br />
as a function of signal strength. The display output<br />
includes presentation of the total absorption chromatogram<br />
vs. elution time in both real and post-run time as well as<br />
selectable single absorption band vs. elution time (post-run<br />
time). Application of this dedicated system is illustrated<br />
by the separation and characterization of the metabolites<br />
of a carcinogen, 4-ethylsulfonyl-1-naphthalenesulfonamide.<br />
AddItional Keyphrases: data processing #{149} screening #{149}<br />
metabolites in urine #{149} toxicology #{149} ultraviolet spectrometly<br />
#{149} inherited disorders<br />
During the past few years, considerable effort has<br />
been expended on developing and improving ultraviolet<br />
detectors for high-speed liquid-chromatographic separations<br />
of biochemically important components (1-14).<br />
Generally, these detectors can be divided into classes<br />
according to their end-use: monitoring and identification<br />
(4). For general monitoring purposes, most liquid<br />
chromatographs make use of a single-wavelength (element)<br />
detector at 254 or 280 nm (12). Other discrete<br />
element monitoring has been used, depending upon the<br />
specific component being sought (8). For qualitative<br />
identification needs, full ultraviolet scanning on each<br />
component in the liquid-chromatographic effluent<br />
yields additional spectroscopic information.<br />
‘Department of <strong>Chemistry</strong>, Virginia Polytechnic Institute and<br />
State University, Blacksburg, Va. 24061.<br />
2Fl and Drug Administration, National Center for Toxicological<br />
Research, Jefferson, Ark. 72079.<br />
to whom reprint requests should be made.<br />
Received April 5, 1976; accepted July 3, 1976.<br />
Although many varieties of rapid scanning spectrometer<br />
systems are available, the first -generation<br />
units relied on moving mechanical parts to scan the<br />
spectrum (12, 14). The second-generation instruments<br />
incorporated vidicon tubes, which eliminated the construction<br />
and maintenance problems associated with<br />
rotating mirrors or vibrating galvanometers (17, 18).<br />
But the vidicons suffer from substantial coherent pattern<br />
noise and limited integration time because of high.<br />
dark current and memory effects (15, 16). The recent<br />
availability of inexpensive solid-state linear photodiode<br />
arrays as simultaneous wavelength detectors has enabled<br />
the development of third -generation spectrometers<br />
for use in liquid chromatography.4<br />
The abUity to record total ultraviolet spectra instantaneously<br />
is accompanied by several advantages<br />
beyond simple component identification. These advantages<br />
become apparent by inspection of both time<br />
domain and spectral domain (12-20). In the time domain<br />
case, the simultaneous detection of all dispersed<br />
radiation (n spectral or spatial resolved elements) reduces<br />
the observation time by a factor of n in the case<br />
of measurements limited by the signal-to-noise ratio<br />
and improves this ratio by a factor of for a fixed<br />
observation time as in the case of fast liquid-chromatographic<br />
peaks (19, 20). However, further improvementa<br />
in the signal/noise ratio based on the Hadamard<br />
or Fourier methods are limited in the case of ultraviolet<br />
spectroscopy, because the noise is statistical and source<br />
dependent (15, 19).<br />
In the spectral domain, detection is improved by<br />
virtue of having access to information on the total ultraviolet<br />
spectrum. By summing the output intensity<br />
over all discrete 1-nm channels from 200-350 nm as a<br />
single output intensity, an advantage is gained over<br />
select single channel (254 nm) detectability.4 This increase<br />
in detectability varies from component to com-<br />
4Dessy, R., Nunn, W. C., Reynolds, W. D., and Titus, C. A., Linear<br />
photodiode array spectrometers as detector systems in automated<br />
liquid chromatographs. 27th Pittsburgh Conference on Analytical<br />
<strong>Chemistry</strong> and Applied Spectroscopy, March 1976, paper 375.<br />
1472 CLINICAL CHEMISTRY, Vol. 22, No. 9, 1976
ponent but depends on the ratio of the integrated area<br />
under the spectral curve (200-350 nm) to that at the<br />
selected single channel (250 nm):<br />
F<br />
35O<br />
I<br />
J200<br />
i25t<br />
I<br />
J250<br />
AdA<br />
AdA<br />
In most cases, this can produce a five- to 500-fold increase<br />
in sensitivity of detection. For high-speed liquid-chromatographic<br />
separations of biological samples,<br />
for which sample size may be limited or trace-level<br />
components (hormones) may be present in complex<br />
physiological mixtures (urine), this improved sensitivity<br />
would be an advantage (21).<br />
Along with the expanding use and development of<br />
pesticides, herbicides, food additives, plasticizers, and<br />
other environmental chemicals, there has been a<br />
growing concern for possible untoward effects of these<br />
chemicals in man. Long-term, low-dose feeding effects<br />
and related mechanistic studies of a few of these agents<br />
and model compounds are under investigation at this<br />
Center.2 Identification and monitoring of these agents<br />
and their metabolites can be highly useful in studies of<br />
an agent’s activity, toxicity, and mechanism of action.<br />
High-resolution anion-exchange liquid chromatography<br />
is an excellent analytical tool for studies of this kind<br />
because both unconjugated and conjugated metabolites<br />
can be separated for structural determination in a single<br />
sample without the need for hydrolysis or extensive<br />
sample pre-treatment. Anion-exchange has been used<br />
to separate diphenylhydantoin and its metabolites, the<br />
glucuronide and sulfate conjugates of p-nitrophenol,<br />
and p-hydroxyacetanilide metabolites as well as acetaminophen<br />
and its metabolites in human urine (22-24).<br />
Two recent books summarize the application of ionexchange<br />
liquid-chromatographic methods to problems<br />
in biochemistry and biology (25, 26).<br />
This system is composed of a minicomputer plus<br />
linear photodiode array spectrometer, for use as a detector<br />
for high-resolution ion-exchange liquid chromatography.<br />
We illustrate its application by describing<br />
the separation and characterization of conjugates of<br />
4-ethylsulfonyl-1-naphthalenesulfonamide in urine<br />
from BALB/C mice..<br />
Instrument<br />
General<br />
From experience with a prototype system consisting<br />
of a Reticon detector, light source, optics, and microprocessor,<br />
which was previously constructed by this<br />
group,4 we decided on the requirements for this type of<br />
dedicated system as follows:<br />
1. The liquid chromatographic detector system<br />
would need to include a dual-beam spectrometer to<br />
accommodate gradient elution.<br />
2. The system must be capable of taking about 25<br />
spectra per second to accommodate signal enhancement<br />
techniques (if required).<br />
3. The spectral range must be 200-450 nm.<br />
4. The system must be capable of operation in the<br />
absorption mode for ease of computer data handling.<br />
5. The ultraviolet source and electronics must be<br />
stable over long periods, because a typical liquid chromatographic<br />
run with an ion-exchange column might<br />
require 80 hours.<br />
6. Because of the large volume of data (2.5 million<br />
data words/run) expected, all meaningful raw spectral<br />
data must be stored on disk for limited post-run appraisal<br />
and then transferred to industry-compatible<br />
tape for storage or transfer to the central computing<br />
facility, where it would be subjected to various in-depth<br />
data-reduction programs.<br />
7. The output format should include total integrated<br />
absorption at all measured wavelengths vs. elution time<br />
(real-time liquid chromatogram) and selectable singleS<br />
band wavelengths vs. elution time as well as individual<br />
spectra.<br />
8. For data handling and reduction, a minicomputer<br />
with 12K core and a teletype, disk, scope, magnetic tape,<br />
and plotter devices will be required.<br />
These were the ideal criteria, which might not all<br />
necessarily be met, or need to be met in ultimate use.<br />
The exploration stage would involve a period when it<br />
was not known which wavelengths (200-450 nm) were<br />
of most importance to the metabolite characterization<br />
research. It might be necessary to rescreen previous runs<br />
many times to finally focus on the observations that<br />
would be used in component identification or for routine<br />
monitoring.<br />
The present automated liquid chromatography/ultraviolet<br />
spectrometry system consists of several major<br />
units, including the high-resolution liquid chromatograph<br />
with associated electro-mechanical and electronic<br />
controls, a 12-bit computer unit based around a<br />
PDP-8/e CPU with 12K of memory and with four interactive<br />
storage and display devices, and a spectrometer<br />
unit consisting of a xenon light source, fiber optics,<br />
and a pair of holographically ruled gratings along with<br />
two cooled (-30 #{176}C) photodiode arrays. Each of these<br />
major units is discussed in the following sections.<br />
Liquid<br />
Chromatograph<br />
A high-resolution liquid chromatograph unit utilizing<br />
the 150-200 cm ion-exchange column similar to that<br />
developed by Scott and co-workers was fabricated, with<br />
some additions and changes (27). A pH-gradient section<br />
was added that develops a descending hyperbolic gradient<br />
in pH (8 - 4.40) during the first 5 h of the 60-h<br />
run. The system is gradient-programmable in five separate<br />
inter-dependent functions. The five functions<br />
control the two separate gradient development cycles<br />
and a final wash cycle as well as start and stand-by<br />
modes. The pH and buffer gradients are developed by<br />
use of two solution reservoirs, an initial mixing vessel<br />
solution, and a wash reservoir. The mixing vessel<br />
starting solution contains 0.1 mol/liter buffer (ammonium<br />
acetate/acetic acid) adjusted to pH 9 while the<br />
other two source reservoirs contain “acid solution” (pH<br />
CLINICAL CHEMISTRY, Vol. 22, No. 9, 1976 1473
L<br />
0<br />
C.)<br />
2<br />
Fig. 1. Flow diagram of high pressure anion-exchange liquid<br />
chromatograph<br />
E<br />
4.0, 3 mol/liter buffer) and “buffer solution” (pH 4.40,<br />
6 mol/liter), respectively. The mixing vessel (stirred) is<br />
fed from the three reservoirs through three separate<br />
solenoid valves and a mixing-vessel feeder pump (two<br />
pre-set speeds). A sequence of mixing steps is pre-determined<br />
by the operation of the electronic counter/<br />
timers and sequential pump speed control. Any combination<br />
of curve/linear gradients can be set by this<br />
operation. For example, a descending pH gradient can<br />
be superimposed on a slowly increasing linear buffer<br />
gradient. A flow diagram of the liquid chromatograph<br />
unit is shown in Figure 1.<br />
All materials contacting the sample and solutions are<br />
Grade 316 stainless steel, glass, or Teflon.<br />
Several columns (3 mm o.d. X 75, 100, and 150 cm)<br />
have been used for the determination of the optimum<br />
separation of components in the urine of BALB-C mice.<br />
Various anion-exchange resins and particle sizes, from<br />
several manufacturers, have been used. Aminex A-27<br />
(BioRad), average particle diameter 13.5 m, was used,<br />
with fair resolution but with a high pressure drop (34.5<br />
mPa for 8 mol/liter buffer). Another Aminex resin (1-<br />
X8L: 9160) of smaller size (5-8 iim, according to our<br />
measurements) was used in a 100-cm column with excellent<br />
resolution, but the pressure drop was excessive<br />
(-42.8 mPa) at 70 iil/min. A nominal 8 ± 1 m resin<br />
(which we measured as 5.2-6.0 zm) in a 100-cm column<br />
gave nearly identical resolution; this resin was from<br />
Durrum Instrument Corp., Palo Alto, Calif. 94303.<br />
However, the Aminex A-28 (5 tm, 150-cm column) appeared<br />
to be the best compromise between flow-rate<br />
(elution time), pressure drop, and resolution of the<br />
many urinary components from the conjugates of the<br />
model compound, 4-ethylsulfonyl-naphthalene-1 -sulfonamide.<br />
Figure 2 exemplifies the separation of both<br />
the conjugates of 14C-labeled 4-ethylsulfonyl-1-<br />
naphthalenesulfonamide and urinary components.<br />
I<br />
0<br />
I<br />
CD<br />
2’<br />
LL 0.<br />
1474 CLINICAL CHEMISTRY, Vol. 22, No. 9, 1976
#{149}<br />
C<br />
#{149}0<br />
0<br />
p.. 3<br />
S<br />
4<br />
3<br />
I<br />
S<br />
S<br />
:2<br />
2<br />
U<br />
S<br />
WAVftINOTH<br />
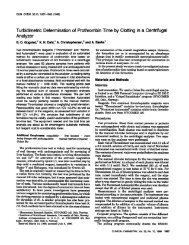
Fig. 3. Spectral irradiance curve vs. wavelengths of 150 watt<br />
xenon source<br />
DrncT0#{149}<br />
DIT1CTOI<br />
(NAHOMITS)<br />
HOLO0IAPHICALY<br />
1ULID CONCAVI<br />
OIATINGI<br />
Fig. 4. Optical path including liquid chromatographic flow-cells<br />
for photodiode array spectrometer<br />
Reticon<br />
Spectrometer<br />
Light source. A high-intensity 150 W xenon arc lamp<br />
and h’ousing with regulated power supply was utilized<br />
for the ultraviolet source (Model 7301, Oriel Corp.,<br />
Stamford, Conn. 06902). A fairly smooth continuum<br />
output develops from 190 to 750 nm, as seen in the<br />
typical spectral output curve (Figure 3). The source size<br />
is 0.5 mm X 2.2 mm; the image size at the focal point (76<br />
mm from housing) is 0.9 mm X 4.0 mm.<br />
Flow-cell. The micro flow-cells, one each for the reference<br />
and sample beams, were fabricated in the usual<br />
Z configuration. The dimensions chosen depended both<br />
on the size of the available light beam from the fiber<br />
optics and the optimum absorption lightpath/volume<br />
ratio (1 cm/31 tl) for chromatograph band-width (21).<br />
These flow-cells were made from stainless steel, with<br />
quartz windows and Teflon gaskets.<br />
Grating. The necessity of attaining sub-nanogram<br />
sensitivity required a system with best available optics.<br />
We used a high-quality holographically-ruled concave<br />
grating (600 lines/mm, Model 3B; J-Y Optical Systems,<br />
Metuchen, N. J. 08840), which minimized problems<br />
with spherical aberration as well as keeping reflection<br />
and transmission losses to a minimum (17).<br />
Optical path and sensitivity. A metal housing with<br />
the interior painted a nonglossy black, which was also<br />
light-tight and purgeable with nitrogen, was fabricated<br />
for the optics system. All external entrances and exits<br />
were constructed so as to minimize light leakage. An<br />
optical configuration based on a Rowland circle (F/3.0,<br />
200 mm) as shown in Figure 4 was placed inside this<br />
housing. Transmission and reflection losses were kept<br />
---<br />
WAVII.UIGTH<br />
Fig. 5. Quantum efficiency response vs. wavelength of the<br />
photodiode array (Reticon)<br />
to a minimum by using a grating and fiber-optic bundles.<br />
The fiber-optics bundle further reduced the optical<br />
alignment problem and allowed the system to run for<br />
long periods without recalibration. The overall system<br />
involved an F/3.0 rather than the earlier prototype of<br />
F/4.5.4<br />
Design and optimized performance calculations,<br />
which are summarized in Appendixes 1,11 and III, were<br />
completed on the optical system from the light source<br />
to signal read-out. The maximum dynamic range of a<br />
pixel5 in the linear array was calculated to be 40 000/1<br />
(Appendix I). Theoretical design calculations of source<br />
strength and sensitivity indicate that with a liquidchromatographic<br />
effluent sample containing guanosine<br />
= 11 050) and an estimated peak width of 3 mm<br />
(31-zl cell volume), as little as 1 ng can be detected<br />
(Appendixes I and II).<br />
Reticon detector. The silicon photodiode linear array<br />
detector uses a reverse biased p-n junction diode as the<br />
photosensitiveelement. These linear arrays are available<br />
in several pixels per array sizes and pixel areas.<br />
Currently, arrays can be obtained with 128 to 1024<br />
pixels per array with pixel areas of either 1 X 1 mil or 1<br />
X 17 mil. These linear arrays are light sensitive from<br />
below 200 to above 900 nm and are most efficient in the<br />
600-820 nm region, as shown in the photon efficiency<br />
curve (Figure 5). The quantum efficiency at each<br />
wavelength is corrected to a maximum value of 1.0 by<br />
a computer assembly language sub-routine before the<br />
data are stored.<br />
Because the wavelength region of interest for the<br />
present instrument is 200-400 nm, a 256-linear array<br />
was selected that would enable 1-nm resolution (1 mil<br />
centers) and a 256-nm range (200-456 nm). However,<br />
this range can be adjusted to any 256-nm band in the<br />
200-900 nm region. Two matched arrays, which are<br />
individually housed with Pelletier cooling plates (-30<br />
#{176}C), were selected based on their identical energy response<br />
(Model RL256 EC/17; Reticon Corp., Sunnyvale,<br />
Calif. 94086). The cooled detectors decreased electronic<br />
noise originating from room-temperature by a factor of<br />
20 (15). A 256-linear photodiode array with a printedcircuit<br />
background is illustrated in Figure 6 and a<br />
schematic of the linear array is shown in Figure 7. The<br />
photodiode array operates as follows:<br />
A pixel isa single photodiode and, in the present design, it receives<br />
the light from a single one nm band.<br />
(nm)<br />
1<br />
I<br />
CLINICAL CHEMISTRY, Vol. 22, No. 9, 1976 1475
0<br />
rrrTTTrnr<br />
10O.<br />
TIME m S<br />
Fig.8. Time base responseof a single pixel (element)to varying<br />
light intensity (lower). Video line pulse signal to the single pixel<br />
capacitor (upper)<br />
Fig. 6. Photodiode linear array (256 pixels) with printed circuit<br />
background<br />
LI<br />
-TT-t<br />
ELEMENT 1 2<br />
T<br />
INDICATE<br />
SHIFT EEGISTU JO END OF<br />
SCAN<br />
. . . S.<br />
A PHOTODIODE<br />
E!:.J.)<br />
4<br />
VIDEO<br />
0 COMMON<br />
1+5 VOLTS)<br />
Fig. 7. Schematic of photodiode linear array-operational<br />
view<br />
1. As light strikes the surface of the detector, electron<br />
hole-pairs are created, and charge migration occurs<br />
toward the capacitor element (Figure 7).<br />
2. As the light continues to strike the detector surface,<br />
this action leads to a gradual discharge of the capacitor.<br />
3. Over the integration time, the charge on the capacitor<br />
drops an amount equivalent to the amount of<br />
integrated light falling on th&detector.<br />
4. When the photodiode (pixel) is “read,” a multiplexer<br />
attaches the detector to a voltage source that<br />
charges the capacitor back up to a standard potential.<br />
5. A signal, corresponding to the current-flow necessary<br />
to recharge the voltage source, is sent down a wire<br />
(video-line).<br />
6. The multiplexer then causes the voltage source to<br />
be switched to the next photodiode in the detector, and<br />
the process is repeated.<br />
Solid-state linear photodiode array (Reticon)<br />
“read-out”. In the fast scanning environment of high<br />
resolution liquid-chromatographic operation, continuous<br />
monitoring of the photodiode array is unnecessary.<br />
1000 spectra per second provides more data than can be<br />
either stored or handled by a dedicated minicomputer.<br />
In practice, it is normal to initiate data collection only<br />
periodically. The data-collection process begins by<br />
clearing all photodiodes of previous stored charge.<br />
During a dead period, when the detector is not being<br />
used, the light striking the detector’s surface rapidly<br />
leads to saturation of all photodiodes. (See Appendix<br />
I for “saturation time”). Before spectral information is<br />
gathered, the array must be “dummy read” by applying<br />
a read pulse that starts the drive electronics, and all<br />
photodiodes in the array are recharged back to their<br />
starting charge points. The jth photodiode in the array<br />
is read-out at a different time than the zth photodiode.<br />
However, the time interval between the reading out of<br />
the jth photodiode in successive scans is the same for<br />
successively read zth photodiodes. Because cycling the<br />
photodiodes is fast compared to the liquid-chromatographic<br />
effluent concentration changes being observed,<br />
a truly simultaneous multiwavelength detector is involved.<br />
Consequently, each individual photodiode is<br />
continually “on” except for a very short “blink” out of<br />
each cycle and can be “on” for as much as 95% of the<br />
time.<br />
If one views the single video line output of the device,<br />
a series of pulses appear, each corresponding to the<br />
amount of light striking a photodiode in the array<br />
(Figure 8). These arrays operate with the multiplexer<br />
switching between photodiodes at a clock rate of 1 kHz<br />
to slightly above 1 MHz. A complete reading of the array<br />
(256 photodiodes) can be as fast as 12 ms, as slow as 0.25<br />
s. The integrate time can be altered between the limits<br />
of the array “shift out” rate (20 kHz) and the time when<br />
the dark-current noise becomes a serious problem. This<br />
places an upper limit of 80 spectra/s to a lower limit of<br />
1 spectra/bOO s (4 s/pixel) for the cooled array. For<br />
optimum integration time, a rate of 20 spectra/s was<br />
chosen.<br />
The serial pulse train arising from the common video<br />
line of the detector is passed through an amplifier, integrate,<br />
sample, and hold system with high rejection of<br />
periodic noise. Most of the electronic noise in the detector<br />
arises from switching transients induced at times<br />
shown in Figures 8 and 9. Each pulse is integrated over<br />
most of its width, which leads to a reduction in noise by<br />
the analog integration operation. A schematic of the<br />
detector and amplifiers for both “real time” recording<br />
output (strip-chart) and minicomputer data acquisition<br />
(absorbance, transmittance) is shown in Figure 10. The<br />
recording output is a sum of the absorbance signal over<br />
all measured wavelengths (200-450 nm) for a given set<br />
of “scans”.<br />
1476 CLINICAL CHEMISTRY, Vol. 22, No. 9, 1976
Fig. 9. Typical switchingtransientdevelopedduringa single pixel<br />
read-out<br />
Detail from Figure 8<br />
Fig. 11. Mini-computer configuration with I/O devices<br />
taken, and allows data to be taken only when there is a<br />
signal above the baseline. If the response in the reference<br />
beam falls below a pre-set level, the integration<br />
---U<br />
ca&<br />
#{149}.<br />
EU<br />
c<br />
Fig. 10. Schematic of Reticon Array Detectors (sample, reference)<br />
and analog “front-end” for computer input<br />
Computer<br />
General. The basic computer configuration used to<br />
acquire, process, and display the formatted spectral<br />
data is based around a 12-bit minicomputer (PDP 8/e;<br />
Digital Equipment Corp., Maynard, Mass. 01754) with<br />
12K words of core memory. Additional bus-bar hardware<br />
components include a 10 bit A/D convertor<br />
(AD8A), real-time clock (DK8E-P), 10-Hz dayclock,<br />
D/A convertor (VC-8E point plot) and hardware multiply/divide<br />
processor (KE8E). The storage devices<br />
include two 3.2-million data word disk and controller<br />
units (RK8E) and a nine-track magnetic tape (TU-lO).<br />
All the preceding is from Digital Equipment Corp. The<br />
input/output devices include a multispeed alphaI<br />
numeric terminal (LA-36, Digital Equipment Corp.),<br />
incremental plotter (Cal-Comp No. 565; California<br />
Computer Products, Anaheim, Calif. 92801) with interface<br />
(XY8E; Digital Equipment Corp.) and display<br />
oscifioscope (No. 5051; Tekronix Corp., Beaverton, Ore.<br />
97005). Figure 11 shows a configuration diagram of the<br />
computer system.<br />
Operation. The central processor unit (CPU) uses a<br />
10-bit A/D convertor to change the incoming analog<br />
signal from the detector to digital, which is stored in a<br />
4K data word input buffer in the CPU. The data input<br />
rate is controlled by two separate clocks. The first<br />
real-time clock is used to control the integration or exposure<br />
time of the linear array. The second clock is used<br />
as a day clock; it is started when a liquid chromatographic<br />
run is started, read each time a spectrum is<br />
time is increased in binary progression. This operation<br />
corresponds to slit opening on a regular spectrometer,<br />
but without loss in resolution. The integration time (a<br />
AISOSIANCI two-bit number) and the output of the A/D (a 10-bit<br />
number) are ANDED to provide a 12-bit data point for<br />
each photodiode (pixel) in the array yielding a dynamic<br />
range of 1000:1.<br />
T.ANsMITtAHcI The three data modes (absorbance, transmittance,<br />
or integral) are carried by the analog multiplexer that<br />
acts as an auxiliary to the A/D convertor. The data are<br />
collected in ping pong double buffers. As each buffer is<br />
filled, it is transferred to the disks by using assembler<br />
drivers that are interrupt oriented. By using this type<br />
of rotating buffer for data storage, the possibility of<br />
missing incoming data is small. The data are stored on<br />
disk in single-word-binary formatted files.<br />
The analog amplifiers perform all the correction<br />
functions except the one for responsivity of the linear<br />
array (see Figure 5). This calibration function is accomplished<br />
in the computer by binary adding the appropriate<br />
correction factor stored in memory for each<br />
wavelength as a log. The addition function is much<br />
faster than other math operations since data throughput<br />
is at a premium for the computer signal enhancement<br />
technique..<br />
Software. A series of software routines were written<br />
in various levels of computer languages (assembler,<br />
BASIC, and FORTRAN) to acquire data, transfer to<br />
mag-tape, and to format and display the data. After the<br />
liquid-chromatographic run is over, User Service Routines<br />
and assembly coding is used to rewrite the directory<br />
area of the Operating System (OS-8) so that access<br />
to the data may be had by using conventional keyboard<br />
or User Service Routine assembler calls. An overview<br />
schematic of the software support is shown in Figure 12.<br />
A flow-chart for the shortest of the 10 software programs<br />
is shown in Figure 13.<br />
I/O display. During the 60-h liquid-chromatographic<br />
run, a large amount of data (approximately 2.5 X 10⁶<br />
data words) will be acquired that requires display in<br />
standard spectral and chromatographic format. During<br />
a liquid-chromatographic run, the Total Absorbance<br />
Chromatogram (TAC) is plotted out on a Y/t plotter<br />
CLINICAL CHEMISTRY, Vol. 22, No. 9, 1976 1477
USIa DIaVICI<br />
1007111 LOCKUP<br />
IN COIl<br />
(HillS)<br />
INPUT ITS, 11101 IKTUIN, HALT<br />
DIVICI HANDLII 11101 HAIDW*II PAftull 01<br />
HIlT P1001*1 NOT<br />
PITCH)<br />
POUND<br />
PILl PLOT lIDS<br />
ON STITIM 11101 HITUIN<br />
DIVICI<br />
UNTIl)<br />
DITIRMINI DATA FILl PLOT IDA<br />
STAUTINO PT FOUND<br />
SLed IIHOI<br />
AND LINOTH OP<br />
DATA PILl IITUIN CHAIN 2<br />
PLOT IDA<br />
LOOK UP<br />
OOKUP STAITING iTS. MON<br />
hAD ONI ILK<br />
OP DATA P101 - ILOCK OP STSTIN NOT POUND<br />
PLOT IDA 3) MONITOI PILl IDIOt ON DLI<br />
ON DLI CHAIN HALT<br />
3)<br />
Fig. 12. Overview of computer system data flow and display<br />
CONVIIT DATA<br />
TO 3 WelD<br />
INTIOII<br />
)LOOP 2. LOOP I<br />
INPUT<br />
IUOO.SV<br />
FILl<br />
associated with the system. This is the normal liquidchromatographic<br />
plot of response vs. time that is typical<br />
of single-wavelength monitors. The post-run operations<br />
include the following:<br />
1. Plotting time vs. absorbance at any single wavelength,<br />
continuous band of wavelengths, or selected<br />
group of wavelengths. A digital incremental plotter is<br />
used to provide the resolution and labeling required for<br />
documentation purposes.<br />
2. Listing every chromatographic peak and its retention<br />
time on the system terminal so that the technician<br />
can determine the elution time of a component<br />
for preparative purposes.<br />
3. Present an oscilloscopic display of any given<br />
spectrum.<br />
4. Dumping of the data to industry-compatible tape<br />
for storage, or transfer to a larger computer for full<br />
spectral display purposes, or library search and<br />
matching of cataloged spectra.<br />
Application<br />
Pathological Effects (Mice)<br />
4-Ethylsulfonylnaphthalene- 1-sulfonamide has<br />
several effects on the mouse bladder epithelium (C57<br />
female, 12 weeks). A single oral dose (5-160 mg/kg 6ody<br />
wt) induces epithelial Iyperplasia of the bladder in<br />
mice. Administration of 100 mg/kg of diet for eight<br />
weeks produces a greater degree of epithelial hyperplasia<br />
and, frequently, bladder tumors at 30 weeks<br />
(30-32). The compound initially causes a violent proliferative<br />
epithelial response, which later settles into a<br />
chronic phase in which cell tumors vary from animal to<br />
animal and site to site within the same bladder.<br />
The sulfonamide group appears to be essential to the<br />
activity of the molecule (31). Activity was maximum<br />
when the sulfonamide group was attached to an aromatic<br />
system (benzene or naphthalene) containing an<br />
alkylsulfonyl or sulfonamide group (31). These implications<br />
of structure/activity relationship have a bearing<br />
on the non-nutritive artificial sweeteners (30).<br />
[‘4C] 4-Ethylsulfonyl-1-naphthalenesulfonamide<br />
metabolites<br />
The metabolism of [‘4C] 4-ethylsulfonyl- 1-naphthalenesulfonamide<br />
in mice strains is not fully<br />
DIGIN<br />
UNDID ILOCKS IXICUTION<br />
IN LAST WOUD<br />
P01 POHT OP NIW<br />
COMPATASILITY P1001*1<br />
C.,,.<br />
FLOAT THIII SOlD<br />
(LOOP. LOOP I,<br />
OUTPUT<br />
OUT<br />
LOOP A)<br />
CONVIITI<br />
DATA TO DII: III<br />
SITUP<br />
(WIlTS)<br />
POINTIIS<br />
POD HIlT IIAD<br />
AND<br />
IPlDi’,.,<br />
INPUT<br />
DATA<br />
WIlTS<br />
NO<br />
IND OP<br />
UPACI POP<br />
OUTPUT<br />
IS<br />
IITUIN<br />
dOll OUTPUT DATA III<br />
PILl PLOT I1.DA<br />
(INO) IITUIN<br />
DITIRMINI<br />
STAITINO<br />
ILOCK OP PLOTTINO III<br />
P1001*1 IIC2.3V ISTUIN<br />
KNPUI<br />
INPUT P1001*1<br />
AND ISGIN<br />
CUTION<br />
Fig. 13. Software program for binary to three word floating point<br />
convertor<br />
known. In the current series of studies, three female<br />
BALB/C mice (20 weeks old) were each fed 1.05 iCi of<br />
14C-labeled 4-ethylsulfonyl-1-naphthalenesulfonamide<br />
(sp. acty., 11 Ci/mol). A 24-h urine was collected in<br />
special metabolism cages. The pooled urine was filtered<br />
through a Millipore filter (0.2 tin av pore size) before<br />
chromatography. Twenty-five microliters of the ifitered<br />
urine was injected onto the 3 mm>< 150 cm Aminex<br />
A-28 anion-exchange column and eluted with both the<br />
pH and buffer gradients during the 55-h period. The<br />
separation was conducted under the following conditions:<br />
0.1 ml/min flow-rate, 70 #{176}C (isothermal), hyperbolic<br />
descending pH gradient (8 - 4.40) during the first<br />
5 h, ascending buffer gradients 0.1 to 6 mol/liter (aminonium<br />
acetate/acetic acid) during a 0-30 h period,<br />
holding 6 mol/liter buffer constant during the remaining<br />
elution period (hours 30 to 55). Individual 14C-contaming<br />
fractions were counted by a Nuclear-Chicago,<br />
Mark II liquid scintillation instrument equipped with<br />
a Model PDS/3 data reduction system. The 1-ml frac-<br />
(CHAIN)<br />
1478 CLINICAL CHEMISTRY, Vol. 22, No. 9, 1976
IN<br />
V<br />
z<br />
4<br />
0<br />
Ia<br />
1.0<br />
0.7<br />
0.5<br />
Ia<br />
4<br />
I<br />
0.3<br />
II<br />
I I----a<br />
20 250 300 350<br />
_a<br />
WAVELENGTH<br />
Fig. 14. Ultraviolet spectrum (200-350 nm) of [14C]4-ethylsulfonyl-1-naphthalenesulfonamide,<br />
from Reticon spectrometer<br />
IN<br />
U<br />
z<br />
1.0<br />
(nm)<br />
‘I S<br />
I<br />
I \<br />
I<br />
0.3 s /<br />
/<br />
I<br />
I<br />
0.3 I I<br />
/<br />
‘a, I’<br />
C II (III I I I II<br />
200 230 3<br />
WAyft1GTh<br />
Fig. 15. Ultraviolet spectrum of [‘4C]4-ethylsulfonyl-1-naphthalenesulfonamide<br />
metabolite, from Reticon spectrometer<br />
tions were added to a vial containing 12 ml of PCS<br />
solubilizer (Amersham-Searle Corp., Arlington Heights,<br />
Ill. 60005) and counted for 20 mm. The count-rate data<br />
(dpm) vs. retention time for each lO-min fraction having<br />
significant radioactivity (dpm >50) was plotted as<br />
shown in Figure 2 (cross-hatch). The radioactive unmetabolized<br />
[‘4C]4-ethylsulfonyl- 1-naphthalenesulfonamide<br />
and its individual radioactive metabolites are<br />
shown at retention times of: 26.5, 31.0, 35.5, 43.3, and<br />
53.0 h. These radioactive peaks account for 96% of the<br />
total measured radioactivity in the 25-id urine sample.<br />
Liquid Chromatography/Ultraviolet<br />
Spectrometry Display<br />
Work is continuing on improving the computerdriven<br />
plotter display of both the Total Absorbance<br />
Chromatogram and the Absorbance Band Chromatogram.<br />
A recent example of the spectral output for both<br />
[14C]4-ethylsulfonyl-1 -naphthalenesulfonamide (retention<br />
time, 31.0 h) and a suspected sulfonate conjugate<br />
(retention time, 43.3 h) is shown in Figures 14 and<br />
15, respectively.<br />
Discussion<br />
I<br />
‘I<br />
A<br />
‘I..<br />
Our interest in the computerized liquid chromatography/ultraviolet<br />
spectrometry system is twofold. First,<br />
the generation of a data base of ultraviolet spectral data<br />
(em)<br />
on urinary components (human and selected animal)<br />
that are associated with normal and pathological states,<br />
with subsequent computer retrieval and matching, is<br />
required for profiling of various inborn errors of metabolism.<br />
The acquisition of this data bank would aid<br />
immensely in the selection of ultraviolet spectral<br />
“windows” or binary descriptors for use in developing<br />
profiles of urinary components in specific human<br />
pathological states, by computer pattern-recognition<br />
techniques. The second purpose is the general use of the<br />
system for rapid ultraviolet data characterization of<br />
toxic chemical agents and their metabolites in urine. As<br />
shown by the current system, computer data manipulation<br />
can enhance sensitivity of detection of components<br />
and can help in the chromatographic resolution<br />
of compounds.<br />
Liquid chromatography has been hindered by the<br />
lack of a universal detector, and, consequently, no<br />
equivalent for the gas chromatograph/mass spectrometer<br />
system has yet been described. In the present work,<br />
we have begun to demonstrate the utility of a computerized<br />
liquid chromatography/ultraviolet spectrometry<br />
system for rapidly acquiring ultraviolet data and identifying<br />
various toxic chemical agents and their metabolites.<br />
Computer retrieval and display of selected ultraviolet<br />
spectra upon completion of a liquid-chromatographic<br />
run saves many hours of tedious collection of<br />
many hundreds of fractions and transfer to an ultraviolet<br />
spectrometer. Because one can re-run the entire<br />
liquid chromatogram at a wavelength specific for a<br />
chemical toxicant or its metabolites, they can be rapidly<br />
located in the chromatogram for further spectroscopic<br />
study.<br />
At this stage in the development, we have not “fine<br />
tuned” the system for maximum detectability. However,<br />
the spectrometer system has demonstrated increased<br />
sensitivity over single-band monitoring by virtue of its<br />
computerized signal-integration routine. Enhanced<br />
sensitivity will enable several improvements in liquid<br />
column chromatography. Although the capacities of<br />
conventional resins are several hundred fold greater<br />
than those of pellicular resins, the improved sensitivity<br />
will permit smaller sample loadings along with increased<br />
resolution and so will permit use of pellicular resins for<br />
identifying and screening for urinary metabolites.<br />
Future data manipulations for enhanced spectral<br />
presentation will include: (a) use of ratios at two or more<br />
selected wavelength for determination of chromatographic<br />
peak homogeneity, (b) spectral baseline or<br />
background subtraction technique by computer routine,<br />
(c) peak deconvolution for improved resolution, and (d)<br />
on-line quantitative analysis.<br />
The mini.computerized spectrometer unit was developed jointly<br />
by the Instrumentation and Computer Interfacing Group, Depart.<br />
ment of <strong>Chemistry</strong>, Virginia Polytechnic Institute and State Uni.<br />
versity, and the National Center for Toxicological Research under<br />
Contract No. 222.75-2047(c). Mouse urines containing (14CJ4-ethylsulfonyl-1-naphthalenesulfonamide<br />
and metabolites were kindly<br />
supplied by Dr. James Stanley, Molecular Biology Division, National<br />
Center for Toxicological Research.<br />
CLINICAL CHEMISTRY, Vol. 22, No. 9, 1976 1479
References<br />
1. Callmer, K., and Nilsson, 0., Modification of a Varian liquid<br />
chromatography u.v. detector for high sensitivity. Chromatographia<br />
6,517(1973).<br />
2. Morris, C. J. 0. R, Chromatographic detectors. Lab. Pract. 23,513<br />
(1974).<br />
3. Veening, H., Recent developments in instrumentation for liquid<br />
chromatography. J. Chem. Educ. 50, A481 (1973).<br />
4. Krejci, M., Experimental comparison of some detectors used in<br />
high performance liquid chromatography. Chem. Li8ty 57, 843<br />
(1973).<br />
5. Watson, E. S., Spectrophotometer for simultaneous absorption<br />
measurements of two substances at two wavelengths. Ger. Offen. 2,<br />
258, 208, 7 June (1973).<br />
6. Pellizzari, E. 0., and Sparacino, C. M., Scanning fluorescence<br />
spectrometry combined with u.v. detection of high pressure liquid<br />
chromatographic effluents. Anal. Chem. 45, 378 (1973).<br />
7. Baker, 0. R., Williams, R. C., and Steichen, J. C., A comparison<br />
of photometric detectors for high speed liquid chromatography. J.<br />
Chromatogr. Sci. 12, 499 (1974).<br />
8. Sonnenschein, A., Theory and practice for using continuously<br />
variable wavelength detectors vs. other monitoring systems. Anal.<br />
Instrum. 12, 123 (1974).<br />
9. Koszewski, J., Bylina, A., Sybilska, 0., and Gravowski, Z. R.,<br />
Chromatographic spectrophotometric apparatus. Brit. Patent<br />
1,339,475, 5 December 1973.<br />
10. Steichen, J. C., Dual-purpose absorbance-fluorescence detector<br />
for high pressure liquid chromatography. J. Chromatogr. 104, 39<br />
(1975).<br />
11. Dimov, N. P., Interrupted high speed liquid chromatography with<br />
simultaneous spectroscopic identification. DokI. BoIg. Akad. Nauk<br />
27, 1407 (1974).<br />
12. Denton, M. S., DeAngelis, T. P., Yacynych, A. M., et al., Oscillating<br />
mirror rapid scanning ultraviolet visible spectrometer as a<br />
detector for liquid chromatography. Anal. Chem. 48, 20 (1976).<br />
13. Sauer, B., New detector for high pressure liquid chromatography.<br />
GITFachz. Lab. 17, 1152 (1973).<br />
14. Bylina, A., Sybilska, D., Grabowski, Z. R., and Koszewski, J.,<br />
Rapid scanning spectrophotometry as a new detection system in<br />
chromatography. J. Chromatogr. 83, 357 (1973).<br />
15. Talmi, V., Applicability of TV-type multichannel detectors to<br />
spectroscopy. Anal. Chem. 47, 659A (1975).<br />
16. Talmi, Y., TV-type multichannel detectors. Anal. Chem. 47, 697A<br />
(1975).<br />
17. Milano, M. J., and Pardue, H. L., Evaluation of a vidicon scanning<br />
spectrometer for ultraviolet molecular absorption spectrometry. Anal.<br />
Chem. 47, 25 (1975).<br />
18. Pardue, H. L., McDowell, A. E., Fast, D. M., and Milano, M. J.,<br />
Applications of a vidicon spectrometer to analytical problems in<br />
clinical chemistry. Clin. Chem. 21, 1192 (1975).<br />
19. Marshall, A. G., and Comisarow, M. B., Fourier and Hadamard<br />
transform methods in spectroscopy. Anal. Chem. 47, 491A (1975).<br />
20. Plankey, F. W., Glenn, T. H., Hart, P. L., and Winefordner, J. D.,<br />
Hadamard spectrometer for uv-visible spectrometry. Anal. C/tern.<br />
46, 1000 (1974).<br />
21. Karger, B. L., Martin, M., and Guiochon, G., Role of column<br />
rameters and injection volume on detection limits in chromatography.<br />
pa-<br />
Anal. Chem. 46, 1640 (1974).<br />
22. Anders, M. W., and Latorre, J. P., High-speed ion exchange<br />
chromatography of barbiturates, diphenyihydantoin and their bydroxylated<br />
metabolites. Anal. Chem. 42, 1430 (1970).<br />
23. Anders, M. W., and Latorre, J. P., High-speed liquid chromatography<br />
of glucuronide and sulfate conjugates. J. Chromatogr. 55,<br />
409 (1971).<br />
24. Mrochek, J. E., Katz, S., Cristie, W. H., and Dinsmore, S. R.,<br />
Acetaminophen metabolism in man as determined by high-resolution<br />
liquid chromatography. Clin. Chem. 20, 1086 (1974).<br />
25. Khym, J. X., Analytical Ion Exchange Procedures in <strong>Chemistry</strong><br />
and Biology. Prentice-Hall, Inc., Englewood Cliffs, N. J., 1974.<br />
26. Brown, P. R., High Pressure Liquid Chromatography; Biochemical<br />
and Biomedical Applications. Academic Press, New York,<br />
N. Y., 1973.<br />
27. Scott, C. D., High pressure ion exchange chromatography as applied<br />
to the separation of complex biochemical mixtures. Sep. Purif.<br />
Methods 3, 263 (1974).<br />
28. Talmi, Y., Crosmum, R., and Larson, N. M., Characteristic noise<br />
spectra of some common analytical spectrometric sources. Anal.<br />
Chem. 48, 326 (1976).<br />
29. Olson, G. G., Applications of an optical multichannel analyzer.<br />
Am. Lab., p69 (February 1972).<br />
30. Flaks, A., Hamilton, J. M., and Clayson, D. B., Effect of ammonium<br />
chloride on incidence of bladder tumors induced by 4-ethylsulfonylnaphthalene-1.sulfonamide.<br />
J. Nat. Cancer Inst. 51, 2007<br />
(1973).<br />
31. Clayson, D. B., Bedford, A. J., and Turner, R., Acute response of<br />
the mouse bladder to derivatives of 4-Ethylsulfonylnaphthalene.<br />
1-sulfonamide and bladder carcinogens measured by the uptake of<br />
5.iodo-2’deoxyuridine (1251). Chem.-Biol. Interact. 6, 107 (1973).<br />
32. Levi, P. E., Knowles, J. C., Cowen, D. M., et al., Disorganization<br />
of mouse bladder epithelium induced by 2-acetylaminofluorene and<br />
4-ethylsulfonylnaphthalene-1-sulfonamide. J. Nat. Cancer Inst. 46,<br />
337 (1971).<br />
Appendix<br />
I<br />
Calculation of photon rate, reference beam rate,<br />
saturation rate, dynamic range, and sample beam detectability.<br />
light source: from spectral irradiance curve (Figure<br />
3), S1 = 0.28 tW/cm2#{149}nM, and total energy striking<br />
source mirror, Em is:<br />
Em = (1.4) 2(0.28) (1o6) (250) (40.3)<br />
and<br />
= 0.114W(250nm)<br />
E2 - E1 = hv = 8 X 10¹² ergs/photon<br />
where photons/W.s is given by:<br />
/ 1 \/ 1<br />
x 10) 10<br />
photon<br />
= 1.25 X 10¹⁸ (at 250 nm)<br />
W’s<br />
or, N = total photon flux at mirror (250 nm):<br />
N = (0.114)(1.25 x 10⁸)<br />
= 1.42 X 10¹⁷ photons (at 250 nm)<br />
5<br />
The photon loss to entrance of fiber optics is approximated<br />
by the area ratios of image to fiber end:<br />
0.9 X 1.5 = 0.38<br />
.9 X 4.0<br />
1480 CLINICAL CHEMISTRY, Vol. 22, No. 9, 1976
The total photons/s entering the fiber optics, assuming (by cooling to -30 #{176}C, the D.R. may improve<br />
no scattering loss upon entrance: of 20)<br />
by a factor<br />
N1 = 0.38 x 1.42 X 10’ sample beam: from previous calculation, 10 = 1.40 X<br />
1016 photon/s @ 250 nm, assume a guanosine concen-<br />
= 5.39 X 10⁶ photons/s tration at 109 g/25 sl mouse urine (BALB-C); for<br />
The fiber optics are split into 2 beams, or: guanosine,<br />
N2 = 2.70 X 10¹⁶ photons/s t250 = 11 050 L (mw = 283)<br />
mole ‘ cm<br />
Assume a 50% loss through the fiber optics: LC peak-width = 3 mm (est. for 10 gm); flow-rate =<br />
N3 = 1.35 X 10¹⁶ photon/s 0.1 ml/min; VR = 0.3 ml; assume a true gaussian peak<br />
shape, where w = 10 g solution of:<br />
These are the number of photons/s at 250 nm presented<br />
to each of the reference and sample beams. w $ V2 et V- V02)/2Q2 (see Appendix II)<br />
reference beam: assume 0.6 mol/liter acetic acid/ C( V) = V’r V1<br />
acetate buffer (pH 4.4) and at 250 nm, the measured<br />
absorbance is 0.015 (1 cm pathlength). The photons/ yields: w1 = 2.40 X 10b0 g or, the concentration in the<br />
second that exist from the flow cell is: light beam is: c1 = 2.68 X 10⁻⁸ mol/liter<br />
Then:<br />
- 1<br />
2.3<br />
ln (2) = A, where lo = N3 = 1.4 1016 Total A = (A)buffer + (A)guan (at 250 nm)<br />
solving for I or,<br />
1<br />
I = 1.3533 X 10¹⁶ photon/s - ln<br />
2.3 () =0.015+a-b.c<br />
assume 50% loss through exit fiber optics to grating,<br />
where:<br />
or<br />
I = 1.40 X 10¹⁶<br />
I = 6.72 X 10’s photon/s at 250 nm<br />
assume 50% energy transfer through grating and di- a = 1 cm, b = 11 050, c = 2.68 X 10⁻⁸ g<br />
vergence loss proportional to area ratios: substituting gives:<br />
I = (.0137)(6.72 X 10¹⁵) 37.1778 - lnI = .0352<br />
= 9.135 X 10’s photon/s I = 1.36 X 10¹⁶ photons/s<br />
saturation exposure (S.E.): given as 0,27 i W.s/cm2 correcting for loss through exit fiber-optics and grating<br />
(ref. 34) but, the area of the 250 nm pixel (channel) is: divergence loss (.0068): I = 9.192 X 10’s ph/s; the difar<br />
2.11 X 10 cm2 or, ferential signal developed between the reference and<br />
(S.E. )CH = 5.67 X 10 i W-s sample detectors will be the net photons per second<br />
times the photodiode sensitivity:<br />
= 5.67 X 10 X 1.25 X 10’s X 106<br />
dldet = (9.192-9.135) i0’ photons/s<br />
= 7.09 X 10 photons (at 250 nm)<br />
= 5.7 x lO photons/s<br />
noise per channel (N.E.): given as 6.9 X 10⁻⁶ W.<br />
s/cm2 at 30 #{176}C then,6<br />
or,<br />
Sdet =<br />
(N.E.)CH = 6.9 X 10-6 X 2.1 x 10<br />
(5.7 x 10)(8 x 10_12)(10_7)(106)(12 X 10)<br />
= 1.45 X 10 X 1.25 x 1018 x 10-6<br />
2.2 X 10<br />
= 1.8 X 10 photons Sdet = 5.2 X 10 A<br />
dynamic range: defined as maximum signal at saturation<br />
to the noise signal both measured at a fixed<br />
pixel, Appendix II<br />
DR =<br />
(SE)CH<br />
(NE)cjj<br />
Solution of gaussian curve for concentration of guanosine<br />
in 0.030 ml detector cell. See Figure 16 for details<br />
and peak measurements.<br />
- 7.09 X 10<br />
1.8 x 10 where, V0 = retention volume of guanosine<br />
4 X 10 at 30 #{176}C Vb - V0 = .030 ml<br />
V2- V1 = 0.3 ml<br />
6 Robert R. Buss, personal communication, Reticon Corp., 910<br />
Benicia Ave., Sunnyvale, Calif. 94086. w = 10 g guanosine<br />
CLINICAL CHEMISTRY, Vol. 22. No. 9, 1976 1481
V2-V1 6<br />
vi<br />
V2<br />
Fig. 16. Gaussianpeak shape for guanosine<br />
The curve is of the general form:<br />
- w r (V-V0)2<br />
exp- 2r2<br />
let, Va = V0 - V for the area: AT = .IVQVb C(V)dv<br />
Vb =<br />
V0 + V<br />
because the area in the cross-hatched region is symmetrical<br />
about V0, we simplify: A1 = 2 fva Vb C(V)dv<br />
The function, F(x) is a cumulative probability function<br />
of a uniform normal distribution and has been extensively<br />
tabulated, or<br />
F(x)==J<br />
e----dt<br />
by making the transformation, x = (V - V0)/c, then dx<br />
= dv/o<br />
j.V = WF(x’)<br />
thenA 25v0VbC(V)dv=2[f’bC(V)dv_f..,o<br />
C( V)dv]<br />
=2 {WF(Xb) - WF(O))<br />
= 2W{F(Xb) - 0.51<br />
for the LC curve, o- can be approximated as follows:<br />
then xb = 6V/(V2 - V1)<br />
where V = 0.015, w and V2 - V1 given previously<br />
Thus A = 2 X i0 IF(6 X .015)/.3 - .5<br />
Appendix<br />
Ill<br />
= 2 X i0 {F(.3) -<br />
= 2 X ‘i0 (.6179 - .5)<br />
= 2.36 X 10¹⁰g<br />
Comparison of a single pixel in the linear photodiode<br />
array (512 pixels) to the photomultiplier (ref. 28, 29)<br />
For the Reticon:<br />
/S\<br />
NicH<br />
NpQvTe<br />
NN1<br />
where N = input photons/s (= 10)<br />
Q0= quantum efficiency at specified nm (.32 at<br />
250nm)<br />
Te = integration or dwell time per channel (1<br />
s)<br />
= noise (#{235}/frame) ( 770)<br />
N1 = number of frames ( 1)<br />
S (10)(.32)(1) 3<br />
()CH (770)(1) -4.1:1<br />
For photomultiplier, single wavelength sensing for<br />
grating (250 nm, 1 nm bandwidth):<br />
/S\<br />
N1CH<br />
= NPQPGK<br />
NPM<br />
where N = input photons/s ( 10)<br />
Q,.,= quantum efficiency (.1 at 250 nm)<br />
G = gain ( 106)<br />
K = coulombs/esu ( 1.6 X 10’9)<br />
NPM = photomultiplier dark current noise (6 X<br />
1012 A)<br />
1S\ - (104)(.1)(106)(1.6 x 10_19) - - 261<br />
1\NIPM - 6 x 10¹² - 6 -<br />
1482 CLINICAL CHEMISTRY, Vol. 22, No. 9, 1976