Dichlorvos (DDVP) Risk Characterization Document - California ...
Dichlorvos (DDVP) Risk Characterization Document - California ...
Dichlorvos (DDVP) Risk Characterization Document - California ...

You also want an ePaper? Increase the reach of your titles
YUMPU automatically turns print PDFs into web optimized ePapers that Google loves.
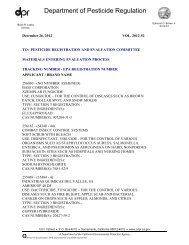
Table 11. The dosages and the inhibition of cholinesterase activity in rats treated with <strong>DDVP</strong> a .<br />
Dosages<br />
mg/kg-day<br />
premating premating<br />
F 0 and F 1 F 0 and F 1 gestation lactation<br />
ppm males females females females<br />
5.0 0.48-0.5 0.65-0.66 0.56-0.59 0.93-1.1<br />
20.0 1.92-1.95 2.43-2.67 2.12-2.42 4.3-4.6<br />
80.0 6.90-7.53 9.37-9.47 7.04-8.15 13.2-17.5<br />
Cholinesterase inhibition<br />
F 0 generation<br />
ChE activity as % of Control b<br />
ppm mg/kg-day c Brain ChE Plasma ChE Erythrocyte ChE<br />
M F M F M F M F<br />
5 0.5 1.1 99 94 96 88 93 77*<br />
20 1.9 4.6 85* 74* 71* 45* 71* 61*<br />
80 7.5 17.5 47* 41* 59* 17* 43* 40*<br />
F 1 generation<br />
ChE activity as % of Control b<br />
ppm mg/kg-day c Brain ChE Plasma ChE Erythrocyte ChE<br />
M F M F M F M F<br />
5 0.5 1.1 101 98 85* 91 86* 83*<br />
20 1.9 4.6 94* 68* 74* 46* 68* 58*<br />
80 7.5 17.5 60* 40* 42* 19* 45* 42*<br />
a/<br />
b/<br />
c/<br />
Data were from Tyl et al. (1992).<br />
Values are expressed as the mean % of control values. The values for female and males are<br />
presented as M or F, respectively. Statistical significance (*, p @ 0.05) was determined by the<br />
analysis of variance by ANOVA or Dunnett's test as reported.<br />
The dosages were based on the highest value of the range during premating for males, and<br />
during lactation for females.<br />
46