Dichlorvos (DDVP) Risk Characterization Document - California ...
Dichlorvos (DDVP) Risk Characterization Document - California ...
Dichlorvos (DDVP) Risk Characterization Document - California ...

You also want an ePaper? Increase the reach of your titles
YUMPU automatically turns print PDFs into web optimized ePapers that Google loves.
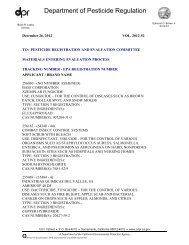
Table 9.<br />
The no-observed-effect levels (NOELs) and lowest-observed-effect levels (LOELs) of <strong>DDVP</strong> from chronic studies.<br />
Plasma ChE a RBC ChE a Brain ChE a Other Effects<br />
Species Route a Duration a NOEL LOEL % C NOEL LOEL % C NOEL LOEL % C NOEL LOEL Effects Ref. b<br />
(mg/kg-day) (mg/kg-day) (mg/kg-day) (mg/kg-day)<br />
Rat diet 7d/wx80w - - - - - - - 7.5 15 reduced body weight 1<br />
Rat diet 7d/wx2y 0.13 1.2 79-95% 0.13 1.2 78-92% >8.0 - 1.2 8.0 hepatocyte degeneration 2<br />
at 2y<br />
at 2y<br />
Rat gavage 5d/wx2y - - - - - - oncogenic risk c mononuclear leukemia 3*<br />
and other tumors<br />
Rat water 7d/wx2y - - - - - - 14 28 reduced body weight 4<br />
in males<br />
Mouse gavage 5d/wx2y - - - - - - oncogenic risk forestomach tumors 3*<br />
Mouse diet 7d/wx80w - - - - - - 45 90 reduced body weight 5<br />
Dog capsule 7d/wx1y 0.05 1.0 46% 0.05 1.0 54% 0.05 1.0 78% 1.0 3.0 emesis, salivation, ataxia 6*<br />
at 52w at 52w at 52w<br />
Dog diet 7d/wx2y 0.01 0.09 64-86% 0.01 0.09 49-60% >8.9 - no effects 0.09 0.9 hepatocyte degeneration 7<br />
at 1-12w at 4-24w<br />
Rat inhal 23h/d 0.05 0.5 76-84% 0.05 0.5 69-72% 0.05 0.5 90% 0.5 4.6 reduced body weight 8<br />
x7d/wx2y at 104w at 104w at 104w<br />
a/<br />
b/<br />
c/<br />
Abbreviations: ChE= cholinesterase, RBC= erythrocyte, inhal= inhalation, h= hours, d= days, w= weeks, y= years, % C= % of control values at the LOEL,<br />
-= data not available.<br />
* after the reference number indicates the study was acceptable to DPR according to FIFRA guidelines. References: 1. NCI, 1977a; 2. Witherup et al.,<br />
1967; 3. Chan, 1989; 4. Enomoto, 1978; 5. NCI, 1977b; 6. Markiewicz, 1990; 7. Jolley et al., 1967; 8. Blair et al., 1974.<br />
Oncogenic effects are assumed to have no threshold levels, and they are evaluated by the calculation of potency factors.<br />
40