The Economic Benefits of Reducing Violent Crime - Center for ...
The Economic Benefits of Reducing Violent Crime - Center for ...
The Economic Benefits of Reducing Violent Crime - Center for ...

You also want an ePaper? Increase the reach of your titles
YUMPU automatically turns print PDFs into web optimized ePapers that Google loves.
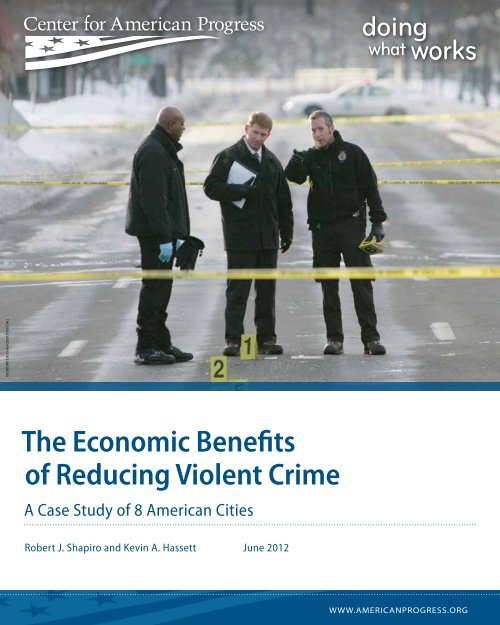
THE ASSOCIATED PRESS/Ed Andrieski<br />
<strong>The</strong> <strong>Economic</strong> <strong>Benefits</strong><br />
<strong>of</strong> <strong>Reducing</strong> <strong>Violent</strong> <strong>Crime</strong><br />
A Case Study <strong>of</strong> 8 American Cities<br />
Robert J. Shapiro and Kevin A. Hassett June 2012<br />
www.americanprogress.org
<strong>The</strong> <strong>Economic</strong> <strong>Benefits</strong> <strong>of</strong><br />
<strong>Reducing</strong> <strong>Violent</strong> <strong>Crime</strong><br />
A Case Study <strong>of</strong> 8 American Cities<br />
Robert J. Shapiro and Kevin A. Hassett June 2012
Fast facts on the economic benefits <strong>of</strong> reducing violent crime<br />
<strong>Reducing</strong> current rates <strong>of</strong> murder, rape, assault, and robbery would<br />
produce a wide range <strong>of</strong> savings and other benefits <strong>for</strong> Americans as<br />
individuals, property owners, and taxpayers. In 2010 these four main<br />
types <strong>of</strong> violent crime cost Americans more than $42 billion in direct<br />
costs, including the associated costs <strong>of</strong> police, courts and correctional<br />
institutions, out-<strong>of</strong>-pocket-medical expenses borne by victims, and<br />
lost earnings by both victims and perpetrators who are arrested and<br />
convicted. <strong>The</strong>se costs totaled $137 per American in 2010, the last<br />
year <strong>for</strong> which complete data are available.<br />
<strong>Violent</strong> crimes also inflict other, more intangible costs, including the<br />
pain and suffering <strong>of</strong> victims, a reduced quality <strong>of</strong> life <strong>for</strong> everyone,<br />
and lower investment levels and property values. While these intangible<br />
costs are difficult to measure with precision, analysts agree that<br />
they greatly exceed the direct costs. Here are the fast facts enumerating<br />
the economic benefits <strong>of</strong> reducing violent crime:<br />
• Across five cities with the necessary data <strong>for</strong> our analysis, we found<br />
that a 10 percent reduction in homicides should lead to a 0.83<br />
percent increase in housing values the following year, and a 25 percent<br />
reduction in homicides should produce a 2.1 percent increase<br />
in housing prices over the next year. Applying these results to all<br />
residential housing in the metropolitan areas <strong>of</strong> our sample <strong>of</strong> eight<br />
American cities, we find that:<br />
• A 10 percent reduction in homicides should increase the value <strong>of</strong><br />
residential real estate by $4.4 billion in the Boston metropolitan<br />
area, $3.2 billion in Philadelphia, $2.9 billion in Seattle, $2.4 billion<br />
in Dallas, $2.2 billion in the Chicago area, $800 million in Milwaukee,<br />
and $600 million in Jacksonville. At current property tax<br />
rates, the increase in housing values associated with a 10 percent<br />
reduction in homicides would substantially expand revenues from<br />
property taxes in all eight cities.<br />
$6 billion in Dallas, $5.5 billion in the Chicago area, $2 billion in<br />
Milwaukee, and $1.5 billion in Jacksonville. At their current property<br />
tax rates, these increases in housing values would substantially<br />
expand the revenues from property taxes in all eight cities.<br />
• <strong>The</strong> other, direct annual costs <strong>of</strong> violent crime in the eight cities total<br />
$3.7 billion per year, ranging from $89 million per year in Seattle<br />
and $198 million in Boston to $752 million per year in Houston,<br />
$736 million in Philadelphia, and $1.1 billion in Chicago. <strong>The</strong>se<br />
direct costs average $320 per person per year across the eight cities,<br />
ranging from $144 in Seattle and $246 in Jacksonville to about<br />
$390 in Milwaukee and Chicago, and $472 in Philadelphia.<br />
• <strong>The</strong> value <strong>of</strong> the more intangible pain and suffering borne by<br />
the victims <strong>of</strong> these violent crimes totals some $13.9 billion per<br />
year across the eight cities, ranging from $216 million per year in<br />
Seattle and $734 million in Boston, to nearly $3 billion per year in<br />
Philadelphia and $4.2 billion in Chicago. <strong>The</strong>se annual, intangible<br />
costs average more than $1,200 per person across the eight cities,<br />
ranging from $350 per person per year in Seattle and nearly $980<br />
in Jacksonville, to $1,486 per person per year in both Chicago and<br />
Milwaukee, and more than $1,900 in Philadelphia.<br />
Successful ef<strong>for</strong>ts to reduce violent crime can generate significant<br />
savings <strong>for</strong> municipal budgets and large benefits <strong>for</strong> residents, apart<br />
from increases in their housing values. On the next page we list the<br />
economic savings the eight cities in our study would reap by reducing<br />
violent crime by 10 percent and by 25 percent.<br />
• A 25 percent reduction in homicides should be followed by increases<br />
in metropolitan area housing values totaling $11 billion in<br />
the Boston area, $8 billion in Philadelphia, $7.25 billion in Seattle,<br />
iv<br />
<strong>Center</strong> <strong>for</strong> American Progress | <strong>The</strong> <strong>Economic</strong> <strong>Benefits</strong> <strong>of</strong> <strong>Reducing</strong> <strong>Violent</strong> <strong>Crime</strong>
Boston<br />
• A 10 percent reduction could save $5 million per year, reduce<br />
direct costs to victims by more than $7 million per year, and avert<br />
more than $73 million in annual intangible costs to victims—reducing<br />
the total government costs by an average <strong>of</strong> $145 per<br />
resident per year.<br />
• A 25 percent reduction could save more than $12 million per year,<br />
reduce the direct costs borne by victims by some $18 million per<br />
year, and avert more than $180 million in annual intangible costs—<br />
reducing total government costs by the equivalent <strong>of</strong> more than<br />
$360 per resident per year.<br />
• This 25 percent savings could enable a mix <strong>of</strong> boosting city spending<br />
on housing and community development by up to 14.4 percent or<br />
reducing property taxes by up to 0.8 percent.<br />
Dallas<br />
• A 10 percent reduction could save $7 million per year, reduce the<br />
direct costs to victims by nearly $15 million per year, and avert<br />
more than $140 million in annual, intangible costs to victims—reducing<br />
total government costs by an average <strong>of</strong> $138 per resident<br />
per year.<br />
• A 25 percent reduction could save $19 million per year, reduce<br />
the direct costs to victims by more than $36 million per year, and<br />
avert more than $360 million in annual intangible costs—reducing<br />
total government costs by the equivalent <strong>of</strong> more than $450 per<br />
resident per year.<br />
• This 25 percent savings could enable a mix <strong>of</strong> reducing property<br />
taxes by up to 4.3 percent or increasing the parks and recreation<br />
budget by up to 29 percent.<br />
Chicago<br />
• A 10 percent reduction could save $24 million per year, reduce<br />
the direct costs to victims by nearly $43 million per year, and<br />
avert more than $420 million in annual, intangible costs to<br />
victims—reducing total government costs by an average <strong>of</strong> $187<br />
per resident per year.<br />
• A 25 percent reduction could save $59 million per year, reduce<br />
the direct costs to victims by more than $107 million per year, and<br />
avert more than $1 billion in annual intangible costs—reducing total<br />
government costs by the equivalent <strong>of</strong> nearly $470 per resident<br />
per year.<br />
• This 25 percent savings could enable a mix <strong>of</strong> reducing all local<br />
taxes by up to 2.5 percent or increasing city spending on community<br />
services by up to 66 percent.<br />
Houston<br />
• A 10 percent reduction could save $17 million per year, reduce<br />
the direct costs to victims by nearly $27 million per year, and avert<br />
more than $265 million in annual, intangible costs to victims—reducing<br />
total government costs by an average <strong>of</strong> nearly $150 per<br />
resident per year.<br />
• A 25 percent reduction could save more than $43 million per year,<br />
reduce direct costs to victims by $67 million per year, and avert<br />
more than $660 million in annual intangible costs—reducing<br />
total government costs by the equivalent <strong>of</strong> more than $370 per<br />
resident per year.<br />
• This 25 percent savings could fund a mix <strong>of</strong> doubling city spending<br />
on health and human services or cutting property taxes by up<br />
to 5 percent.<br />
Continued on next page<br />
Fast facts on the economic benefits <strong>of</strong> reducing violent crime | www.americanprogress.org<br />
v
Jacksonville<br />
• A 10 percent reduction could save $4 million per year, reduce the<br />
direct costs to victims by nearly $8 million per year, and avert more<br />
than $80 million in annual, intangible costs to victims—reducing<br />
total government costs by an average <strong>of</strong> $122 per resident per year.<br />
• A 25 percent reduction could save nearly $12 million per year, reduce<br />
the direct costs to victims by nearly $20 million per year, and<br />
avert more than $200 million in annual intangible costs—reducing<br />
total government costs by the equivalent <strong>of</strong> more than $305 per<br />
resident per year.<br />
• This 25 percent savings could enable a mix <strong>of</strong> cutting its property<br />
taxes by up to 2 percent or increasing local spending on economic<br />
development by up to 26 percent.<br />
Milwaukee<br />
• A 10 percent reduction could save nearly $5 million per year,<br />
reduce the direct costs to victims by more than $9 million per year,<br />
and avert some $90 million in annual, intangible costs to victims—<br />
reducing total government costs by an average <strong>of</strong> nearly $190 per<br />
resident per year.<br />
• A 25 percent reduction could save more than $12 million per year,<br />
reduce the direct costs to victims by some $23 million per year,<br />
and avert $225 million in annual intangible costs—reducing total<br />
government costs in Milwaukee by the equivalent <strong>of</strong> nearly $470<br />
per resident per year.<br />
• This 25 percent savings could enable a mix <strong>of</strong> cutting property<br />
taxes by up to 4 percent or increasing spending on housing and<br />
community development by up to 71 percent.<br />
Philadelphia<br />
• A 10 percent reduction could save more than $17 million per<br />
year, reduce the direct costs to victims by nearly $30 million per<br />
year, and avert nearly $300 million in annual, intangible costs to<br />
victims—reducing total government costs by an average <strong>of</strong> nearly<br />
$240 per resident per year.<br />
• A 25 percent reduction could save more than $43 million per year,<br />
reduce the direct costs to victims by nearly $75 million per year,<br />
and avert some $742 million in annual intangible costs—reducing<br />
total government costs by the equivalent <strong>of</strong> more than $595 per<br />
resident per year.<br />
• This 25 percent savings could enable a mix <strong>of</strong> cutting local property<br />
taxes by up to 11 percent or doubling spending on homeless and<br />
housing assistance.<br />
Seattle<br />
• A 10 percent reduction could save more than $2 million per year,<br />
reduce the direct costs to victims by more than $2 million per year,<br />
and avert nearly $22 million in annual, intangible costs to victims—<br />
reducing total government costs by an average <strong>of</strong> nearly $50 per<br />
resident per year.<br />
• A 25 percent reduction would save the city budget $6 million per<br />
year, reduce the direct costs to victims by more than $5 million<br />
per year, and avert some $54 million in annual intangible costs—<br />
reducing total costs in Seattle by the equivalent <strong>of</strong> $123 per<br />
resident per year.<br />
• This 25 percent savings could enable a mix <strong>of</strong> cutting property taxes<br />
by up to 2.4 percent and increasing city spending on neighborhoods<br />
and development by up to 5.4 percent.<br />
vi<br />
<strong>Center</strong> <strong>for</strong> American Progress | <strong>The</strong> <strong>Economic</strong> <strong>Benefits</strong> <strong>of</strong> <strong>Reducing</strong> <strong>Violent</strong> <strong>Crime</strong>
Contents<br />
1 Introduction and summary<br />
7 <strong>The</strong> consequences <strong>of</strong> falling crime rates on real estate values,<br />
city budgets, and local residents<br />
13 <strong>The</strong> impact <strong>of</strong> lower rates <strong>of</strong> violent crime on real estate values<br />
19 Estimating other direct savings and intangible benefits<br />
<strong>of</strong> reducing violent crime<br />
31 <strong>The</strong> costs <strong>of</strong> violent crimes <strong>for</strong> eight U.S. cities and the<br />
benefits and savings from reducing those crimes<br />
39 Alternative uses <strong>of</strong> the municipal savings from reducing<br />
violent crime<br />
48 References<br />
51 Appendix A<br />
55 Appendix B<br />
62 About the authors<br />
63 Acknowledgements<br />
64 Endnotes
Introduction and summary<br />
<strong>Violent</strong> crimes are costly. Murders, rapes, assaults, and robberies impose concrete<br />
economic costs on the victims who survive as well as the families <strong>of</strong> those who lose<br />
their lives, in the loss <strong>of</strong> earnings and their physical and emotional tolls. <strong>Violent</strong><br />
crimes also impose large costs on communities through lower property values,<br />
higher insurance premiums, and reduced investment in high-crime areas. In addition,<br />
violent crimes impose significant costs on taxpayers, who bear the financial<br />
burden <strong>of</strong> maintaining the<br />
police personnel and operations,<br />
courts, jails, and prisons<br />
directed toward these crimes<br />
and their perpetrators.<br />
FIGURE 1<br />
<strong>The</strong> good news: Falling crime rates<br />
TABLE 1<br />
<strong>Violent</strong> crime in the United States, <strong>of</strong>fenses per 100,000 population, 1960-2010<br />
Most violent crimes involve weapons<br />
Use <strong>of</strong> weapons and guns in violent crimes, 2010<br />
Fortunately, the incidence <strong>of</strong><br />
violent crimes in the United<br />
States has fallen sharply over<br />
the last 20 years. From 1960 to<br />
1990 the rates <strong>of</strong> these crimes<br />
rose sharply as did their attendent<br />
costs. Over that period<br />
murder rates nearly doubled,<br />
rates <strong>of</strong> rape and robbery<br />
increased fourfold, and the rate<br />
<strong>of</strong> assualt quintupled. Since the<br />
early 1990s, however, rates <strong>of</strong><br />
most violent crimes have been<br />
cut nearly in half. (see Figure 1)<br />
<strong>Violent</strong> crime<br />
Percent committed<br />
with weapons<br />
Percent committed<br />
with handguns<br />
Homicide 94% 67%<br />
Robbery 58% 41%<br />
Aggravated assault 73% 20%<br />
Source: Federal Bureau <strong>of</strong> Investigation, Uni<strong>for</strong>m <strong>Crime</strong> Report, <strong>Crime</strong> in the<br />
United States, 2010 (Department <strong>of</strong> Justice, 2011).<br />
Source: FBI, Uni<strong>for</strong>m <strong>Crime</strong> Reports as prepared by the National Archive <strong>of</strong> Criminal Justice Data, http://www.ucrdatatool.gov/<br />
Search/<strong>Crime</strong>/State/State<strong>Crime</strong>.cfm<br />
Yet rates <strong>of</strong> most violent crimes in the United States remain high compared to the<br />
1950s and 1960s and to other advanced societies today. <strong>The</strong> U.S. murder rate, <strong>for</strong><br />
example, has fallen to a 50-year low, but that rate is still nearly three times the level<br />
in Canada and more than four times the level in the United Kingdom. 1 Among all<br />
Introduction and summary | www.americanprogress.org 1
<strong>of</strong> the world’s developed countries, the United States today, on a per capita basis,<br />
ranks second in murders, fourth in rapes, and sixth in robberies.<br />
<strong>The</strong> Bureau <strong>of</strong> Justice Statistics reports that the majority <strong>of</strong> all violent crimes<br />
involve the use <strong>of</strong> weapons, and in two-thirds <strong>of</strong> all homicides and 41 percent <strong>of</strong><br />
all robberies, the weapon is a handgun. (see Table 1)<br />
TABLE 1<br />
Most violent crimes involve weapons<br />
Use <strong>of</strong> weapons and guns in violent crimes, 2010<br />
<strong>Violent</strong> crime<br />
Percent committed<br />
with weapons<br />
Percent committed<br />
with handguns<br />
Homicide 94% 67%<br />
Robbery 58% 41%<br />
Aggravated assault 73% 20%<br />
Source: Federal Bureau <strong>of</strong> Investigation, Uni<strong>for</strong>m <strong>Crime</strong> Report, <strong>Crime</strong> in the United States, 2010 (Department <strong>of</strong><br />
Justice, 2011).<br />
Moreover, from 2005 to 2010 the nationwide incidence <strong>of</strong> homicides declined<br />
by 12.5 percent, the number <strong>of</strong> robberies decreased by nearly 9 percent, and the<br />
number <strong>of</strong> aggravated assaults declined by 7 percent. <strong>The</strong> share <strong>of</strong> crimes committed<br />
with guns in all three categories, however, remained constant.<br />
By most measures, violent crime continues to impose significant costs on<br />
Americans and their communities. <strong>The</strong> costs borne by the American public <strong>for</strong><br />
this level <strong>of</strong> criminal activity are significant. Medical care <strong>for</strong> assault victims, <strong>for</strong><br />
example, costs an estimated $4.3 billion per year. 2 We spend $74 billion per year<br />
on incarcerating 2.3 million criminals, including some 930,000 violent criminals. 3<br />
Moreover, the costs <strong>of</strong> the pain and suffering borne by the victims <strong>of</strong> violent<br />
crimes is several times greater than the more direct costs <strong>of</strong> those crimes. As a<br />
result, successful ef<strong>for</strong>ts to reduce violent crime can produce substantial economic<br />
benefits <strong>for</strong> individuals, communities, and taxpayers.<br />
This report presents the findings and conclusions <strong>of</strong> a yearlong project to examine<br />
and analyze the costs <strong>of</strong> violent crimes in a sample <strong>of</strong> eight major American cities<br />
and estimate the savings and other benefits that would accompany significant<br />
2 <strong>Center</strong> <strong>for</strong> American Progress | <strong>The</strong> <strong>Economic</strong> <strong>Benefits</strong> <strong>of</strong> <strong>Reducing</strong> <strong>Violent</strong> <strong>Crime</strong>
eductions in those crimes. This analysis draws on data pinpointing the incidence<br />
and location <strong>of</strong> murders, rapes, assaults, and robberies. <strong>The</strong> data were provided<br />
by the police departments <strong>of</strong> Boston, Chicago, Dallas, Houston, Jacksonville,<br />
Milwaukee, Philadelphia, and Seattle.<br />
We examined a broad range <strong>of</strong> both direct and intangible costs associated with<br />
those violent crimes based on their incidence in each <strong>of</strong> the eight cities in 2010.<br />
<strong>The</strong> direct costs reported here are those borne by the residents and city governments<br />
<strong>of</strong> the eight cities, although additional costs are also borne by state and<br />
federal governments and the taxpayers who finance them. Finally, we calculated<br />
the benefits to those residents associated with substantial reductions in violent<br />
crime, including the impact on residential home values and a variety <strong>of</strong> savings to<br />
the city governments.<br />
In today’s tight fiscal and economic environment, the mayors and city councils <strong>of</strong><br />
every city—along with state and the federal governments—are searching <strong>for</strong> ways<br />
to reduce their spending and expand their revenues. <strong>The</strong> common challenge is to<br />
achieve sustainable fiscal conditions without hobbling government’s ability to provide<br />
the vital goods and services that most Americans expect, all without burdening<br />
businesses and families with onerous new taxes. This analysis provides another<br />
way available to many American municipalities: Secure budget savings, higher<br />
revenues, and personal income and wealth gains by reducing violent crime rates.<br />
To calculate the extent <strong>of</strong> those savings and benefits, we analyze a broad range<br />
<strong>of</strong> direct costs associated with the violent crime in the eight cities sampled here.<br />
<strong>The</strong>se direct costs start with local spending on policing, prosecuting, and incarcerating<br />
the perpetrators <strong>of</strong> those crimes. <strong>The</strong>se costs also encompass out-<strong>of</strong>pocket<br />
medical expenses borne by surviving victims <strong>of</strong> violent crime as well as<br />
the income those victims must <strong>for</strong>go as a result <strong>of</strong> the crimes. <strong>The</strong>se costs also<br />
include the lost incomes that would otherwise be earned by the perpetrators <strong>of</strong><br />
violent crimes had they not been apprehended—as distasteful as it is to calculate<br />
the <strong>for</strong>egone income <strong>of</strong> rapists or armed robbers who are arrested, convicted, and<br />
incarcerated. <strong>The</strong>se direct, annual costs range from $90 million per year in Seattle<br />
to around $200 million per year in Boston, Jacksonville, and Milwaukee, to more<br />
than $700 million in Philadelphia and nearly $1.1 billion <strong>for</strong> Chicago.<br />
This report also examines certain intangible costs associated with violent crime,<br />
including the pain and suffering <strong>of</strong> the surviving victims <strong>of</strong> violent crime and the<br />
costs to the families <strong>of</strong> murder victims. Across the eight cities examined here, the<br />
Introduction and summary | www.americanprogress.org 3
total annual costs <strong>of</strong> violent crimes, including these intangible costs as well as the<br />
more direct ones, range from more than $300 million per year in Seattle to more<br />
than $900 million in Boston, to some $3.7 billion per year in Philadelphia and<br />
$5.3 billion <strong>for</strong> Chicago.<br />
Based on this analysis we also estimate the budgetary savings that each <strong>of</strong> the eight<br />
cities should expect to achieve if their rates <strong>of</strong> violent crime declined by either 10<br />
percent or 25 percent. <strong>The</strong>se savings include lower expenditures on law en<strong>for</strong>cement<br />
and the justice system, as well as the additional revenues that each city could<br />
expect to collect from applying local taxes to the income earned by those who otherwise<br />
would have been victims or perpetrators <strong>of</strong> those crimes.<br />
All told, the estimated savings <strong>for</strong> municipal budgets from a 25 percent reduction<br />
in violent crime range from $6 million per year in Seattle to $12 million per year<br />
in Boston and Milwaukee, to $42 million per year in Philadelphia and $59 million<br />
<strong>for</strong> Chicago. We also estimate the value <strong>of</strong> other benefits associated with reduced<br />
rates <strong>of</strong> violent crime, including lower out-<strong>of</strong>-pocket medical costs <strong>for</strong> those who<br />
otherwise would have been victims as well as their averted pain and suffering.<br />
<strong>The</strong> largest economic benefits, however, arise from the impact <strong>of</strong> lower rates <strong>of</strong><br />
violent crime on the housing values in the cities sampled here. To estimate this<br />
effect, we use data covering several years on the incidence <strong>of</strong> violent crimes by zip<br />
code in each city and changes in housing values in the same zip codes over the<br />
same period. Five <strong>of</strong> the eight cities were able to provide data by zip code covering<br />
at least six years. Our analysis <strong>of</strong> those data found that a reduced incidence <strong>of</strong> murders<br />
in a particular zip code is followed by a predictable and significant increase in<br />
housing values in the same zip code in the next year.<br />
On average, a reduction in a given year <strong>of</strong> one homicide in a zip code causes a 1.5<br />
percent increase in housing values in that same zip code the following year. We<br />
applied these findings to available data on the value <strong>of</strong> the housing stock in the<br />
metropolitan areas <strong>of</strong> all eight cities. <strong>The</strong> estimated increases in the value <strong>of</strong> the<br />
housing stock <strong>for</strong> the eight cities and their immediate metropolitan areas, following<br />
a 10 percent reduction in homicides, range from $600 million in Jacksonville<br />
and the surrounding area to $800 million in the Milwaukee area, to $3.2 billion<br />
in Philadelphia and the surrounding suburbs, and $4.4 billion in the Boston area.<br />
Un<strong>for</strong>tunately, inconsistent reporting <strong>of</strong> other types <strong>of</strong> violent crime—rapes,<br />
assaults, and robberies—preclude a reliable analysis <strong>of</strong> the impact on housing<br />
values <strong>of</strong> changes in the incidence <strong>of</strong> those crimes.<br />
4 <strong>Center</strong> <strong>for</strong> American Progress | <strong>The</strong> <strong>Economic</strong> <strong>Benefits</strong> <strong>of</strong> <strong>Reducing</strong> <strong>Violent</strong> <strong>Crime</strong>
Methods to reduce violent crime<br />
A full analysis <strong>of</strong> the ways communities reduce crime is beyond the<br />
scope <strong>of</strong> this report, but it is important to note that many strategies<br />
<strong>for</strong> reducing violent crime entail budgetary costs as well. We do not<br />
attempt to calculate those costs. Nevertheless, readers should be<br />
aware that scholars have conducted extensive research to identify<br />
which crime control and prevention strategies contributed most to<br />
the reductions in violent crimes in recent decades.<br />
Problem-oriented policing is an evidence-based intervention <strong>for</strong><br />
reducing violence. 4 An evaluation <strong>of</strong> the “pulling levers” strategy—<br />
policing that “focuses criminal justice and social service attention on<br />
a small number <strong>of</strong> chronically <strong>of</strong>fending gang members”—found a<br />
43 percent decline in assaultive gun violence events and a 66 percent<br />
reduction in gang-related homicides after the intervention. 5<br />
An economic analysis <strong>of</strong> underground gun markets in Chicago suggests<br />
that intervening in networks <strong>of</strong> black-market gun brokers may also <strong>of</strong>fer<br />
promise in reducing illegal access to guns. 6 Police stings <strong>of</strong> gun dealers<br />
engaged in illegal gun sales were associated with a subsequent reduction<br />
in the supply <strong>of</strong> new guns to criminals in some but not all cities. 7<br />
Many empirical studies, <strong>for</strong> example, have examined which strategies<br />
have been most cost effective. 8 A 1997 meta-analysis commissioned<br />
by the U.S. Department <strong>of</strong> Justice identified a range <strong>of</strong> practices<br />
that have proved successful with various kinds <strong>of</strong> <strong>of</strong>fenders. Family<br />
therapy and parent-training ef<strong>for</strong>ts have been quite effective <strong>for</strong> atrisk<br />
pre-adolescents while vocational training has worked well <strong>for</strong> certain<br />
groups <strong>of</strong> older, male ex-<strong>of</strong>fenders. Additional police patrols also<br />
reduced the incidence <strong>of</strong> serious <strong>of</strong>fenses in high-crime hotspots. 9<br />
Similarly, a 1998 RAND Corporation study analyzed the cost effectiveness<br />
<strong>of</strong> several approaches in Cali<strong>for</strong>nia. It found that $1 million<br />
expended on graduation incentives reduced the number <strong>of</strong> yearly<br />
serious crimes by 258. 10 By contrast, $1 million <strong>for</strong> parent training led<br />
to 157 fewer crimes, $1 million on supervising delinquents led to 72<br />
fewer serious crimes, and $1 million devoted to three-strike laws led<br />
to just 60 fewer serious <strong>of</strong>fenses. 11<br />
As a crime-prevention strategy, longer and more certain prison<br />
sentences seem to reduce property crimes, but not violent crimes. 12<br />
Yet incarceration does make it much easier to build up DNA databases<br />
and recent research has found that criminals included in DNA<br />
databases are less likely to commit new crimes as well as more likely<br />
to be apprehended when they do so. 13 According to one analysis a 50<br />
percent increase in the size <strong>of</strong> the average DNA database could produce<br />
a 13.5 percent reduction in murders, a 27.2 percent reduction in<br />
rapes, and a 12.2 percent reduction in aggravated results.<br />
Many social and economic policies designed <strong>for</strong> other purposes may<br />
also reduce the incidence <strong>of</strong> serious crimes. Programs to encourage<br />
young people to remain in school, <strong>for</strong> example, have proved to be<br />
one <strong>of</strong> the most cost-effective crime-reduction strategies. 14 Similarly,<br />
community-development ef<strong>for</strong>ts to increase business investment in<br />
at-risk neighborhoods have also been shown to reduce crime rates. 15<br />
Finally, demographics play a role. Male youth are the population group<br />
most prone to commit serious crimes so as their share <strong>of</strong> the population<br />
grew with the initial baby boom and then fell with the subsequent<br />
baby bust, crime rates also increased and then subsided. 16<br />
Introduction and summary | www.americanprogress.org 5
<strong>The</strong> consequences <strong>of</strong> falling crime<br />
rates on real estate values, city<br />
budgets, and local residents<br />
Housing values<br />
First, we will examine and analyze how a reduction in the incidence <strong>of</strong> violent<br />
crimes in a city affects the value <strong>of</strong> housing in that city. To undertake this analysis we<br />
collected data on the incidence <strong>of</strong> violent crimes by geographic area <strong>for</strong> eight cities:<br />
• Boston<br />
• Chicago<br />
• Dallas<br />
• Houston<br />
• Jacksonville<br />
• Milwaukee<br />
• Philadelphia<br />
• Seattle<br />
<strong>The</strong>se cities provided data covering varying periods <strong>of</strong> time from 2000 on, ranging<br />
from 6 to 11 years. Police departments in five <strong>of</strong> the cities were able to provide<br />
complete data by zip code covering a sufficiently long period <strong>for</strong> statistical analysis—Chicago,<br />
Houston, Jacksonville, Milwaukee, and Philadelphia.<br />
We also collected data on the value <strong>of</strong> residential real estate in each city by zip code<br />
<strong>for</strong> the same time periods covered by the crime data. We used those two datasets to<br />
analyze the consequences <strong>of</strong> the actual changes in violent crime rates on actual housing<br />
values, using so called dynamic panel regression models in conjunction with<br />
Granger causality testing. (See Appendix A, Table A-2, on page 54 <strong>for</strong> a detailed<br />
description <strong>of</strong> this methodology.) This analysis shows that, on average, a reduction<br />
in homicides <strong>of</strong> one incident in a zip code during a given year causes a 1.52 percent<br />
increase in home prices in that zip code the following year.<br />
<strong>The</strong> consequences <strong>of</strong> falling crime rates on real estate values, city budgets, and local residents | www.americanprogress.org 7
<strong>The</strong> impact on real estate values <strong>of</strong> lower rates <strong>of</strong> other violent crimes, however,<br />
is more difficult to establish. Our analysis did not establish a statistically significant<br />
relationship. In fact, it found that falling rates <strong>of</strong> violent crimes other than<br />
homicides were followed by falling housing prices, though not to a statistically<br />
significant degree. We discount these results, however, because they likely reflect<br />
persistent problems with these types <strong>of</strong> crime data. Unlike murders, other violent<br />
crimes are sharply underreported. According to the Justice Department National<br />
<strong>Crime</strong> Victimization Surveys, on average only 45 percent <strong>of</strong> rapes and 59 percent<br />
<strong>of</strong> assaults are reported to police.<br />
Moreover, the rates at which those crimes are reported may shift from year to year<br />
in no stable relationship to the rates at which those crimes actually occur. Since<br />
this analysis depends on changes in crime rates in small geographic areas (zip<br />
codes), these random variations preclude reliable results.<br />
<strong>The</strong> results from homicides are reliable, however, and the economic consequences<br />
<strong>of</strong> reduced rates <strong>of</strong> homicides can be very large. Here, we were able to roughly estimate<br />
the metropolitan statistical area-wide impact <strong>for</strong> seven <strong>of</strong> the eight sample<br />
cities (all but Houston). We estimate, <strong>for</strong> example, that a 10 percent reduction in<br />
homicides could increase the value <strong>of</strong> the housing stock <strong>of</strong> the Boston area by $4.4<br />
billion in the following year. (see Table 5 on page 17)<br />
Similarly, a 10 percent drop in homicides could increase the value <strong>of</strong> the housing<br />
stock by $3.2 billion in the Philadelphia metropolitan area, by $2.9 billion in<br />
the Seattle area, by $2.4 billion in the Dallas area, by $2.2 billion in the Chicago<br />
metropolitan area, by $800 million in and around Milwaukee, and by $600 million<br />
in the Jacksonville area. A 10 percent reduction in homicides, there<strong>for</strong>e, should<br />
generate large revenue gains from the property taxes applied to those values.<br />
<strong>The</strong> housing stock data, however, cover metropolitan areas, which in each case<br />
encompass city and suburban jurisdictions with different property tax rates.<br />
<strong>The</strong>re<strong>for</strong>e, we cannot estimate the precise dimensions <strong>of</strong> these additional property<br />
tax revenues <strong>for</strong> the eight sampled cities.<br />
8 <strong>Center</strong> <strong>for</strong> American Progress | <strong>The</strong> <strong>Economic</strong> <strong>Benefits</strong> <strong>of</strong> <strong>Reducing</strong> <strong>Violent</strong> <strong>Crime</strong>
City budgets and their residents<br />
Next, we analyzed other benefits and savings <strong>for</strong> individuals, communities, and<br />
municipal budgets that come from reductions in violent crimes, using data on violent<br />
crimes from all eight cities examined in this report. This analysis begins with<br />
an accounting <strong>of</strong> the direct costs <strong>of</strong> violent crime:<br />
• <strong>The</strong> medical costs borne by surviving victims <strong>of</strong> violent crime<br />
• Municipal spending on police<br />
• Courts and corrections<br />
• <strong>The</strong> <strong>for</strong>egone productivity <strong>of</strong> murder victims, victims <strong>of</strong> other violent crimes<br />
while they recover, and <strong>of</strong> criminals while they remain in jail or prison<br />
Across the eight cities, these direct costs arising from the four types <strong>of</strong> violent crimes<br />
total nearly $3.7 billion per year. <strong>The</strong>se direct costs are equivalent to an average <strong>of</strong><br />
$320 per resident per year <strong>for</strong> the eight cities, ranging from $144 per resident per<br />
year in Seattle to $472 per resident per year in Philadelphia. (see Table 2)<br />
TABLE 2<br />
<strong>The</strong> direct costs <strong>of</strong> violent crimes<br />
Estimated direct costs <strong>of</strong> violent crimes by city 2010 ($ millions)<br />
City Victims Justice system<br />
Productivity losses<br />
(criminals)<br />
Total Cost per resident<br />
Boston $72 $102 $24 $198 $308<br />
Chicago $426 $547 $132 $1,104 $390<br />
Dallas $145 $175 $43 $363 $278<br />
Houston $268 $393 $91 $752 $330<br />
Jacksonville $78 $100 $24 $202 $246<br />
Milwaukee $92 $115 $27 $235 $388<br />
Philadelphia $299 $351 $86 $736 $472<br />
Seattle $21 $56 $12 $89 $144<br />
Source: Authors’ calculations; Federal Bureau <strong>of</strong> Investigation Uni<strong>for</strong>m <strong>Crime</strong> Reports. Department <strong>of</strong> Justice National <strong>Crime</strong> Victimization Survey, 2006-2010, Department <strong>of</strong><br />
Justice Bureau <strong>of</strong> Justice Statistics Criminal Justice Expenditure and Employment, and Department <strong>of</strong> Justice Bureau <strong>of</strong> Justice Statistics National Judicial Reporting Program.<br />
<strong>The</strong> consequences <strong>of</strong> falling crime rates on real estate values, city budgets, and local residents | www.americanprogress.org 9
Given these costs reducing the incidence <strong>of</strong> violent crime should produce<br />
substantial benefits. <strong>The</strong> direct savings <strong>for</strong> city governments associated with a<br />
10 percent reduction in these four violent crimes would include commensurate<br />
reductions in spending on law en<strong>for</strong>cement, courts and corrections, and additional<br />
revenues from taxing the earnings <strong>of</strong> both would-be victims and would-be<br />
perpetrators <strong>of</strong> crimes that would not occur under this scenario.<br />
A 10 percent decline in violent crime should produce direct savings to the governments<br />
<strong>of</strong> the eight cities ranging from $2 million per year in Seattle to $24 million<br />
per year in Chicago. Similarly, a 25 percent reduction in violent crime—half <strong>of</strong> the<br />
nationwide decline seen from 1990 to 2010 <strong>for</strong> rape, robbery, and assault—would<br />
mean annual savings <strong>for</strong> the eight city governments ranging from $6 million per<br />
year in Seattle to $59 million per year in Chicago.<br />
Across all eight cities a 10 percent reduction in violent crime rates would produce<br />
combined direct savings <strong>of</strong> $82 million per year <strong>for</strong> the eight city governments,<br />
while a 25 percent reduction would produce $204 million. (see Table 3)<br />
TABLE 3<br />
Savings from reduced violent crime<br />
Estimated budget costs from violent crime and budget savings from 10 percent and 25 percent reductions<br />
in those crimes, by city, 2010 ($ millions)<br />
City<br />
Police, courts and<br />
corrections<br />
Budgetary costs<br />
Tax revenue<br />
Total<br />
Annual budget savings from<br />
reducing violent crimes<br />
10 Percent<br />
reduction<br />
25 Percent<br />
reduction<br />
Boston $102 $6.8 $109 $11 $27<br />
Chicago $547 $18.2 $565 $56 $141<br />
Dallas $175 $5.6 $180 $18 $45<br />
Houston $393 $10.8 $404 $40 $101<br />
Jacksonville $100 $4.1 $104 $10 $26<br />
Milwaukee $115 $2.9 $118 $12 $30<br />
Philadelphia $351 $33.3 $384 $38 $96<br />
Seattle $56 $1.1 $57 $6 $14<br />
Source: U.S. Census Bureau (2010), authors’ calculations. Estimates <strong>of</strong> revenues losses assume one-to-one relationship between growth in the incomes <strong>of</strong> city residents and<br />
growth in the city’s total tax revenues.<br />
10 <strong>Center</strong> <strong>for</strong> American Progress | <strong>The</strong> <strong>Economic</strong> <strong>Benefits</strong> <strong>of</strong> <strong>Reducing</strong> <strong>Violent</strong> <strong>Crime</strong>
Such reductions in violent crime could release or create new resources <strong>for</strong> other<br />
municipal purposes. A 25 percent reduction would save the city <strong>of</strong> Boston, <strong>for</strong><br />
example, sufficient funds and generate sufficient additional revenues to either<br />
fund a 1 percent cut in that city’s property taxes, increase city spending on health<br />
and human services by 6.8 percent, or boost spending on housing and community<br />
development by 14.4 percent. Similarly, a 25 percent drop in Houston’s violentcrime<br />
rates would generate sufficient additional resources to double that city’s<br />
budget <strong>for</strong> health and human services or fund a 5.1 percent cut in property taxes.<br />
Researchers also have studied and estimated the less tangible, indirect costs arising<br />
from violent crime, especially the pain, suffering, and diminished quality <strong>of</strong> life<br />
that surviving victims <strong>of</strong> violent crime experience as well as effects on the families<br />
<strong>of</strong> murder victims. Unlike the more tangible, direct costs <strong>of</strong> violent crimes, there<br />
are no objective measures <strong>for</strong> these genuine losses. But scholars have developed a<br />
variety <strong>of</strong> methods to estimate the value <strong>of</strong> the pain, suffering, and reduced quality<br />
<strong>of</strong> life <strong>of</strong> people who are raped, violently assaulted, or robbed.<br />
All <strong>of</strong> these approaches find that these intangible costs exceed the direct costs by<br />
an order <strong>of</strong> three to four. Nationwide, these intangible costs come to an estimated<br />
$156 billion per year. For the eight cities examined here, these intangible costs are<br />
estimated to total nearly $14 billion per year, ranging from $216 million per year<br />
in Seattle to $4.2 billion per year in Chicago<br />
<strong>The</strong>re<strong>for</strong>e, a 10 percent or 25 percent reduction in violent crime should proportionately<br />
reduce those indirect, intangible costs. A 25 percent reduction would save<br />
potential victims <strong>of</strong> violent crimes in Milwaukee, <strong>for</strong> example, pain, suffering, and<br />
diminished quality <strong>of</strong> life valued at $225 million per year, while a similar decline in<br />
violent crimes in Dallas would be worth $361 million in intangible benefits <strong>for</strong> those<br />
who otherwise would have been victims <strong>of</strong> violent crimes. (see Table 4 on next page)<br />
<strong>The</strong> consequences <strong>of</strong> falling crime rates on real estate values, city budgets, and local residents | www.americanprogress.org 11
TABLE 4<br />
Direct and indirect costs <strong>of</strong> violent crimes<br />
Estimated direct and indirect costs <strong>of</strong> violent crimes, by city, 2010 ($ millions)<br />
City<br />
Victim<br />
Direct costs<br />
Justice<br />
system<br />
Criminal Total direct Intangible<br />
Intangible and total costs<br />
Total direct<br />
and intangible<br />
Boston $72 $102 $24 $198 $734 $932<br />
Chicago $426 $547 $132 $1,104 $4,206 $5,310<br />
Dallas $145 $175 $43 $363 $1,444 $1,807<br />
Houston $268 $393 $91 $752 $2,655 $3,407<br />
Jacksonville $78 $100 $24 $202 $802 $1,004<br />
Milwaukee $92 $115 $27 $235 $900 $1,135<br />
Philadelphia $299 $351 $86 $736 $2,970 $3,705<br />
Seattle $21 $56 $12 $89 $216 $305<br />
Source: FBI, “Uni<strong>for</strong>m <strong>Crime</strong> Reports,” as prepared by the National Archive <strong>of</strong> Criminal Justice Data, available at http://www.ucrdatatool.gov/Search/<strong>Crime</strong>/State/State<strong>Crime</strong>.<br />
cfm; Kathryn E. McCollister, Michael T. French, and Hai Fang, “<strong>The</strong> Cost <strong>of</strong> <strong>Crime</strong> to Society: New <strong>Crime</strong>-Specific Estimates <strong>for</strong> Policy and Program Evaluation,” Drug and<br />
Alcohol Dependence 108 (1-2) (2010): 98–109.<br />
We now turn to more detailed analyses <strong>of</strong> the consequences <strong>of</strong> falling violent<br />
crime rates on real estate values, city budgets, and local residents.<br />
12 <strong>Center</strong> <strong>for</strong> American Progress | <strong>The</strong> <strong>Economic</strong> <strong>Benefits</strong> <strong>of</strong> <strong>Reducing</strong> <strong>Violent</strong> <strong>Crime</strong>
<strong>The</strong> impact <strong>of</strong> lower rates <strong>of</strong><br />
violent crime on real estate values<br />
<strong>The</strong> analysis in this section is based on data provided by the police departments<br />
<strong>of</strong> five cities on the incidence <strong>of</strong> violent crimes by geographic location, and data<br />
on residential home sales in those cities by zip code from DataQuick. As we will<br />
demonstrate, changes in homicide rates in particular across those five cities had<br />
clear and significant effects on the value <strong>of</strong> homes in the same areas. Homicides<br />
obviously exact an incalculable toll on the victims and significant costs on their<br />
families. But costs also are borne by everyone who lives nearby through the<br />
impact on property prices. Moreover, our analysis found that successful ef<strong>for</strong>ts<br />
to reduce homicides would generate substantial benefits not only <strong>for</strong> those who<br />
otherwise would be victims but also <strong>for</strong> the area as a whole.<br />
<strong>The</strong>se findings have important implications <strong>for</strong> policymakers because the<br />
equity that people hold in their homes accounts <strong>for</strong> much <strong>of</strong> Americans’ wealth.<br />
Increases in home values driven by the exogenous factor <strong>of</strong> a falling homicide rate<br />
translate directly into increases in the wealth and financial security <strong>of</strong> the families<br />
who own those homes. Such increases in housing values also can lead to substantially<br />
higher local government revenues when property tax assessments catch up<br />
with the underlying increase in home values.<br />
Data and methodology<br />
This analysis focused on the five cities <strong>of</strong> Chicago, Houston,<br />
Jacksonville, Milwaukee, and Philadelphia, covering at most the 11<br />
years between 2000 and 2011. <strong>The</strong> police departments in these cities<br />
provided violent crime data by zip code. We obtained median and<br />
mean residential property prices by zip code <strong>for</strong> the same cities tract<br />
from DataQuick, a public-records database company. DataQuick compiles<br />
real estate data from public sources such as county assessors’<br />
<strong>of</strong>fices and county recorders’ <strong>of</strong>fices and provides estimates <strong>of</strong> prices<br />
<strong>for</strong> new, existing, attached, and detached home-sale transactions. 17<br />
<strong>The</strong> crime data we collected covered reports <strong>of</strong> homicides, rapes,<br />
robberies, and aggravated assaults, covering all <strong>of</strong> these crimes and<br />
attempted crimes regardless <strong>of</strong> whether arrests or convictions were Continued on next page<br />
13 <strong>Center</strong> <strong>for</strong> American Progress | <strong>The</strong> <strong>Economic</strong> <strong>Benefits</strong> <strong>of</strong> <strong>Reducing</strong> <strong>Violent</strong> <strong>Crime</strong><br />
ever made. <strong>The</strong>se crime data were not reported in a uni<strong>for</strong>m <strong>for</strong>mat<br />
across police departments. Each department provided a list <strong>of</strong> every<br />
reported violent crime by some geographic identification over the<br />
longest period available from 2000 to 2011.<br />
Philadelphia, Milwaukee, and Jacksonville all provided the point location<br />
<strong>of</strong> each reported crime. We also engaged Spatial Insights, Inc., a geographic<br />
in<strong>for</strong>mation services company, to “reverse geocode” these point<br />
locations to zip codes. Houston and Chicago provided street addresses,<br />
which we mapped onto zip codes using the “Geocode+Maps,” s<strong>of</strong>tware<br />
from GeoLytics, Inc., with a success rate <strong>of</strong> 99 percent.<br />
| www.americanprogress.org 13
<strong>The</strong> data from different cities covered varying periods: 11 years<br />
(Jacksonville, 2001–2011), 10 years (Chicago, 2001–2010), nine years<br />
(Houston, 2000–2008), and six years (Milwaukee, 2005–2010, and<br />
Philadelphia, 2004–2009). As expected, the relative prevalence <strong>of</strong><br />
these crimes is fairly uni<strong>for</strong>m across the cities, with homicides being<br />
least common, followed by rapes, and aggravated assaults and robberies<br />
occurring much more frequently.<br />
Our empirical method applied the standard “Granger Causality” statistical<br />
regression test to identify any causal relationship between changes<br />
in these violent crimes and changes in residential property prices.<br />
In addition to the proposition that lower crime rates lead to higher<br />
property values, we also consider the possibility that higher residential<br />
property prices lead to reductions in violent crimes, and that violent<br />
crime rates and property prices are correlated with some other, third<br />
factor. We also recognize that there may be significant “multicollinearity”<br />
between the different types <strong>of</strong> violent crimes, so we group the<br />
crimes into the two variables <strong>of</strong> homicides and nonhomicides.<br />
A more detailed description <strong>of</strong> our methodology and the summary<br />
statistics from the regression analysis is provided in Appendix A,<br />
Tables A-1 and A-2, on pages 52 and 54.<br />
Results<br />
Our main specification focused on the relationship between changes in violentcrime<br />
rates and changes in housing prices by zip code across five cities—Chicago,<br />
Houston, Jacksonville, Milwaukee, and Philadelphia. <strong>The</strong> Granger causality<br />
analysis found, first, the wholly unremarkable finding that, by zip code, housing<br />
prices in any one year affect housing prices in the following year to a statistically<br />
significant degree. (see Table A2 in Appendix A on page 54) In technical terms,<br />
changes in median residential property prices in an area in one year have a positive<br />
coefficient and are statistically significant in explaining the change in median<br />
residential property prices in that area in the following year.<br />
More important, the causality test found that changes in the incidence <strong>of</strong> murders<br />
in a zip code in one year affect or explain, to a statistically significant degree,<br />
changes in residential property prices in the following year. Fewer murders in one<br />
year, there<strong>for</strong>e, “Granger cause” higher residential property prices the next year,<br />
and higher numbers <strong>of</strong> murders “Granger cause” lower residential property prices<br />
the following year.<br />
More specifically, a reduction in homicides <strong>of</strong> one in a zip code Granger causes a<br />
1.52 percent increase in home prices in that same zip code the following year. This<br />
relationship is symmetrical: Each additional homicide in a zip code, compared<br />
to the year be<strong>for</strong>e, is associated with a 1.52 percent reduction in home property<br />
values in the following year. This large <strong>of</strong> an effect from changes in homicide levels<br />
is not unexpected, given that the average number <strong>of</strong> homicides per zip code, per<br />
year across the cities sampled is only 5.51 per year.<br />
14 <strong>Center</strong> <strong>for</strong> American Progress | <strong>The</strong> <strong>Economic</strong> <strong>Benefits</strong> <strong>of</strong> <strong>Reducing</strong> <strong>Violent</strong> <strong>Crime</strong>
<strong>The</strong>se results are not affected by the underlying facts that through most <strong>of</strong> this<br />
period, murders were generally declining and housing prices were generally rising.<br />
<strong>The</strong> regression analysis takes account <strong>of</strong> these underlying facts and isolates and<br />
analyzes rates <strong>of</strong> changes in each <strong>of</strong> the variables across hundreds <strong>of</strong> observations<br />
by zip code and year.<br />
<strong>The</strong> impact <strong>of</strong> falling rates <strong>of</strong> violent crimes other than homicides, however, is<br />
much more difficult to determine. Indeed, the regression analysis initially found<br />
the opposite effect from homicides. Falling rates <strong>of</strong> nonhomicide were associated<br />
with small declines in housing prices, or, since the relationship is symmetrical,<br />
rising nonhomicide crime rates were accompanied by slight increases in housing<br />
prices. <strong>The</strong>se results, however, were not statistically significant.<br />
In fact, these results likely reflect a recurring, underlying problem with nonhomicide<br />
crime data. <strong>The</strong> murder rate is widely considered the most reliable measure<br />
<strong>of</strong> violent crime. This is because virtually all murders are reported to the police.<br />
By contrast, a significant share <strong>of</strong> all rapes, robberies, and assault are not reported.<br />
Comparing “deaths from assault” (homicides) as reported by the <strong>Center</strong> <strong>for</strong> Disease<br />
Control with FBI reports <strong>of</strong> murder and non-negligent manslaughter, we find that<br />
more than 92 percent <strong>of</strong> all murders are reported to police. 18 But National <strong>Crime</strong><br />
Victimization Surveys report that, on average, 45 percent <strong>of</strong> rapes, 59 percent <strong>of</strong><br />
assaults, and 62 percent <strong>of</strong> robberies are reported to police. In addition, the rates at<br />
which these other violent crimes are reported vary from year to year, so that changes<br />
in their reported rates may not reflect changes in their actual incidence.<br />
<strong>The</strong>re<strong>for</strong>e, an observed increase in these crimes may reflect shifts in reporting<br />
patterns rather than actual changes in crime rates. This effect may be very large in a<br />
small geographic area such as a zip code. When the police increase their presence<br />
in an area (such as a zip code), reported crimes may rise even when the actual<br />
incidence <strong>of</strong> those crimes is unchanged or even falls. Changes in the numbers <strong>of</strong><br />
reported robberies, rapes, and aggravated assaults in a zip code may also be associated<br />
with increases in urban density when, <strong>for</strong> example, new businesses arrive and<br />
new residences are built in an area. Such a development could result, at once, in<br />
higher reported crime rates and higher property values, both reflecting the third<br />
variable <strong>of</strong> accelerated development. Along with many other researchers on the<br />
impact <strong>of</strong> crime, we there<strong>for</strong>e focus this analysis on homicides.<br />
<strong>The</strong> technical specifications and results <strong>of</strong> the Granger causality analysis are provided<br />
in Appendix A at page 51.<br />
<strong>The</strong> impact <strong>of</strong> lower rates <strong>of</strong> violent crime on real estate values | www.americanprogress.org 15
In addition, Appendix B beginning on page 55 provides the results <strong>of</strong> six tests <strong>of</strong><br />
the robustness <strong>of</strong> our main results. <strong>The</strong> tests demonstrate that the basic findings<br />
on the impact <strong>of</strong> changes in homicide rates are not affected by alternate specifications.<br />
In particular, we tested the sensitivity <strong>of</strong> our results to an increased number<br />
<strong>of</strong> lags, the inclusion <strong>of</strong> squared terms, the use <strong>of</strong> average rather than median<br />
property-price data, one-step estimation rather than two-step estimation, the<br />
inclusion <strong>of</strong> differing depths <strong>of</strong> lags, and an uncollapsed instrument matrix. <strong>The</strong>se<br />
results confirm the impact <strong>of</strong> changes in homicide rates on changes in housing<br />
prices in zip code-size areas.<br />
Impact <strong>of</strong> homicides on the value <strong>of</strong> the housing stock across a<br />
city or metropolitan area<br />
Although our analysis was conducted at the zip-code level, we can use the results<br />
to estimate the impact <strong>of</strong> changes in homicide rates on the value <strong>of</strong> the overall<br />
housing stock <strong>of</strong> a city or metropolitan area. <strong>The</strong>se estimates assume that the effect<br />
<strong>of</strong> reductions in homicide rates does not vary based on the absolute number <strong>of</strong><br />
homicides in an area, and that people are as likely to move between cities or metropolitan<br />
areas in response to changes in homicide rates in their neighborhoods as<br />
they are to move within the same city or metropolitan area.<br />
Using these assumptions we can estimate how much the value <strong>of</strong> the housing stock<br />
in the five cities examined here would be expected to rise in response to specified<br />
reductions in the homicide rates in those cities. <strong>The</strong>se estimates should be accurate<br />
<strong>for</strong> the cities examined in this study, since they are all cities with accessible suburbs<br />
or nearby metropolitan areas that can provide potential new residents, and there<strong>for</strong>e<br />
increased demand <strong>for</strong> housing in areas with falling homicide rates.<br />
As noted earlier, by combining the average number <strong>of</strong> homicides in those cities<br />
with our regression results, we find that a 10 percent reduction in homicides<br />
corresponds to a 0.83 percent increase in residential property values and prices<br />
the following year. A 25 percent reduction in homicides in these cities could push<br />
housing prices up by nearly 2.1 percent. This calculation allows us to estimate<br />
the overall gain in residential property values that could accompany a 10 percent<br />
reduction in homicides at the citywide or metropolitan areawide level. Moreover,<br />
we can extend this analysis to cover other cities considered here, so long as the<br />
relevant data on housing stock is available.<br />
16 <strong>Center</strong> <strong>for</strong> American Progress | <strong>The</strong> <strong>Economic</strong> <strong>Benefits</strong> <strong>of</strong> <strong>Reducing</strong> <strong>Violent</strong> <strong>Crime</strong>
This analysis draws on total market value estimates <strong>for</strong> metropolitan areas from<br />
the Zillow Real Estate Market Reports <strong>of</strong> December 2010. 19 Since market value<br />
estimates <strong>for</strong> 2011 are not available, we estimate the effect on total residential<br />
property values in 2011 if the cities or their metropolitan areas had reduced<br />
homicides by 10 percent in 2010. <strong>The</strong>se are high-end estimates that provide a<br />
rough measure <strong>of</strong> the wealth gains that could accompany a 10 percent reduction<br />
in homicide rates. Houston is omitted from this analysis because Zillow does not<br />
provide an estimate <strong>of</strong> total housing-market value in that city’s metropolitan area.<br />
<strong>The</strong>re<strong>for</strong>e, these estimates cover the other seven cities.<br />
This analysis shows that a 10 percent reduction in homicides could increase the<br />
value <strong>of</strong> the residential housing stock by $4.4 billion in the Boston metropolitan<br />
area, by $2.4 billion in the Dallas metropolitan area, by $2.2 billion in the<br />
Chicago metropolitan area, and by $600 million in the Jacksonville metropolitan<br />
area. Similarly, a 10 percent reduction in homicides would boost the total value<br />
<strong>of</strong> all residential housing by $3.2 billion across the Philadelphia metropolitan<br />
area, by $2.9 billion in the Seattle metropolitan area, and by $800 million in the<br />
Milwaukee metropolitan area. (see Table 5)<br />
TABLE 5<br />
Housing values rise as homicides decline<br />
Estimated impact <strong>of</strong> a 10 percent reduction in homicides in 2010 on total residential<br />
housing values in 2011, by metropolitan area ($ billions)<br />
Metropolitan area Value <strong>of</strong> all housing, 2010 Increase in value <strong>of</strong> all housing, 2011<br />
Boston $532,000,000,000 $4,400,000,000<br />
Chicago $266,000,000,000 $2,200,000,000<br />
Dallas $294,000,000,000 $2,400,000,000<br />
Jacksonville $75,000,000,000 $600,000,000<br />
Milwaukee $99,000,000,000 $800,000,000<br />
Philadelphia $391,000,000,000 $3,200,000,000<br />
Seattle $349,000,000,000 $2,900,000,000<br />
Source: Zillow Real Estate Market Reports <strong>of</strong> December 2011; authors’ calculations.<br />
<strong>The</strong> impact <strong>of</strong> lower rates <strong>of</strong> violent crime on real estate values | www.americanprogress.org 17
<strong>The</strong> large gains in the value <strong>of</strong> a city’s housing stock associated with a 10 percent<br />
decline in homicides suggest that a successful ef<strong>for</strong>t to reduce violent crime could<br />
generate large revenue gains from the property taxes applied to those higher home<br />
values. Un<strong>for</strong>tunately, data constraints preclude our estimating those revenue<br />
gains with confidence because housing stock data cover metropolitan areas, and<br />
in each case, these metropolitan areas encompass city and suburban jurisdictions<br />
with varying property tax rates.<br />
18 <strong>Center</strong> <strong>for</strong> American Progress | <strong>The</strong> <strong>Economic</strong> <strong>Benefits</strong> <strong>of</strong> <strong>Reducing</strong> <strong>Violent</strong> <strong>Crime</strong>
Estimating other direct savings<br />
and intangible benefits<br />
<strong>of</strong> reducing violent crime<br />
Economists, political scientists, and sociologists have examined the various<br />
costs that violent criminals impose on their victims and communities. We have<br />
reviewed this research to establish the best-available methodologies <strong>for</strong> estimating<br />
those various costs and consequently calculated the savings and benefits that<br />
should follow from reductions in the incidence <strong>of</strong> those crimes.<br />
We estimate that a 10 percent reduction in violent crimes nationwide would generate<br />
direct and indirect saving <strong>of</strong> $20 billion per year. Similarly, a 25 percent reduction<br />
in those crime rates would generate benefits estimated at $50 billion per year.<br />
<strong>The</strong> various costs associated with violent crimes<br />
Most analysts distinguish between the direct or tangible costs <strong>of</strong> crimes and their<br />
indirect or intangible costs. <strong>The</strong> direct costs include, first, the value <strong>of</strong> property<br />
destroyed or damaged in the course <strong>of</strong> violent crimes, surviving victims’ medical<br />
expenses and lost earnings from crime-related injuries, the productivity losses <strong>for</strong><br />
those victims associated with the aftermath <strong>of</strong> these crimes over both the short<br />
and long term, and the productivity losses <strong>for</strong> murder victims based on their<br />
expected earnings <strong>for</strong> the remainder <strong>of</strong> their working lives.<br />
<strong>The</strong> direct costs also include the expenditures by cities, counties, and states to<br />
apprehend, prosecute, and incarcerate the perpetrators <strong>of</strong> these crimes. Other<br />
direct costs include various types <strong>of</strong> private spending undertaken to avoid crime,<br />
including expenditures <strong>for</strong> home security systems, car alarms, security guards, and<br />
other security services. Finally, there are the economic losses entailed in moving<br />
accused or convicted people from a city’s labor <strong>for</strong>ce to its jails and prisons and<br />
sacrificing the productivity and other benefits associated with their working, paying<br />
taxes, and buying goods and services. <strong>The</strong>se last costs may seem problematic<br />
to some readers, because criminals are not commonly thought <strong>of</strong> as potentially<br />
Estimating other direct savings and intangible benefits <strong>of</strong> reducing violent crime | www.americanprogress.org 19
productive members <strong>of</strong> a community. Yet most criminals do work when they are<br />
not incarcerated, and we use the minimum wage to estimate these earnings.<br />
To calculate these direct costs <strong>of</strong> crime, we use what researchers commonly call<br />
the “cost-<strong>of</strong>-illness” approach, which disaggregates these direct costs into the separate<br />
elements listed above.<br />
While the direct costs <strong>of</strong> crime are significant, as are the associated direct savings<br />
from reducing such crime, the estimated value <strong>of</strong> the indirect and more intangible<br />
costs <strong>of</strong> violent crimes is much larger. <strong>The</strong>se indirect costs focus on phenomena<br />
that have no universally accepted measure <strong>of</strong> their values, especially the pain,<br />
suffering, and reduced quality <strong>of</strong> life that result from being a surviving victim or<br />
potential victim <strong>of</strong> violent crime. Researchers have developed various ways <strong>of</strong> estimating<br />
these intangible costs using a “hedonic model,” a “contingent valuation”<br />
approach, a jury-award method, or some combination <strong>of</strong> these approaches. We<br />
examine each <strong>of</strong> these approaches in detail in this section <strong>of</strong> the report.<br />
<strong>The</strong> “cost-<strong>of</strong>-illness” approach to calculating the direct costs <strong>of</strong> violent crime<br />
<strong>The</strong> “cost-<strong>of</strong>-illness” approach was first developed by public health experts to<br />
measure both the direct and intangible economic costs <strong>of</strong> illnesses and diseases.<br />
Its application to crime begins by identifying all <strong>of</strong> the distinct losses or costs<br />
associated with a crime and then estimating the value <strong>of</strong> each element. Most <strong>of</strong><br />
such analyses <strong>of</strong> crime rely on FBI Uni<strong>for</strong>m <strong>Crime</strong> Reports and the Department<br />
<strong>of</strong> Justice National <strong>Crime</strong> Victimization Surveys. <strong>The</strong> FBI Uni<strong>for</strong>m <strong>Crime</strong> Report<br />
provides estimates <strong>of</strong> the incidences <strong>of</strong> a wide range <strong>of</strong> criminal activities based<br />
on reports <strong>of</strong> known <strong>of</strong>fenses and arrests from various American law en<strong>for</strong>cement<br />
agencies. <strong>The</strong>se crime incidence statistics cover eight serious or “Part 1” <strong>of</strong>fenses,<br />
including four <strong>of</strong>fenses classified as violent crimes (murder, rape, robbery, and<br />
aggravated assault) and four others classified as property crimes (burglary,<br />
larceny-theft, motor vehicle theft, and arson). 20<br />
<strong>The</strong> Department <strong>of</strong> Justice National <strong>Crime</strong> Victimization Surveys collect in<strong>for</strong>mation<br />
on the victims <strong>of</strong> those crimes, including their out-<strong>of</strong>-pocket costs <strong>for</strong> medical<br />
treatment, property losses, and lost earnings. <strong>The</strong>se data are drawn from a national<br />
sample <strong>of</strong> 42,000 U.S. households covering 76,000 individuals. <strong>The</strong> Bureau <strong>of</strong><br />
Justice Statistics uses these data <strong>for</strong> an annual publication presenting a variety <strong>of</strong><br />
20 <strong>Center</strong> <strong>for</strong> American Progress | <strong>The</strong> <strong>Economic</strong> <strong>Benefits</strong> <strong>of</strong> <strong>Reducing</strong> <strong>Violent</strong> <strong>Crime</strong>
statistics on rapes and sexual assaults, robberies, aggravated assaults, burglaries,<br />
larceny-thefts, and motor vehicle thefts.<br />
Using these data the Bureau <strong>of</strong> Justice Statistics published one <strong>of</strong> the first comprehensive<br />
studies <strong>of</strong> the costs <strong>of</strong> crime in 1984. 21 That study calculated that the direct<br />
victim-related costs <strong>of</strong> crime in 1981 nationwide totaled $22.9 billion (2010 dollars).<br />
<strong>The</strong> bureau’s follow up study 10 years later found that direct victim-related<br />
costs grew to $27.4 billion (2010 dollars) from 1981 to 1991. <strong>The</strong>se reports were<br />
important early contributions to the research on the costs <strong>of</strong> crime.<br />
To estimate the direct costs <strong>of</strong> violent crimes in the United States today using<br />
this approach, we begin by updating the calculation <strong>of</strong> the direct economic costs<br />
borne by the victims <strong>of</strong> violent crime. Based on National <strong>Crime</strong> Victimization<br />
Surveys data <strong>for</strong> 2006–2010, we estimate the average out-<strong>of</strong>-pocket medical costs,<br />
property losses, and lost earnings <strong>of</strong> victims <strong>of</strong> rape, robbery, and assault over that<br />
five-year period. 22 This analysis shows, unsurprisingly, that victims <strong>of</strong> aggravated<br />
assault incur the largest average medical costs ($1,969) and highest total average<br />
costs ($2,133), and victims <strong>of</strong> completed robberies incur the largest average property<br />
losses ($1,263). (see Table 6)<br />
TABLE 6<br />
<strong>The</strong> direct costs <strong>of</strong> violent crime excluding murder<br />
Average out-<strong>of</strong>-pocket costs <strong>for</strong> victims <strong>of</strong> rape, robbery and assault based on estimates from<br />
the national crime victimization survey, 2006-2010 ($2010)<br />
<strong>Crime</strong> Medical Property Lost earnings Total<br />
Rape/Sexual Assault $201 $28 $17 $246<br />
Rape $314 $41 $24 $379<br />
Completed Rape $510 $41 $45 $596<br />
Attempted Rape $151 $40 $3 $195<br />
Sexual Assault $50 $8 $5 $63<br />
Robbery $244 $927 $67 $1,238<br />
Completed $122 $1,263 $59 $1,444<br />
Attempted $535 $107 $87 $729<br />
Assault $128 $10 $51 $188<br />
Aggravated Assault $526 $8 $61 $596<br />
Completed $1.969 $14 $150 $2,133<br />
Attempted $0 $6 $18 $24<br />
Simple Assault $25 $10 $48 $82<br />
Source: U.S. Department <strong>of</strong> Justice, National <strong>Crime</strong> Victimization Survey, (2006-2010).<br />
Estimating other direct savings and intangible benefits <strong>of</strong> reducing violent crime | www.americanprogress.org 21
Using a similar approach we also estimate the direct victim-related costs <strong>of</strong> the<br />
fourth violent crime: murder. This calculation assumes no out-<strong>of</strong>-pocket medical<br />
costs or property losses so the victim’s lost earnings over a lifetime constitute the<br />
only victim-related costs <strong>of</strong> the crime. To estimate the value <strong>of</strong> those earnings, we<br />
use data on the average age <strong>of</strong> murder victims from the National Vital Statistics<br />
System and data on average income by age reported by the U.S. Census Bureau’s<br />
Current Population Survey. We apply a discount value <strong>of</strong> 3 percent to derive the<br />
net present value <strong>of</strong> the lifetime earnings <strong>of</strong> murder victims, which we estimate<br />
to average $925,000. Using this figure, the results in Table 3, and the incidence <strong>of</strong><br />
violent crimes, we estimate that violent crimes nationwide in 2010 imposed direct<br />
costs on victims totaling $14.6 billion. (see Table 7)<br />
TABLE 7<br />
<strong>The</strong> total direct cost <strong>of</strong> violent crimes<br />
Victim-related costs from violent crimes including murder, nationwide, 2010<br />
<strong>Crime</strong> Direct costs per-<strong>of</strong>fense Offenses in 2010 Total direct costs<br />
Murder $924,562 14,748 $13,635 million<br />
Rape $379 84,767 $32 million<br />
Robbery $1,238 367,832 $455 million<br />
Aggravated Assault $596 $778,901 $464 million<br />
Total -- $1,246,248 $14,587 million<br />
Source: FBI Uni<strong>for</strong>m <strong>Crime</strong> Reports (2010); Department <strong>of</strong> Justice National <strong>Crime</strong> Vicitimization Survey, and authors calculations<br />
Calculating the costs <strong>of</strong> violent crime <strong>for</strong> the criminal justice system is more complex<br />
because the data on these costs are not usually disaggregated by types <strong>of</strong> crime.<br />
To estimate the law en<strong>for</strong>cement, judicial, and correctional costs <strong>of</strong> violent crimes,<br />
we start with total U.S. expenditures <strong>for</strong> police protection, judicial and legal services,<br />
and corrections in 2007, reported by the Bureau <strong>of</strong> Justice Statistics. 23 We then<br />
adjust the 2007 data to 2010 dollars. 24 Next, we use FBI Uni<strong>for</strong>m <strong>Crime</strong> Report<br />
arrest data to calculate arrests <strong>for</strong> violent crimes as a share <strong>of</strong> all arrests.<br />
In 2010 murders accounted <strong>for</strong> 0.1 percent <strong>of</strong> all arrests, rapes accounted <strong>for</strong> 0.15<br />
percent, robberies accounted <strong>for</strong> 0.9 percent, and aggravated assaults accounted<br />
<strong>for</strong> 3.1 percent. We apply these shares to the data on the aggregate costs <strong>of</strong> police<br />
and the judicial system. By this approach, we can estimate that the policing <strong>of</strong><br />
22 <strong>Center</strong> <strong>for</strong> American Progress | <strong>The</strong> <strong>Economic</strong> <strong>Benefits</strong> <strong>of</strong> <strong>Reducing</strong> <strong>Violent</strong> <strong>Crime</strong>
violent crimes cost $4.6 billion in 2010, and the adjudication <strong>of</strong> those accused <strong>of</strong><br />
violent crimes cost $2.2 billion.<br />
<strong>The</strong>se estimates, however, are very conservative. Police departments and courts<br />
give much higher priority to violent crimes. <strong>The</strong>re<strong>for</strong>e it is very likely that the<br />
share <strong>of</strong> police and judicial resources devoted to these crimes substantially exceeds<br />
their share <strong>of</strong> all crimes.<br />
<strong>The</strong> corrections costs <strong>for</strong> violent crimes are also difficult to measure. Some studies<br />
estimate correctional costs per <strong>of</strong>fense by multiplying the average cost per<br />
inmate <strong>for</strong> all U.S. jails and prisons by the number <strong>of</strong> inmates incarcerated <strong>for</strong> each<br />
<strong>of</strong>fense, and dividing that result by the number <strong>of</strong> total <strong>of</strong>fenses committed each<br />
year. But this approach assumes that the number and distribution <strong>of</strong> violent criminal<br />
<strong>of</strong>fenses committed each year remains constant, which is not the case.<br />
For a more accurate estimate, then, we start with data from the Bureau <strong>of</strong> Justice<br />
Statistics on the number <strong>of</strong> inmates incarcerated in jails and prisons in 2010,and<br />
total correctional costs at federal, state, and local levels. On this basis we calculate<br />
that the cost <strong>of</strong> incarceration per inmate in 2010 was $33,400. 25 Next we multiply<br />
the number <strong>of</strong> 2010 convictions <strong>for</strong> each <strong>of</strong> the four violent crimes by the average<br />
sentence <strong>for</strong> each crime, the percentage <strong>of</strong> each sentence actually served, and the<br />
estimated annual cost per inmate. 26 Using this approach we estimate that the correctional<br />
costs <strong>for</strong> the four violent crimes nationwide totaled $15.4 billion in 2010.<br />
<strong>The</strong> costs <strong>of</strong> the criminal justice system <strong>for</strong> violent crimes in 2010, there<strong>for</strong>e,<br />
totaled $22.2 billion: $4.6 billion (policing) + $2.2 billion (courts) + $15.4 billion<br />
(corrections).<br />
Other direct costs <strong>of</strong> these crimes involve the economic losses from the <strong>for</strong>egone<br />
productivity or economic output <strong>of</strong> those convicted <strong>of</strong> violent crimes. To estimate<br />
these costs we start with data on the pre-arrest personal incomes <strong>of</strong> convicted<br />
felons based on a 2002 national survey <strong>of</strong> inmates. 27 <strong>The</strong>se data suggest that convicted<br />
criminals earn about 40 percent <strong>of</strong> the U.S. average personal income. Using<br />
the approach adopted above to calculate correctional costs, we can estimate the<br />
lost income attributable to criminals <strong>for</strong> each type <strong>of</strong> violent crime based on the<br />
average income <strong>of</strong> convicted felons, the average age at sentencing <strong>for</strong> each type <strong>of</strong><br />
violent crime, and the average sentence served <strong>for</strong> each violent crime. We estimate<br />
that in 2010 violent crimes nationwide cost the U.S. economy some $5.4 billion in<br />
income, which those convicted would otherwise have produced.<br />
Estimating other direct savings and intangible benefits <strong>of</strong> reducing violent crime | www.americanprogress.org 23
Based on these calculations, the direct costs <strong>of</strong> violent crimes in 2010 totaled<br />
$42.2 billion nationwide: $14.6 billion (victim-related costs) + $22.2 billion<br />
(police, courts, and correctional costs) + $5.4 billion (lost work product <strong>of</strong> criminals).<br />
This is equivalent to a cost <strong>of</strong> $137 <strong>for</strong> every person in the United States.<br />
<strong>The</strong>re<strong>for</strong>e, a 10 percent reduction in violent crimes nationwide would save<br />
Americans nearly $1.5 billion in victim-related costs and $2.2 billion in law<br />
en<strong>for</strong>cement and judicial costs while increasing economic output by $540 million.<br />
Similarly, a 25 percent reduction in these crimes would save Americans $3.6 billion<br />
in victim-related losses and nearly $5.6 billion in law en<strong>for</strong>cement and judicial<br />
spending while increasing the economy’s output by nearly $1.4 billion annually.<br />
Estimating the intangible costs <strong>of</strong> violent crime<br />
<strong>The</strong> hedonic model approach <strong>for</strong> estimating these intangible costs<br />
<strong>The</strong> academic literature on the costs <strong>of</strong> crimes includes extensive analysis <strong>of</strong> indirect<br />
or intangible costs, notably the pain, suffering, and diminished quality <strong>of</strong> life<br />
experienced by victims <strong>of</strong> violent crimes. This literature includes numerous studies<br />
that apply so-called hedonic models drawn from housing markets. Hedonic<br />
models are designed to reveal people’s underlying preferences about the characteristics<br />
or attributes <strong>of</strong> a good, and then use those findings to estimate its value.<br />
In a housing market the value <strong>of</strong> a property can be estimated based on the number<br />
<strong>of</strong> bedrooms and bathrooms, the size <strong>of</strong> the lot, the location and characteristics <strong>of</strong><br />
the neighborhood, and so on.<br />
Cost-<strong>of</strong>-crime studies that use hedonic pricing assume that people reveal their<br />
preferences about crime levels when they purchase their homes, based on crime<br />
levels in that area. <strong>The</strong>se studies apply econometric models that control <strong>for</strong> other<br />
variables that influence housing prices in order to isolate the monetary value that<br />
homebuyers place on reduced risk <strong>of</strong> crime.<br />
<strong>The</strong> first study to adopt a hedonic model approach to estimate the intangible costs<br />
<strong>of</strong> crime used a sample <strong>of</strong> single-family home sales in Rochester, New York, in<br />
1971. 28 After controlling <strong>for</strong> the characteristics <strong>of</strong> the properties and neighborhoods<br />
as well as other variables, the author found that an increase in per capita<br />
24 <strong>Center</strong> <strong>for</strong> American Progress | <strong>The</strong> <strong>Economic</strong> <strong>Benefits</strong> <strong>of</strong> <strong>Reducing</strong> <strong>Violent</strong> <strong>Crime</strong>
property crime <strong>of</strong> 4.5 percent was associated with 3 percent lower home values.<br />
Using these findings the author estimated that the social and personal costs <strong>of</strong> a<br />
property crime in Rochester in 1971 averaged about $2,880 (in 2010 dollars).<br />
A broader study from 1999 analyzed the relationship between crime rates and<br />
urban flight <strong>for</strong> 127 American cities from 1970 to 1993. 29 Applying a hedonic<br />
model to FBI data on rapes, robberies, aggravated assaults, burglaries, larcenies,<br />
and auto thefts, the authors concluded that a 10 percent increase in those crimes<br />
led to a 1 percent decline in a city’s population, and that those population losses<br />
were associated with identifiable reductions in housing prices. Finally, a 2010<br />
study focused on housing prices and crime rates in Miami-Dade County, Florida,<br />
from 1999 to 2007 and found that a 1 percent increase in violent crime per acre<br />
reduced housing prices by about 0.25 percent. 30<br />
A key strength <strong>of</strong> this approach is that it relies on market data, which generally<br />
provide the most reliable in<strong>for</strong>mation on the true value <strong>of</strong> goods. <strong>The</strong> challenge<br />
lies in identifying all the factors other than crime that influence housing prices so<br />
the relationship between crime and housing prices can be isolated. This is particularly<br />
difficult <strong>for</strong> factors such as poverty, which may be correlated with both crime<br />
and low real estate values.<br />
Critics also note that an observed correlation between changes in crime rates and<br />
changes in housing prices may represent a causal relationship that runs from crime<br />
to housing prices and not in the other direction. Our own analysis <strong>of</strong> this relationship<br />
avoids the pitfalls <strong>of</strong> hedonic modeling by using the Granger Causality<br />
regression, which explicitly tests <strong>for</strong> and establishes the direction <strong>of</strong> the effect. In<br />
addition, this approach is <strong>of</strong>ten unable to distinguish the costs <strong>of</strong> different types <strong>of</strong><br />
crimes, because rates <strong>for</strong> the various kinds <strong>of</strong> crimes tend to rise and fall together.<br />
<strong>The</strong> contingent-valuation approach to estimating intangible costs<br />
In the absence <strong>of</strong> market data on a public good such as reduced crime or clean air,<br />
some economists rely instead on surveys that measure how much people say they<br />
would be willing to pay <strong>for</strong> those public goods. This approach is called “contingent<br />
valuation,” because the willingness-to-pay values reported in those surveys are contingent<br />
on the conditions presented in the survey. Contingent valuation analysis was<br />
first used in environmental economics, but it is now commonly applied to crime.<br />
Estimating other direct savings and intangible benefits <strong>of</strong> reducing violent crime | www.americanprogress.org 25
A 2001 analysis, <strong>for</strong> example, used a 1998 survey <strong>of</strong> more than 1,200 people to<br />
estimate how much people would be willing to pay to reduce gun violence by 30<br />
percent. 31 <strong>The</strong> study estimated a willingness-to-pay value <strong>of</strong> $24.5 billion, or about<br />
$1.2 million per gunshot injury. A 2004 analysis similarly surveyed 1,300 adults<br />
to estimate how much Americans would be willing to pay <strong>for</strong> a 10 percent reduction<br />
in murders, rapes, robberies, assaults, and burglaries. 32 Based on the survey<br />
the authors reported that the total personal and social costs <strong>of</strong> these crimes are<br />
between 1.5 times and 10 times greater than had been found previously—a result<br />
that they attributed to their capturing a range <strong>of</strong> intangible as well as direct costs.<br />
Here, too, many economists question the reliability <strong>of</strong> this approach. <strong>The</strong><br />
responses from the surveys sometimes contradict basic economic axioms, especially<br />
in the environmental area, when respondents say that they would be willing<br />
to pay the same or similar amounts to reduce water pollution by widely different<br />
amounts. 33 Another criticism is that contingent valuation suffers from “hypothetical<br />
bias” because survey respondents have no actual stake in the result.<br />
Finally, some analysts argue that the surveys do not measure people’s actual economic<br />
preferences but rather their general approval or disapproval about a public<br />
good such as reduced gun violence or cleaner air. So respondents may derive a<br />
sense <strong>of</strong> satisfaction from expressing their (theoretical) willingness to pay a high<br />
price <strong>for</strong> less crime or cleaner air, but in practice they might strongly oppose a new<br />
tax <strong>for</strong> the same purpose.<br />
Despite these criticisms the application <strong>of</strong> contingent valuation analysis to crime<br />
has certain advantages. In contrast to its use in the environmental area, respondents<br />
generally express a willingness to pay more <strong>for</strong> greater reductions in crime.<br />
On balance, a panel <strong>of</strong> experts recently concluded that a contingent valuation<br />
approach can produce estimates that provide a credible starting point <strong>for</strong> assessing<br />
the value <strong>of</strong> greater public safety, even though it may overstate people’s actual<br />
willingness to pay <strong>for</strong> it. 34<br />
<strong>The</strong> jury-award approach to estimating intangible costs<br />
This approach also applies people’s stated views on the intangibles costs <strong>of</strong> crime<br />
but in a less hypothetical way. This approach relies on data from jury awards in<br />
civil suits that compensate victims <strong>of</strong> violent crimes <strong>for</strong> pain and suffering. A 1988<br />
26 <strong>Center</strong> <strong>for</strong> American Progress | <strong>The</strong> <strong>Economic</strong> <strong>Benefits</strong> <strong>of</strong> <strong>Reducing</strong> <strong>Violent</strong> <strong>Crime</strong>
study used jury awards to estimate these costs <strong>for</strong> victims <strong>of</strong> 10 types <strong>of</strong> crimes,<br />
including rape, robbery, and assault. 35 This study also introduced other intangible<br />
costs unexamined by previous researchers, including the costs to victims’ mental<br />
health and anxieties related to perceived “risks <strong>of</strong> death.”<br />
A subsequent study published by the U.S. Department <strong>of</strong> Justice’s National Institute<br />
<strong>of</strong> Justice also used jury awards to estimate the costs arising from the pain and suffering<br />
<strong>of</strong> rape, robbery, and assault victims. 36 This study also estimated a variety <strong>of</strong><br />
costs associated with murders, which other researchers usually had left unexamined,<br />
including the pain and suffering <strong>of</strong> third parties, medical costs, and lost productivity. 37<br />
While the jury award approach provided a new way <strong>of</strong> capturing the intangible<br />
costs <strong>of</strong> crimes, it also raised certain concerns. For instance, since litigation is<br />
<strong>of</strong>ten costly the cases that are pursued civilly may involve unusually violent and<br />
injurious acts, creating an upward bias in the cost estimates. 38 In addition, some<br />
analysts argue that jury awards are inappropriate because they represent ex-post or<br />
“willingness-to-accept” estimates <strong>of</strong> the cost <strong>of</strong> crime rather than ex-ante or “willingness-to-pay”<br />
estimates derived, in principle, from contingent valuation surveys.<br />
Researchers have found that willingness-to-accept values are typically two to three<br />
times larger than comparable willingness-to-pay values, 39 which critics point to as<br />
support <strong>for</strong> the view that jury awards incorporate an upward bias.<br />
In the end we find that the most credible estimates <strong>of</strong> the intangible costs were<br />
derived from a very large and recent study that used a modified jury compensation<br />
approach to calculate per-<strong>of</strong>fense pain and suffering estimates <strong>for</strong> violent<br />
crime, entitled, “<strong>The</strong> Cost <strong>of</strong> <strong>Crime</strong> to Society: New <strong>Crime</strong>-Specific Estimates<br />
<strong>for</strong> Policy and Program Evaluation.” 40 <strong>The</strong> authors based their pain and suffering<br />
estimates on Jury Verdict Research (2004), which provides data on jury verdicts<br />
<strong>for</strong> individual injuries such as gunshot wounds, knife wounds, and rape-related<br />
injuries, based on their level <strong>of</strong> severity. 41 <strong>The</strong> authors then used 2007 data gathered<br />
by the Bureau <strong>of</strong> Justice Statistics on the probability that each <strong>of</strong>fense leads<br />
to various injuries, to estimate pain and suffering costs <strong>for</strong> individual <strong>of</strong>fenses.<br />
Moreover, as shown in Table 9 on page 32, the aggregate estimates <strong>of</strong> direct and<br />
intangible costs found by the “Cost <strong>of</strong> <strong>Crime</strong> to Society,” a study sponsored by<br />
the National Institute on Drug Abuse and the National Institutes <strong>of</strong> Health, 42<br />
are very close to those derived in a leading contingent valuation analysis that is<br />
also included in Table 9. 43<br />
Estimating other direct savings and intangible benefits <strong>of</strong> reducing violent crime | www.americanprogress.org 27
<strong>The</strong> limitations <strong>of</strong> all crime-related cost estimates<br />
<strong>The</strong> data used in all <strong>of</strong> these analyses <strong>of</strong> crime and their costs have certain limitations.<br />
Estimates <strong>of</strong> the income losses suffered by victims <strong>of</strong> violent crimes, <strong>for</strong><br />
example, generally assume that those victims are broadly representative <strong>of</strong> the whole<br />
population. In fact, data from the National <strong>Crime</strong> Victim Survey suggest that victims<br />
<strong>of</strong> rape, robbery, and assault have lower-than-average annual incomes: 35 percent<br />
<strong>of</strong> the victims <strong>of</strong> violent crimes between 2006 and 2010 lived in households with<br />
incomes <strong>of</strong> less than $20,000, compared to 20 percent <strong>of</strong> all American households. 44<br />
Similarly, data from municipal police departments suggest that 70 percent to 80<br />
percent <strong>of</strong> homicide victims in large cities have criminal records. 45 This suggests that<br />
the lifetime earnings losses attributed to murder victims may be overstated.<br />
At the same time other factors suggest that most estimates <strong>of</strong> the costs <strong>of</strong> crime<br />
are understated. Most notably, crime is notoriously underreported. Data from the<br />
National <strong>Crime</strong> Victim Survey indicate that less than 60 percent <strong>of</strong> all violent crimes<br />
are reported to the police: these respondents report that only 45 percent <strong>of</strong> rapes, 59<br />
percent <strong>of</strong> assaults, and 62 percent <strong>of</strong> robberies are reported to the police. If those<br />
data are correct, then the estimates <strong>of</strong> the costs to victims <strong>of</strong> violent crime in most <strong>of</strong><br />
the current research including this study are substantially understated.<br />
Between the various data issues and the approaches <strong>for</strong> estimating costs, researchers<br />
have produced a wide range <strong>of</strong> estimates. <strong>The</strong> estimates <strong>of</strong> the direct or<br />
tangible costs <strong>of</strong> one murder, <strong>for</strong> example, range from $1.3 million to $1.5 million,<br />
while the estimates <strong>for</strong> the indirect or intangible costs <strong>of</strong> one murder range from<br />
$2.9 million to more than $8.5 million. Similarly, the estimates <strong>of</strong> the direct costs<br />
<strong>of</strong> a rape or sexual assault vary from $7,642 to $41,774, and the estimated indirect<br />
or intangible costs range from $94,115 to $200,746. As noted above, we find<br />
that the per-<strong>of</strong>fense estimates derived by the “Cost <strong>of</strong> <strong>Crime</strong> to Society” study,<br />
on balance, are the most reliable available. (See Table 8 <strong>for</strong> a breakdown <strong>of</strong> these<br />
intangible cost estimates by four key researchers.)<br />
28 <strong>Center</strong> <strong>for</strong> American Progress | <strong>The</strong> <strong>Economic</strong> <strong>Benefits</strong> <strong>of</strong> <strong>Reducing</strong> <strong>Violent</strong> <strong>Crime</strong>
TABLE 8<br />
Estimates <strong>of</strong> Costs <strong>of</strong> <strong>Violent</strong> <strong>Crime</strong><br />
Survey <strong>of</strong> recent research on the direct and intangible costs <strong>of</strong> violent crimes, per-<strong>of</strong>fense (in 2010 dollars)<br />
<strong>Crime</strong> Cohen (1988) Miller et al (1996) Cohen et al (2004) McCollister et al (2010)<br />
Murder N/A $4,425,284 $9,098,564 $9,844,715<br />
Direct Costs N/A $1,543,022 N/A $1,294,771<br />
Intangible Costs N/A $2,882,263 N/A $8,549,945<br />
Rape & Sexual Assault $103,471 $130,477 $222,305 $242,521<br />
Direct Costs $9,357 $7,642 N/A $41,774<br />
Intangible Costs $94,115 $122,836 N/A $200,746<br />
Robbery $25,522 $12,059 $217,615 $26,711<br />
Direct Costs $2,258 $3,457 N/A $21,672<br />
Intangible Costs $23,265 $8,602 N/A $5,040<br />
Assault $24,375 $14,114 $65,660 $33,394<br />
Direct Costs $855 $2,344. N/A $19,787<br />
Intangible Costs $23,520 $11,770 N/A $13,607<br />
Sources: Mark A. Cohen, “Pain, Suffering, and Jury Awards: A Study <strong>of</strong> the Cost <strong>of</strong> <strong>Crime</strong> to Victims,” Law & Society Review 22 (3) (1988): 537–556. Ted R. Miller, Mark A.<br />
Cohen, and Brian Wierseman, “Victim Costs and Consequences: A New Look” (Washington, : National Institute <strong>of</strong> Justice Research Report, U.S. Department <strong>of</strong> Justice, 1996).<br />
Mark A. Cohen and others, “Willingness-To-Pay <strong>for</strong> <strong>Crime</strong> Control Programs,” Criminology 42 (1) (2004): 89–109. Kathryn E. McCollister, Michael T. French, and Hai Fang, “<strong>The</strong><br />
Cost <strong>of</strong> <strong>Crime</strong> to Society: New <strong>Crime</strong>-Specific Estimates <strong>for</strong> Policy and Program Evaluation,” Drug and Alcohol Dependence 108 (1-2) (2010): 98–109. <strong>The</strong> estimates from<br />
Cohen and others (2004) are adjusted by a factor <strong>of</strong> 1.35 <strong>for</strong> hypothetical bias. <strong>The</strong> McCollister and others (2010) estimates do not include intangible costs associated with<br />
a sense <strong>of</strong> enhanced risk <strong>of</strong> homicide.<br />
Estimating other direct savings and intangible benefits <strong>of</strong> reducing violent crime | www.americanprogress.org 29
<strong>The</strong> costs <strong>of</strong> violent crimes <strong>for</strong> eight<br />
U.S. cities and the benefits and<br />
savings from reducing those crimes<br />
Earlier in this report we provided the details behind our estimate that violent<br />
crimes across the United States cost Americans nearly $200 billion per year,<br />
including $46 billion in direct costs and nearly $156 billion in indirect, intangible<br />
costs. (see Table 4 on page 12) To estimate those intangible or indirect costs,<br />
we rely, as noted, on the recent “Cost <strong>of</strong> <strong>Crime</strong> to Society” study conducted by<br />
Kathleen McCollister, Michael French, and Hai Fang, which draws on jury award<br />
data to estimate the value <strong>of</strong> the pain and suffering arising from injuries from gunshot<br />
wounds, knife wounds, and physical assaults. 46<br />
Based on these data the authors calculated the average pain and suffering costs <strong>for</strong><br />
each type <strong>of</strong> violent crime. We adjusted their figures to 2010 dollars. While jury<br />
awards may introduce an upward bias, we suspect that the substantial underreporting<br />
<strong>of</strong> most types <strong>of</strong> violent crimes introduces a larger downward bias. While<br />
we consider these estimates to be the most reliable available, we are confident that<br />
the actual, total costs <strong>of</strong> all violent crimes, direct and intangible, are probably even<br />
higher than those reported here.<br />
<strong>The</strong> direct economic costs <strong>of</strong> those violent crimes cover the medical, property,<br />
and work- or productivity-related costs borne by surviving victims and by victims<br />
<strong>of</strong> homicide; the costs <strong>of</strong> policing, courts, and correctional facilities <strong>for</strong> those who<br />
commit violent crimes; and the value <strong>of</strong> the work or productivity-related losses<br />
<strong>of</strong> those arrested <strong>for</strong> violent crimes. For the eight cities examined in this report,<br />
those direct costs come to nearly $3.7 billion per year, ranging from an estimated<br />
$89 million per year in Seattle to more than $1.1 billion per year in Chicago. On<br />
a per-resident basis, these direct annual costs range from $144 per resident <strong>of</strong><br />
Seattle to $472 per resident <strong>of</strong> Philadelphia. 47 (see Table 9 on next page)<br />
<strong>The</strong> cost <strong>of</strong> violent crimes <strong>for</strong> eight U.S. cities and the benefits and savings from reducing those crimes | www.americanprogress.org 31
TABLE 9<br />
<strong>The</strong> multibillion dollar cost <strong>of</strong> violent crime<br />
Estimated direct costs <strong>of</strong> violent crime, by city, 2010 ($ millions)*<br />
City<br />
Victim<br />
costs<br />
Law en<strong>for</strong>cement and justice system costs<br />
Federal State Local Total<br />
Criminal<br />
productivity<br />
costs<br />
Total costs<br />
Cost per<br />
resident<br />
Boston $72 $12 $48 $42 $102 $24 $198 $308<br />
Chicago $426 $64 $265 $218 $547 $132 $1,104 $390<br />
Dallas $145 $20 $86 $69 $175 $43 $363 $278<br />
Houston $268 $47 $187 $159 $393 $91 $752 $330<br />
Jacksonville $78 $12 $47 $40 $100 $24 $202 $246<br />
Milwaukee $92 $14 $55 $46 $115 $27 $235 $388<br />
Philadelphia $299 $41 $171 $139 $351 $86 $736 $472<br />
Seattle $21 $7 $26 $23 $56 $12 $89 $144<br />
Total $1,401 $217 $885 $786 $1,839 $439 $3,679 $320 (ave)<br />
*<strong>The</strong> criminal justice system cost estimates presented here are distributed among federal, state, and local governments based on national data on the distribution <strong>of</strong> those costs, as reported by the<br />
Bureau <strong>of</strong> Justice Statistics, and the incidence <strong>of</strong> violent crime in each jurisdiction. <strong>The</strong> actual costs borne by each <strong>of</strong> our eight cities may differ from those presented here based on how those costs are<br />
distributed between state and local governments.<br />
Source: Authors’ calculations. <strong>The</strong> estimates <strong>of</strong> justice system costs by level <strong>of</strong> government are based on data from the Bureau <strong>of</strong> Justice Statistics.<br />
While Table 9 includes the total law en<strong>for</strong>cement and justice system costs <strong>for</strong><br />
violent crimes at each level <strong>of</strong> government, we also disaggregate those costs into<br />
three components: police protection, the judicial system, and corrections. <strong>The</strong>se<br />
data show that correctional-system operations account <strong>for</strong> nearly 72 percent <strong>of</strong> the<br />
total costs, ranging from $38 million per year <strong>for</strong> Seattle to $397 million per year<br />
<strong>for</strong> Chicago. Of the remaining justice-system expenditures, police operations <strong>for</strong><br />
the eight cities account <strong>for</strong> an average <strong>of</strong> about 19 percent, and the judicial system<br />
accounts <strong>for</strong> the remaining 9 percent. (see Table 10)<br />
<strong>The</strong> annual intangible or indirect costs per resident <strong>for</strong> the pain and suffering <strong>of</strong><br />
the victims <strong>of</strong> violent crimes, on average, are nearly four times greater than the<br />
annual direct costs <strong>of</strong> those crimes per resident. <strong>The</strong>se intangible costs <strong>for</strong> the<br />
eight cities total nearly $14 billion per year, ranging from $216 million per year in<br />
Seattle to $4.2 billion per year in Chicago. On a per-resident basis, these annual<br />
intangible costs average $1,202 per crime and range from an estimated $350 <strong>for</strong><br />
Seattle to $1,905 <strong>for</strong> Philadelphia.<br />
<strong>The</strong> large differences among the eight cities in both intangible and direct costs per<br />
resident reflect differences in both total violent crime rates and the rates <strong>of</strong> different<br />
types <strong>of</strong> violent crime. In particular, there are significant differences in murder<br />
32 <strong>Center</strong> <strong>for</strong> American Progress | <strong>The</strong> <strong>Economic</strong> <strong>Benefits</strong> <strong>of</strong> <strong>Reducing</strong> <strong>Violent</strong> <strong>Crime</strong>
TABLE 10<br />
<strong>The</strong> costs <strong>of</strong> protecting against violent crime<br />
Law en<strong>for</strong>cement and justice system expenditures on violent crimes, by city, 2010 ($ millions)<br />
City Police protection Judicial system Corrections Total<br />
Boston $21 $10 $71 $102<br />
Chicago $101 $49 $397 $547<br />
Dallas $31 $15 $129 $175<br />
Houston $80 $38 $275 $393<br />
Jacksonville $20 $10 $70 $100<br />
Milwaukee $22 $11 $83 $115<br />
Philadelphia $64 $31 $256 $351<br />
Seattle $13 $6 $38 $56<br />
Total $352 $170 $1,319 $1,839<br />
Source: Tracey Kyckelhahn, “Justice Expenditures and Employment, 1982-2007” (Washington: Bureau <strong>of</strong> Justice Statistics, 2011).<br />
TABLE 11<br />
<strong>The</strong> cost <strong>of</strong> violent crime per resident in eight U.S. cities<br />
Annual intangible costs <strong>of</strong> violent crimes, by city, total and per resident, direct costs per resident,<br />
and total costs per-resident, 2010<br />
City<br />
Intangible costs<br />
($ millions)<br />
Intangible costs<br />
per resident<br />
Direct costs,<br />
per resident<br />
Total costs<br />
per resident<br />
Boston $734 $1,142 $308 $1,447<br />
Chicago $4,206 $1,486 $390 $1,874<br />
Dallas $1,444 $1,106 $278 $1,383<br />
Houston $2,655 $1,165 $330 $1,494<br />
Jacksonville $802 $977 $246 $1,221<br />
Milwaukee $900 $1,486 $388 $1,873<br />
Philadelphia $2,970 $1,905 $472 $2,378<br />
Seattle $216 $350 $144 $492<br />
Total/Average $13,920 $1,202 $320 $1,520<br />
Source: Authors’ calculations.<br />
<strong>The</strong> cost <strong>of</strong> violent crimes <strong>for</strong> eight U.S. cities and the benefits and savings from reducing those crimes | www.americanprogress.org 33
ates across the eight cities, and the direct and indirect costs per resident are much<br />
higher <strong>for</strong> murders than <strong>for</strong> the other violent crimes. <strong>The</strong> total annual costs <strong>of</strong><br />
violent crimes per resident in the eight cities average $1,520, ranging from $492<br />
per resident per year in Seattle to $2,378 per resident per year in Philadelphia. (see<br />
Table 11 on previous page)<br />
Based on these cost calculations, a 10 percent reduction in violent crimes would<br />
generate estimated direct savings or benefits totaling $368 million per year <strong>for</strong><br />
all eight cities, ranging from $9 million per year <strong>for</strong> Seattle to $110 million <strong>for</strong><br />
Chicago. <strong>The</strong> total annual savings and benefits, direct and indirect, from a 10<br />
percent reduction in violent crime <strong>for</strong> all eight cities come to nearly $1.8 billion,<br />
ranging from $30 million in Seattle to $531 million in Chicago.<br />
A 25 percent reduction in violent crime in these eight cities would generate direct<br />
savings or benefits totaling $921 million per year, ranging from an estimated $22<br />
million in annual benefits in Seattle to $276 million in annual benefits <strong>for</strong> Chicago.<br />
A 25 percent reduction in violent crime would generate total benefits and savings,<br />
direct and indirect, <strong>of</strong> nearly $4.5 billion per year <strong>for</strong> all eight cities, ranging from<br />
$76 million in Seattle to more than $1.3 billion in Chicago. (see Table 12)<br />
TABLE 12<br />
Total costs <strong>of</strong> violent crime and total savings and benefits<br />
Annual direct and indirect costs <strong>of</strong> violent crimes and annual direct savings and total benefits from<br />
reducing those crimes by 10 percent and 25 percent, by city, 2010 ($ millions)<br />
City<br />
Costs 10% <strong>Crime</strong> Reduction 25% <strong>Crime</strong> Reduction<br />
Direct Intangible Total<br />
Direct<br />
Savings<br />
All <strong>Benefits</strong><br />
Direct<br />
Savings<br />
All <strong>Benefits</strong><br />
Boston $198 $734 $932 $20 $93 $50 $233<br />
Chicago $1,104 $4,206 $5,310 $110 $531 $276 $1,327<br />
Dallas $363 $1,444 $1,807 $36 $181 $91 $452<br />
Houston $752 $2,655 $3,407 $75 $341 $188 $852<br />
Jacksonville $202 $802 $1,004 $20 $100 $51 $251<br />
Milwaukee $235 $900 $1,135 $24 $114 $59 $284<br />
Philadelphia $736 $2,970 $3,705 $74 $371 $184 $926<br />
Seattle $89 $216 $305 $9 $30 $22 $76<br />
Total $3,679 $13,927 $17,605 $368 $1,761 $921 $4,481<br />
Source: FBI Uni<strong>for</strong>m <strong>Crime</strong> Reports (2010); McCollister et al (2010); authors’ calculations.<br />
34 <strong>Center</strong> <strong>for</strong> American Progress | <strong>The</strong> <strong>Economic</strong> <strong>Benefits</strong> <strong>of</strong> <strong>Reducing</strong> <strong>Violent</strong> <strong>Crime</strong>
<strong>The</strong>se estimates <strong>of</strong> the benefits <strong>of</strong> lower violent-crime rates are conservative<br />
because they do not include a range <strong>of</strong> secondary benefits associated with reduced<br />
crime. Cities known to be safer places <strong>of</strong>ten experience increased tourism, which<br />
can generate substantial gains <strong>for</strong> businesses located there and <strong>for</strong> city governments<br />
that collect revenues on those gains. As we have established, falling crime<br />
rates also are associated with higher residential and commercial property values,<br />
which enrich households and businesses and generate higher property tax revenues<br />
<strong>for</strong> city governments.<br />
In addition, falling crime rates generally result in lower insurance rates and payments,<br />
further supporting businesses and households. 48 Finally, falling violent<br />
crime rates can improve a city’s general economic and business environment, leading<br />
to higher overall levels <strong>of</strong> investment and population gains.<br />
Some <strong>of</strong> the direct savings from reducing violent crime will accrue directly to municipal<br />
budgets. To calculate the benefits <strong>for</strong> the budgets in the eight cities, we focus<br />
first on costs that come directly from those budgets. <strong>The</strong>se estimates are provided in<br />
Table 9 on page 32, using local law en<strong>for</strong>cement and justice-system costs. <strong>The</strong>se local<br />
budgetary costs <strong>for</strong> violent crimes come to $786 million per year <strong>for</strong> all eight cities,<br />
ranging from $23 million in Seattle to $218 million in Chicago. Once again, these<br />
estimates are conservative. <strong>The</strong>y are based on local law en<strong>for</strong>cement and justice system<br />
costs divided by violent crimes’ share <strong>of</strong> all crimes, when violent crimes usually<br />
claim a disproportionate share <strong>of</strong> such spending.<br />
<strong>The</strong> direct budgetary costs <strong>of</strong> violent crimes and corresponding budgetary benefits<br />
from reducing those crimes also include tax revenues on the income <strong>of</strong> victims<br />
who would have been able to work in the days following a crime and on <strong>for</strong>egone<br />
income by those convicted <strong>of</strong> violent crimes. To estimate the magnitude <strong>of</strong> these<br />
additional revenues from reducing violent crime, we analyzed U.S. Census Bureau<br />
data on the share <strong>of</strong> total household income that each city collects in local taxes.<br />
<strong>The</strong>se implicit tax rates average 4.3 percent and range from 3 percent in Dallas and<br />
Houston to 8.6 percent in Philadelphia.<br />
Next, we sum the <strong>for</strong>egone income <strong>of</strong> the victims <strong>of</strong> crimes and the criminals, using<br />
the methodology described earlier. This <strong>for</strong>egone income totals $1.84 billion per<br />
year <strong>for</strong> the eight cities, ranging from $33 million <strong>for</strong> Seattle to $557 million <strong>for</strong><br />
Chicago. We multiply this <strong>for</strong>egone income by the implicit tax rate <strong>for</strong> each city to<br />
<strong>The</strong> cost <strong>of</strong> violent crimes <strong>for</strong> eight U.S. cities and the benefits and savings from reducing those crimes | www.americanprogress.org 35
TABLE 13<br />
<strong>The</strong> municipal costs <strong>of</strong> violent crime<br />
Annual municipal revenue effects <strong>of</strong> violent crime from <strong>for</strong>egone income, by city, 2010 ($ millions)<br />
City<br />
Victim-<br />
Related Costs<br />
Criminal<br />
Productivity Costs<br />
Total Foregone<br />
Income<br />
Local Taxes as % <strong>of</strong><br />
Household Income<br />
Foregone Tax<br />
Revenues<br />
Boston $72 $24 $96 7.0% $7<br />
Chicago $426 $132 $557 3.3% $18<br />
Dallas $145 $43 $188 3.0% $6<br />
Houston $268 $91 $359 3.0% $11<br />
Jacksonville $78 $24 $103 4.0% $4<br />
Milwaukee $92 $27 $120 2.5% $3<br />
Philadelphia $299 $86 $385 8.6% $33<br />
Seattle $21 $12 $33 3.3% $1<br />
Total $1,401 $439 $1,841 4.3% (ave) $83<br />
Source: U.S. Census Bureau, Federal, State and Local Governments, Government Finances, U.S. Census Bureau, 2010 American Community Survey, and authors’ calculations.<br />
estimate the revenues <strong>for</strong>egone as a result <strong>of</strong> violent crime. 49 Our estimates <strong>of</strong> these<br />
<strong>for</strong>egone local revenues total $83 million per year <strong>for</strong> the eight cities, ranging from<br />
$1 million <strong>for</strong> Seattle to $33 million <strong>for</strong> Philadelphia. (see Table 13)<br />
<strong>The</strong> total municipal budgetary effects from reducing violent crime in the eight<br />
cities by 10 percent and 25 percent are calculated by summing those <strong>for</strong>egone<br />
revenues and the budgetary savings from lower local police, judicial, and correctional<br />
system spending. <strong>The</strong> municipal budget savings from a 10 percent reduction<br />
in violent crimes total $82 million per year <strong>for</strong> the eight cities, ranging from $2<br />
million per year in Seattle to $24 million per year in Chicago. <strong>The</strong> local budget savings<br />
from a 25 percent reduction in violent crime total $205 million per year <strong>for</strong><br />
all eight cities, ranging from $6 million per year in Seattle to $59 million per year<br />
in Chicago. (see Table 14)<br />
36 <strong>Center</strong> <strong>for</strong> American Progress | <strong>The</strong> <strong>Economic</strong> <strong>Benefits</strong> <strong>of</strong> <strong>Reducing</strong> <strong>Violent</strong> <strong>Crime</strong>
TABLE 14<br />
Annual municipal cost and savings from reducing violent crime<br />
Local budgetary costs <strong>of</strong> violent crime and local budgetary savings from 10 percent and 25 percent<br />
reductions in those crimes, by city, 2010 ($ millions)<br />
City<br />
Foregone Tax<br />
Revenues<br />
Police & Justice<br />
System Spending<br />
Total Revenue &<br />
Spending Costs<br />
Saving: 10%<br />
Reduction in<br />
<strong>Violent</strong> <strong>Crime</strong><br />
Saving: 25%<br />
Reduction in<br />
<strong>Violent</strong> <strong>Crime</strong><br />
Boston $7 $42 $49 $5 $12<br />
Chicago $18 $218 $236 $24 $59<br />
Dallas $6 $69 $75 $8 $19<br />
Houston $11 $159 $170 $17 $43<br />
Jacksonville $4 $40 $44 $4 $11<br />
Milwaukee $3 $46 $49 $5 $12<br />
Philadelphia $33 $139 $172 $17 $43<br />
Seattle $1 $23 $24 $2 $6<br />
Total $83 $736 $819 $82 $205<br />
Source: Authors’ calculations.<br />
<strong>The</strong> cost <strong>of</strong> violent crimes <strong>for</strong> eight U.S. cities and the benefits and savings from reducing those crimes | www.americanprogress.org 37
Alternative uses <strong>of</strong> the municipal<br />
savings from reducing violent crime<br />
Finally, we present in graphical <strong>for</strong>m alternative uses <strong>of</strong> the direct annual budget<br />
savings from reducing violent crime in each <strong>of</strong> the eight cities by 25 percent, as<br />
well as our earlier findings on the annual direct costs <strong>of</strong> those crimes to local budgets<br />
and examples <strong>of</strong> what the annual savings from the reductions in those crimes<br />
could be used <strong>for</strong> at the city level. (see next page)<br />
As noted earlier, our criminal justice system cost estimates are distributed among<br />
federal, state, and local governments based on national data on the distribution <strong>of</strong><br />
those costs as reported by the Bureau <strong>of</strong> Justice Statistics. <strong>The</strong> actual costs borne<br />
by each <strong>of</strong> our eight cities may differ from those presented here based on how<br />
costs are distributed between state and local governments. Some <strong>of</strong> the projected<br />
savings presented here, there<strong>for</strong>e, would accrue to state governments as well as<br />
city governments. Here we attribute those estimated savings to the local level<br />
to illustrate the budgetary impact <strong>of</strong> achieving reductions in violent crime <strong>of</strong> 10<br />
percent or 25 percent.<br />
Alternative uses <strong>of</strong> the municipal savings from reducing violent crime | www.americanprogress.org 39
Boston<br />
In 2010 the Boston Police Department received reports <strong>of</strong> 73 murders, 256 rapes,<br />
1,926 robberies, and 3,564 aggravated assaults. Boston experienced twice as many<br />
violent crimes per capita as the nation as a whole and the second-highest rate <strong>of</strong><br />
aggravated assaults <strong>of</strong> the eight cities. <strong>The</strong>se violent crimes cost the city $198 million<br />
in 2010 or $308 per resident.<br />
A 25 percent reduction in these violent crimes would generate an estimated $12.1<br />
million in annual savings <strong>for</strong> the Boston city budget, including $10 million in local<br />
justice-system savings and $2 million in additional tax revenue. <strong>The</strong>se extra savings<br />
would be enough <strong>for</strong> the city to consider a mix <strong>of</strong> boosting city spending on<br />
housing and community development by up to 14.4 percent or reducing property<br />
taxes by up to nearly 1 percent. (see Figure 2)<br />
FIGURE 2<br />
How Boston benefits from reducing violent crime<br />
<strong>The</strong> costs and potential budget savings ($ millions)<br />
Costs <strong>of</strong> <strong>Violent</strong> <strong>Crime</strong> ($ Millions)<br />
Direct Local Costs ($ Millions)<br />
Potential Budget Savings ($ Millions)<br />
Victim<br />
Justice system<br />
Productivity<br />
(criminal)<br />
$72<br />
$102<br />
$24<br />
Local justice system<br />
Reduced tax<br />
revenue<br />
Total<br />
$42<br />
$7<br />
$49<br />
10 percent reduction<br />
in violent crime<br />
25 percent reduction<br />
in violent crime<br />
$5<br />
$12<br />
Indirect<br />
Total<br />
$734<br />
$932<br />
Alternate uses <strong>of</strong> $12 million budget savings:<br />
• Reduce property taxes by 1 percent<br />
• Increase spending on housing and community<br />
development by 14%<br />
Direct costs per resident: $308<br />
Total costs per resident: $1,447<br />
Source: Authors’ calculations.<br />
40 <strong>Center</strong> <strong>for</strong> American Progress | <strong>The</strong> <strong>Economic</strong> <strong>Benefits</strong> <strong>of</strong> <strong>Reducing</strong> <strong>Violent</strong> <strong>Crime</strong>
Chicago<br />
In 2010 Chicago had a reported 432 murders, 1,262 rapes, 14,213 robberies, and<br />
13,757 aggravated assaults <strong>for</strong> a total <strong>of</strong> 29,664 violent crimes. <strong>The</strong> city’s violentcrime<br />
rate was more than 2.5 times the national average and these crimes cost the<br />
city more than $1.1 billion in 2010, or nearly $400 per resident.<br />
A 25 percent reduction in violent crime in Chicago would generate an estimated<br />
$59 million in direct cost savings to the Chicago city budget, including $54 million<br />
in law en<strong>for</strong>cement and justice-system savings and $5 million in increased<br />
revenues. <strong>The</strong>se savings would enable Chicago to consider a mix <strong>of</strong> reducing all<br />
local taxes by up to 2.5 percent or increasing city spending on community services<br />
by up to 66 percent. (see Figure 3)<br />
FIGURE 3<br />
How Chicago benefits from reducing violent crime<br />
<strong>The</strong> costs and potential budget savings ($ millions)<br />
Costs <strong>of</strong> <strong>Violent</strong> <strong>Crime</strong> ($ Millions)<br />
Direct Local Costs ($ Millions)<br />
Potential Budget Savings ($ Millions)<br />
Victim<br />
Justice system<br />
Productivity<br />
(criminal)<br />
$426<br />
$547<br />
$132<br />
Local justice system<br />
Reduced tax<br />
revenue<br />
Total<br />
$218<br />
$18<br />
$236<br />
10 percent reduction<br />
in violent crime<br />
25 percent reduction<br />
in violent crime<br />
$24<br />
$59<br />
Indirect<br />
Total<br />
$4,206<br />
$5,310<br />
Alternate uses <strong>of</strong> $59 million budget savings:<br />
• Reduce local taxes by 2.5%<br />
• Increase spending on community services by 66%<br />
Direct costs per resident: $390<br />
Total costs per resident: $1,874<br />
Source: Authors’ calculations.<br />
Alternative uses <strong>of</strong> the municipal savings from reducing violent crime | www.americanprogress.org 41
Dallas<br />
Dallas law en<strong>for</strong>cement received reports <strong>of</strong> 148 murders, 505 rapes, 4,487 robberies,<br />
and 4,021 aggravated assaults in 2010 <strong>for</strong> a total <strong>of</strong> 9,161 violent crimes. While<br />
Dallas was one <strong>of</strong> the safer cities in our sample <strong>of</strong> cities, it nevertheless sustained<br />
an estimated $363 million in direct costs from violent crimes, equivalent to $278<br />
per resident.<br />
<strong>Reducing</strong> violent crime in Dallas by 25 percent would generate $18.7 million <strong>for</strong><br />
the Dallas city budget, including $17.2 million in law en<strong>for</strong>cement and justicesystem<br />
savings and $1.4 million in increased revenues. <strong>The</strong>se savings would enable<br />
Dallas to consider a mix <strong>of</strong> reducing property taxes by up to 4.3 percent or increasing<br />
the parks and recreation budget by up to 29 percent. (see Figure 4)<br />
FIGURE 4<br />
How Dallas benefits from reducing violent crime<br />
<strong>The</strong> costs and potential budget savings ($ millions)<br />
Costs <strong>of</strong> <strong>Violent</strong> <strong>Crime</strong> ($ Millions)<br />
Direct Local Costs ($ Millions)<br />
Potential Budget Savings ($ Millions)<br />
Victim<br />
Justice system<br />
Productivity<br />
(criminal)<br />
$145<br />
$175<br />
$43<br />
Local justice system<br />
Reduced tax<br />
revenue<br />
Total<br />
$69<br />
$6<br />
$75<br />
10 percent reduction<br />
in violent crime<br />
25 percent reduction<br />
in violent crime<br />
$7<br />
$19<br />
Indirect<br />
Total<br />
$1,444<br />
$1,807<br />
Alternate uses <strong>of</strong> $19 million budget savings:<br />
Reduce property taxes by 4%<br />
Increase the parks and recreation budget by 29%<br />
Direct costs per resident: $278<br />
Total costs per resident: $1,383<br />
Source: Authors’ calculations.<br />
42 <strong>Center</strong> <strong>for</strong> American Progress | <strong>The</strong> <strong>Economic</strong> <strong>Benefits</strong> <strong>of</strong> <strong>Reducing</strong> <strong>Violent</strong> <strong>Crime</strong>
Houston<br />
Houston law en<strong>for</strong>cement in 2010 received reports <strong>of</strong> 269 murders, 712 rapes,<br />
9,449 robberies, and 12,061 aggravated assaults, a total <strong>of</strong> 22,491 violent crimes.<br />
While these crimes represented less than 3 percent <strong>of</strong> all arrests in Houston that<br />
year, they cost the city $752 million or $330 per resident.<br />
A 25 percent reduction in violent crime would generate $43 million in savings <strong>for</strong><br />
the Houston city budget, including $40 million in law en<strong>for</strong>cement and justicesystem<br />
savings and $3 million in tax revenues. <strong>The</strong>se savings could enable the city<br />
to consider a mix <strong>of</strong> doubling city spending on health and human services or cutting<br />
property taxes by 5 percent. (see Figure 5)<br />
FIGURE 5<br />
How Houston benefits from reducing violent crime<br />
<strong>The</strong> costs and potential budget savings ($ millions)<br />
Costs <strong>of</strong> <strong>Violent</strong> <strong>Crime</strong> ($ Millions)<br />
Direct Local Costs ($ Millions)<br />
Potential Budget Savings ($ Millions)<br />
Victim<br />
Justice system<br />
Productivity<br />
(criminal)<br />
$268<br />
$393<br />
$91<br />
Local justice system<br />
Reduced tax<br />
revenue<br />
Total<br />
$159<br />
$11<br />
$170<br />
10 percent reduction<br />
in violent crime<br />
25 percent reduction<br />
in violent crime<br />
$17<br />
$43<br />
Indirect<br />
Total<br />
$2,655<br />
$3,407<br />
Alternate uses <strong>of</strong> $43 million budget savings:<br />
Reduce property taxes by 5%<br />
Double local spending on health and human services<br />
Direct costs per resident: $330<br />
Total costs per resident: $1,494<br />
Source: Authors’ calculations.<br />
Alternative uses <strong>of</strong> the municipal savings from reducing violent crime | www.americanprogress.org 43
Jacksonville<br />
<strong>The</strong> Jacksonville Police Department received reports <strong>of</strong> 80 murders, 316 rapes,<br />
1,693 robberies, and 3,380 aggravated assaults in 2010, a total <strong>of</strong> 5,469 violent<br />
crimes. Jacksonville was the second safest <strong>of</strong> the eight cities based on violent<br />
crimes per capita. Nevertheless, these crimes cost Jacksonville and its citizens<br />
more than $200 million in 2010 or $246 per resident.<br />
A 25 percent reduction in these violent crimes would generate an estimated $11.1<br />
million in city budget savings, which would enable Jacksonville to consider a mix<br />
<strong>of</strong> cutting its property taxes by up to 2 percent or increasing local spending on<br />
economic development by up to 26 percent. (see Figure 6)<br />
FIGURE 6<br />
How Jacksonville benefits from reducing violent crime<br />
<strong>The</strong> costs and potential budget savings ($ millions)<br />
Costs <strong>of</strong> <strong>Violent</strong> <strong>Crime</strong> ($ Millions)<br />
Direct Local Costs ($ Millions)<br />
Potential Budget Savings ($ Millions)<br />
Victim<br />
Justice system<br />
Productivity<br />
(criminal)<br />
$78<br />
$100<br />
$24<br />
Local justice system<br />
Reduced tax<br />
revenue<br />
Total<br />
$40<br />
$4<br />
$45<br />
10 percent reduction<br />
in violent crime<br />
25 percent reduction<br />
in violent crime<br />
$4<br />
$11<br />
Indirect<br />
Total<br />
$802<br />
$1,004<br />
Alternate uses <strong>of</strong> $11 million budget savings:<br />
Reduce property taxes by 2%<br />
Increase local spending on economic development by 26%<br />
Direct costs per resident: $246<br />
Total costs per resident: $1,221<br />
Source: Authors’ calculations.<br />
44 <strong>Center</strong> <strong>for</strong> American Progress | <strong>The</strong> <strong>Economic</strong> <strong>Benefits</strong> <strong>of</strong> <strong>Reducing</strong> <strong>Violent</strong> <strong>Crime</strong>
Milwaukee<br />
In 2010 Milwaukee law en<strong>for</strong>cement received reports <strong>of</strong> 94 murders, 197 rapes,<br />
2,932 robberies, and 3,106 aggravated assaults, a total <strong>of</strong> 6,329 violent crimes.<br />
Milwaukee has one <strong>of</strong> the highest rates <strong>of</strong> violent crime <strong>of</strong> the eight cities, with<br />
more than one reported violent crime <strong>for</strong> every 100 residents. Even though violent<br />
crimes accounted <strong>for</strong> less than 4 percent <strong>of</strong> all arrests in Milwaukee, they cost<br />
the city $235 million or $388 per resident.<br />
If Milwaukee reduced violent crime by 25 percent, the city government would<br />
save $12.3 million, which could enable the city to consider a mix <strong>of</strong> cutting property<br />
taxes by up to 4 percent or increasing spending on housing and community<br />
development by up to 71 percent. (see Figure 7)<br />
FIGURE 7<br />
How Milwaukee benefits from reducing violent crime<br />
<strong>The</strong> costs and potential budget savings ($ millions)<br />
Costs <strong>of</strong> <strong>Violent</strong> <strong>Crime</strong> ($ Millions)<br />
Direct Local Costs ($ Millions)<br />
Potential Budget Savings ($ Millions)<br />
Victim<br />
Justice system<br />
Productivity<br />
(criminal)<br />
$92<br />
$115<br />
$27<br />
Local justice system<br />
Reduced tax<br />
revenue<br />
Total<br />
$46<br />
$3<br />
$49<br />
10 percent reduction<br />
in violent crime<br />
25 percent reduction<br />
in violent crime<br />
$5<br />
$12<br />
Indirect<br />
Total<br />
$900<br />
$1,135<br />
Direct costs per resident: $388<br />
Total costs per resident: $1,873<br />
Alternate uses <strong>of</strong> $12 million budget savings:<br />
Reduce property taxes by 4 percent<br />
Increase spending on housing and community<br />
development by 71 percent<br />
Source: Authors’ calculations.<br />
Alternative uses <strong>of</strong> the municipal savings from reducing violent crime | www.americanprogress.org 45
Philadelphia<br />
Philadelphia law en<strong>for</strong>cement received reports in 2010 <strong>of</strong> 306 murders, 945 rapes,<br />
8,363 robberies, and 8,921 aggravated assaults, a total <strong>of</strong> 18,535 violent crimes.<br />
<strong>The</strong> violent-crime rate in Philadelphia is three times the national average. <strong>The</strong><br />
direct costs <strong>of</strong> these violent crimes in Philadelphia totaled $736 million in 2010 or<br />
$472 per resident.<br />
<strong>Reducing</strong> these crimes by 25 percent would generate $43 million <strong>for</strong> the<br />
Philadelphia city budget, including $35 million in law en<strong>for</strong>cement and justice<br />
system savings and $8 million in new revenues. This revenue would enable the<br />
city to consider a mix <strong>of</strong> a cut in local property taxes <strong>of</strong> up to 11 percent or up to a<br />
doubling <strong>of</strong> spending on homeless and housing assistance. (see Figure 8)<br />
FIGURE 8<br />
How Philadelphia benefits from reducing violent crime<br />
<strong>The</strong> costs and potential budget savings ($ millions)<br />
Costs <strong>of</strong> <strong>Violent</strong> <strong>Crime</strong> ($ Millions)<br />
Direct Local Costs ($ Millions)<br />
Potential Budget Savings ($ Millions)<br />
Victim<br />
Justice system<br />
Productivity<br />
(criminal)<br />
$299<br />
$351<br />
$86<br />
Local justice system<br />
Reduced tax<br />
revenue<br />
Total<br />
$139<br />
$33<br />
$173<br />
10 percent reduction<br />
in violent crime<br />
25 percent reduction<br />
in violent crime<br />
$17<br />
$43<br />
Indirect<br />
Total<br />
$2,970<br />
$3,705<br />
Alternate uses <strong>of</strong> $43 million budget savings:<br />
Reduce property taxes by 11 percent<br />
Double spending on homeless and housing assistance<br />
Direct costs per resident: $472<br />
Total costs per resident: $2,378<br />
Source: Authors’ calculations.<br />
46 <strong>Center</strong> <strong>for</strong> American Progress | <strong>The</strong> <strong>Economic</strong> <strong>Benefits</strong> <strong>of</strong> <strong>Reducing</strong> <strong>Violent</strong> <strong>Crime</strong>
Seattle<br />
Seattle police in 2010 recorded 19 murders, 96 rapes, 1,429 robberies, and<br />
1,971 aggravated assaults. Seattle had the lowest crime rates <strong>of</strong> the eight cities.<br />
Nevertheless, violent crime cost Seattle $89 million in 2010 or $144 per resident.<br />
<strong>Reducing</strong> violent crime by 25 percent would produce savings <strong>for</strong> the Seattle city<br />
budget <strong>of</strong> $14.4 million, which could enable the city to consider a mix <strong>of</strong> up to a<br />
2.4 percent cut in property taxes or an increase in city spending on neighborhoods<br />
and development <strong>of</strong> up to 5.4 percent. (see Figure 9)<br />
FIGURE 9<br />
How Seattle benefits from reducing violent crime<br />
<strong>The</strong> costs and potential budget savings ($ millions)<br />
Costs <strong>of</strong> <strong>Violent</strong> <strong>Crime</strong> ($ Millions)<br />
Direct Local Costs ($ Millions)<br />
Potential Budget Savings ($ Millions)<br />
Victim<br />
Justice system<br />
Productivity<br />
(criminal)<br />
$21<br />
$56<br />
$12<br />
Local justice system<br />
Reduced tax<br />
revenue<br />
Total<br />
$23<br />
$1<br />
$24<br />
10 percent reduction<br />
in violent crime<br />
25 percent reduction<br />
in violent crime<br />
$2<br />
$6<br />
Indirect<br />
Total<br />
$216<br />
$305<br />
Direct costs per resident: $144<br />
Total costs per resident: $492<br />
Alternate uses <strong>of</strong> $6 million budget savings:<br />
Reduce property taxes by 2.4 percent<br />
Increase spending on communitydevelopment<br />
by 5.4 percent<br />
Source: Authors’ calculations.<br />
Alternative uses <strong>of</strong> the municipal savings from reducing violent crime | www.americanprogress.org 47
References<br />
Aos, Steve, Marna G. Miller, and Elizabeth K.<br />
Drake. 2009. “Evidence-Based Public Policy<br />
Options to Reduce <strong>Crime</strong> and Criminal Justice<br />
Costs: Implications in Washington State.”<br />
Victims and Offenders 4: 170–196.<br />
Arellano, Manuel, and Stephen Bond. 1991.<br />
“Some Tests <strong>of</strong> Specification <strong>for</strong> Panel Data:<br />
Monte Carlo Evidence and an Application to<br />
Employment Equations.” Review <strong>of</strong> <strong>Economic</strong><br />
Studies 58 (2): 277–297.<br />
Arellano, Manuel, and Olympia Bover. 1995.<br />
“Another look at the instrumental variable<br />
estimation <strong>of</strong> error-components models.”<br />
Journal <strong>of</strong> Econometrics 68 (1): 29–51.<br />
Arrow, Kenneth, and others. 1993. “Report <strong>of</strong><br />
the NOAA Panel on Contingent Valuation.”<br />
Federal Register 58: 4601–4614.<br />
Bun, Yeng. 2010. “U.S. Homes Set to Lose $1.7<br />
Trillion in Value During 2010.” Seattle: Zillow<br />
Real Estate Research.<br />
Cohen, Mark A. 1988. “Pain, Suffering, and Jury<br />
Awards: A Study <strong>of</strong> the Cost <strong>of</strong> <strong>Crime</strong> to Victims.”<br />
Law & Society Review 22 (3): 537–556.<br />
Cohen, Mark A., and others. 2004. “Willingness-To-Pay<br />
<strong>for</strong> <strong>Crime</strong> Control Programs.”<br />
Criminology 42 (1): 89–101.<br />
Corso, Phaedra S., and others. 2007. “Medical<br />
Costs and Productivity Losses Due to Interpersonal<br />
and Self-Directed Violence in the<br />
United States.” American Journal <strong>of</strong> Preventative<br />
Medicine 32 (6): 474–482.<br />
Council <strong>of</strong> <strong>Economic</strong> Advisers. 2011. “<strong>The</strong> <strong>Economic</strong><br />
Impact <strong>of</strong> the American Recovery and<br />
Reinvestment Act <strong>of</strong> 2009.” Washington.<br />
Cullen, Julie Berry, and Steven D. Levitt. 1999.<br />
“<strong>Crime</strong>, Urban Flight, and the Consequences<br />
<strong>for</strong> Cities,” <strong>The</strong> Review <strong>of</strong> <strong>Economic</strong>s and Statistics<br />
81 (2): 159–169.<br />
Diamond, Peter A., and Jerry A. Hausman.<br />
1994. “Contingent Valuation: Is Some Number<br />
better than No Number?” <strong>The</strong> Journal <strong>of</strong><br />
<strong>Economic</strong> Perspectives 8 (4): 45–64.<br />
Doleac, Jennifer L. 2012. “<strong>The</strong> Effects <strong>of</strong> DNA<br />
Databases on <strong>Crime</strong>.” Stan<strong>for</strong>d, CA: Stan<strong>for</strong>d<br />
University.<br />
Donohue, John J. III. 1998. “Understanding the<br />
Time Path <strong>of</strong> <strong>Crime</strong>.” Journal <strong>of</strong> Criminal Law<br />
and Criminology 88 (4): 1423–1451.<br />
Durose, Matthew R., and Patrick A. Langan.<br />
2004. Felony Sentences in State Courts,<br />
2002. Bureau <strong>of</strong> Justice Statistics.<br />
Edgerton, Jesse, Andrew F. Haughwout, and Rae<br />
Rosen. 2004. “Revenue Implications <strong>of</strong> New<br />
York City’s Tax System.” Current Issues in <strong>Economic</strong>s<br />
and Finance: Second District Highlights<br />
10 (4): 1–7.<br />
Greenwood, Peter W., and others. 1998.<br />
“Diverting Children from a Life <strong>of</strong> <strong>Crime</strong>:<br />
Measuring Costs and <strong>Benefits</strong>.” Arlington,<br />
VA: RAND Corporation.<br />
Guerino, Paul, Paige M. Harrison, and William<br />
J. Sabol. 2011. “Prisoners in 2010.” Washington:<br />
Bureau <strong>of</strong> Justice Statistics.<br />
Hermann, Peter. 2012. “Baltimore murder<br />
victims, suspects share ties to criminal justice<br />
system.” <strong>The</strong> Baltimore Sun. January 2.<br />
Ihlanfeldt, Keith, and Tom Mayock. 2010.<br />
“Panel Data Estimates <strong>of</strong> the Effects <strong>of</strong> Different<br />
Types <strong>of</strong> <strong>Crime</strong> on Housing Prices.”<br />
Regional Science and Urban <strong>Economic</strong>s 40<br />
(2–3): 161–172.<br />
Isoni, Andrea, Graham Loomes, and Robert<br />
Sugden. 2011. “<strong>The</strong> Willingness to Pay—<br />
Willingness to Accept Gap, the ‘Endowment<br />
Effect,’ Subject Misconceptions, and<br />
Experimental Procedures <strong>for</strong> Eliciting Valuations,”<br />
American <strong>Economic</strong> Review 101 (2):<br />
991–1011.<br />
James, Doris J. 2004. “Pr<strong>of</strong>ile <strong>of</strong> Jail Inmates,<br />
2002.” Washington: Bureau <strong>of</strong> Justice Statistics.<br />
Kyckelhahn, Tracey. 2011. “Justice Expenditures<br />
and Employment, FY 1982-2007 – Statistical<br />
Tables.” Washington: Bureau <strong>of</strong> Justice<br />
Statistics.<br />
48 <strong>Center</strong> <strong>for</strong> American Progress | <strong>The</strong> <strong>Economic</strong> <strong>Benefits</strong> <strong>of</strong> <strong>Reducing</strong> <strong>Violent</strong> <strong>Crime</strong>
Lemaire, Jean. 2005. “<strong>The</strong> Cost <strong>of</strong> Firearm<br />
Deaths in the United States: Reduced Life<br />
Expectancies and Increased Insurance Costs.”<br />
<strong>The</strong> Journal <strong>of</strong> Risk and Insurance 72 (3):<br />
359–374.<br />
Levitt, Steven D. 2004. “Understanding Why<br />
<strong>Crime</strong> Fell in the 1990s: Four Factors that<br />
Explain the Decline and Six that Do Not.”<br />
Journal <strong>of</strong> <strong>Economic</strong> Perspectives 18 (1):<br />
163–190.<br />
Levitt, Steven D. 1999. “<strong>The</strong> Limited Role <strong>of</strong><br />
Changing Age Structure in Explaining Aggregate<br />
<strong>Crime</strong> Rates.” Criminology 37 (3):<br />
581–598.<br />
LRP Publications. 2004. “Jury Verdict Research:<br />
Personal Injury Case Evaluation Service.”<br />
Ludwig, Jens, and Philip J. Cook. 2001.<br />
“<strong>The</strong> <strong>Benefits</strong> <strong>of</strong> <strong>Reducing</strong> Gun Violence:<br />
Evidence from Contigent-Valuation Survey<br />
Data.” <strong>The</strong> Journal <strong>of</strong> Risk and Uncertainty 22<br />
(3): 207–226.<br />
McCollister, Kathryn E., Michael T. French, and<br />
Hai Fang. 2010. “<strong>The</strong> Cost <strong>of</strong> <strong>Crime</strong> to Society:<br />
New <strong>Crime</strong>-Specific Estimates <strong>for</strong> Policy<br />
and Program Evaluation.” Drug and Alcohol<br />
Dependence 108 (1–2): 98–109.<br />
Miller, Ted R., Mark A. Cohen, and Brian<br />
Wiersema. 1996. “Victim Costs and Consequences:<br />
A New Look.” Washington:<br />
National Institute <strong>of</strong> Justice.<br />
Murphy, James J., and others. 2005. “A Metaanalysis<br />
<strong>of</strong> Hypothetical Bias in Stated Preference<br />
Valuation.” Environmental & Resource<br />
<strong>Economic</strong>s 30 (3): 313–325.<br />
National Institute <strong>of</strong> Justice. 1998. Preventing<br />
<strong>Crime</strong>: What Works, What Doesn’t, What’s<br />
Promising. U.S. Department <strong>of</strong> Justice.<br />
Nuckols, Ben. 2010. “Homicides in violent<br />
Baltimore hit 25-year low.” Associated Press.<br />
December 30.<br />
Porter, Michael E. 1995. “<strong>The</strong> Competitive Advantage<br />
<strong>of</strong> the Inner City.” Harvard Business<br />
Review 73 (3): 55–72.<br />
Porter, Michael E. 1997. “New Strategies <strong>for</strong> Inner-City<br />
<strong>Economic</strong> Development.” <strong>Economic</strong><br />
Development Quarterly 11 (1): 11–27.<br />
Przybylski, Roger. 2008. “What Works: Effective<br />
Recidivism Reduction and Risk-Focused<br />
Prevention Programs.” Bensalem, PA: RKC<br />
Group.<br />
Reckdahl, Katy. 2012. “NOPD release <strong>of</strong> murder<br />
victims’ criminal records is challenged.”<br />
<strong>The</strong> Times-Picayune. January 1.<br />
Rokaw, W. M., J. A. Mercy, and J. C. Smith.<br />
1990. “Comparing death certificate data with<br />
FBI crime reporting statistics on U.S. homicides.”<br />
Public Health 105 (5): 447–455.<br />
Roodman, David. 2006. “How to Do xtabond2:<br />
An Introduction to ‘Difference’ and ‘System’<br />
GMM in Stata.” Working Paper 103. <strong>Center</strong><br />
<strong>for</strong> Global Development.<br />
Rosenmerkel, Sean, and Donald Farole. 2009.<br />
“Felony Sentences in State Courts, 2006,<br />
Statistical Tables.” Washington: Bureau <strong>of</strong><br />
Justice Statistics.<br />
Shenk, J. Frederick, and Patsy A. Klaus. 1984.<br />
“<strong>The</strong> <strong>Economic</strong> Cost <strong>of</strong> <strong>Crime</strong>s to Victims.”<br />
Washington: Bureau <strong>of</strong> Justice Statistics.<br />
Thaler, Richard. 1978. “A note on the value <strong>of</strong><br />
crime control: Evidence from the property<br />
market.” Journal <strong>of</strong> Urban <strong>Economic</strong>s 5 (1):<br />
137–145.<br />
Tucker, Neely. 2004. “Most D.C. Homicide<br />
Victims Had Arrests; Analysis Highlights<br />
‘Criminal Subculture.” <strong>The</strong> Washington Post.<br />
February 15.<br />
United Nations Office on Drugs and <strong>Crime</strong>.<br />
2012. “UNODC Homicide Statistics”<br />
(http://www.unodc.org/unodc/en/dataand-analysis/homicide.html).<br />
U.S. Bureau <strong>of</strong> Labor Statistics. 2012. Consumer<br />
Price Index History Table. Department <strong>of</strong> Labor<br />
(ftp://ftp.bls.gov/pub/special.requests/<br />
cpi/cpiai.txt).<br />
References | www.americanprogress.org 49
U.S. Census Bureau. 2010. American Community<br />
Survey. Department <strong>of</strong> Commerce (http://<br />
www.census.gov/acs/www/).<br />
U.S. Department <strong>of</strong> Justice, 2006-2010. National<br />
<strong>Crime</strong> Victimization Survey (http://bjs.ojp.<br />
usdoj.gov/index.cfm?ty=dcdetail&iid=245).<br />
U.S. Department <strong>of</strong> Justice. 2007. Criminal<br />
Victimization in the United States, 2006.<br />
U.S. Federal Bureau <strong>of</strong> Investigation. 2010.<br />
Uni<strong>for</strong>m <strong>Crime</strong> Reports.<br />
Welsh, Brandon C., and David P. Farrington.<br />
2012. “Science, politics, and crime prevention:<br />
Toward a new crime policy.” Journal <strong>of</strong><br />
Criminal Justice 40 (2): 128–133.<br />
White, P. 1995. “Homicide.” In M. A. Walker,<br />
ed., Interpreting <strong>Crime</strong> Statistics. Ox<strong>for</strong>d:<br />
Ox<strong>for</strong>d University Press.<br />
Windmeijer, Frank. 2005. “A finite sample<br />
correction <strong>for</strong> the variance <strong>of</strong> linear efficient<br />
two-step GMM estimators.” Journal <strong>of</strong> Econometrics<br />
126 (1): 25–51..<br />
Well<strong>for</strong>d, Charles, Brenda J. Bond, and Sean<br />
Goodison. 2011. “<strong>Crime</strong> in New Orleans:<br />
Analyzing <strong>Crime</strong> Trends and New Orleans’<br />
Responses to <strong>Crime</strong>.” Washington: Bureau <strong>of</strong><br />
Justice Assistance.<br />
50 <strong>Center</strong> <strong>for</strong> American Progress | <strong>The</strong> <strong>Economic</strong> <strong>Benefits</strong> <strong>of</strong> <strong>Reducing</strong> <strong>Violent</strong> <strong>Crime</strong>
Appendix A<br />
Methodology to test the impact <strong>of</strong> changes in violent crime rates<br />
on housing values<br />
To isolate any causal relationship between violent crimes and property prices, we<br />
use the Granger causality test, a widely employed statistical regression method<br />
developed by Nobel Laureate Clive Granger. Granger’s key insight in developing<br />
this method is that time series data on two related variables allow one to test <strong>for</strong> a<br />
statistical causal relationship between those data. Stated in technical terms, recursive<br />
substitution <strong>of</strong> a dynamic system can reduce it to a bivariate system, so long as<br />
the data include many lags <strong>of</strong> the dependent variable in the regression. Using this<br />
method, a time series X can be said to Granger-cause a time series Y if the lagged<br />
values <strong>of</strong> X provide statistically significant in<strong>for</strong>mation about future values <strong>of</strong> Y in<br />
a regression that also includes lagged values <strong>of</strong> Y as independent variables. 50<br />
<strong>The</strong> main regression equation <strong>for</strong> this analysis is:<br />
Δ (log(Median Residential Property Prices it<br />
)) = β 1<br />
• Δ (log(Median<br />
Residential Property Prices i(t-1)<br />
)) + β 2<br />
• Δ(Homicides (t-1)<br />
) + β 3<br />
•<br />
Δ(NonHomicides i(t-1)<br />
) + γ t<br />
+ Δ ε it<br />
<strong>The</strong> dependent variable is the log differences <strong>of</strong> residential property price <strong>for</strong> geographic<br />
area i at time t: Δ (log(Median Residential Property Prices it<br />
). <strong>The</strong> independent<br />
variables are the lagged value <strong>of</strong> the dependent variable and the lagged values<br />
<strong>of</strong> Δ(log(Homicides i t<br />
)) and Δ(log(NonHomicides i(t<br />
)), the differenced number <strong>of</strong><br />
homicides and nonhomicide violent crimes. Time-specific fixed effects are captured<br />
by γ t<br />
, although they are dropped in the table. 51 (See Table A-1 on next page)<br />
Appendix A | www.americanprogress.org 51
Table A-1<br />
Summary Statistics at Zip Code or Census Tract Level<br />
BOSTON, 2006-2007 (40 Observations)<br />
Variable Mean Std. dev. Min Max<br />
Homicide 2.68 4.54 0 19<br />
Nonhomicide 269.80 240.34 11 916<br />
Rapes 9.75 9.15 0 33<br />
Aggravated assault 165.85 158.04 11 583<br />
Robbery 94.20 76.60 0 300<br />
Median property value $499,611 $387,261 $235,000 $2,600,000<br />
Mean property value $601,214 $428,991 $246,995 $2,600,000<br />
CHICAGO, 2001-2010 (560 Observations)<br />
Variable Mean Std. dev. Min Max<br />
Homicide 9.07 10.61 0 44<br />
Nonhomicide 646.92 602.39 12 2322<br />
Rapes 31.23 28.47 0 124<br />
Aggravated assault 326.32 331.73 4 1438<br />
Robbery 289.38 251.11 5 1010<br />
Median property value $220,117 $92,541 $57,500 $647,500<br />
Mean property value $250,919 $110,998 $71,676 $796,811<br />
HOUSTON, 2000-2008 (868 Observations)<br />
Variable Mean Std. dev. Min Max<br />
Homicide 3.06 3.46 0 26<br />
Nonhomicide 242.98 222.98 1 1365<br />
Rapes 8.47 7.94 0 50<br />
Aggravated assault 125.38 115.58 0 567<br />
Robbery 109.13 110.42 0 823<br />
Median property value $148,797 $86,220 $43,146 $745,520<br />
Mean property value $171,216 $111,823 $48,838 $788,328<br />
52 <strong>Center</strong> <strong>for</strong> American Progress | <strong>The</strong> <strong>Economic</strong> <strong>Benefits</strong> <strong>of</strong> <strong>Reducing</strong> <strong>Violent</strong> <strong>Crime</strong>
JACKSONVILLE, 2001-2011 (308 Observations)<br />
Variable Mean Std. dev. Min Max<br />
Homicide 3.23 3.92 0 25<br />
Nonhomicide 193.35 179.27 9 930<br />
Rapes 7.39 6.13 0 36<br />
Aggravated assault 108.81 111.32 4 607<br />
Robbery 77.16 67.76 0 322<br />
Median property value $133,501 $52,386 $40,000 $334,900<br />
Mean property value $153,938 $59,816 $50,752 $316,542<br />
MILWAUKEE, 2005-2010 (166 Observations)<br />
Variable Mean Std. dev. Min Max<br />
Homicide 3.31 4.79 0 31<br />
Nonhomicide 233.11 245.09 1 981<br />
Rapes 6.80 7.29 0 25<br />
Aggravated assault 108.39 121.87 0 569<br />
Robbery 117.93 119.90 0 425<br />
Median property value $135,271 $51,099 $38,000 $291,750<br />
Mean property value $153,577 $84,798 $57,368 $864,970<br />
PHILADELPHIA, 2004-2009 (276 Observations)<br />
Variable Mean Std. dev. Min Max<br />
Homicide 10.74 9.93 0 54<br />
Nonhomicide 494.01 434.01 12 2207<br />
Rapes 22.92 20.69 0 110<br />
Aggravated assault 233.83 206.70 6 1045<br />
Robbery 237.26 208.10 5 1052<br />
Median property value $154,846 $97,884 $35,900 $450,000<br />
Mean property value $179,738 $128,137 $41,855 $740,840<br />
SEATTLE, 2000-2007 (976 Observations)<br />
Variable Mean Std. dev. Min Max<br />
Homicide 0.23 0.60 0 6<br />
Nonhomicide 32.32 40.02 0 390<br />
Rapes 1.09 1.56 0 13<br />
Aggravated assault 18.32 21.96 0 196<br />
Robbery 12.90 17.99 0 181<br />
Median property value $339,846 $126,941 $129,840 $1,100,000<br />
Mean property value $376,827 $157,568 $131,110 $1,271,009<br />
Source: Authors’ calculations.<br />
Appendix A | www.americanprogress.org 53
TABLE A-2<br />
Results <strong>of</strong> Granger causality regression analysis<br />
Specification 1 48 Specification 2 49<br />
Variables Δ(log(MedProp it<br />
)) Δ(log(MedProp it<br />
))<br />
Δ(log(MedProp i(t-1)<br />
))<br />
0.737***<br />
(0.0947)<br />
ΔHomicides (t-1)<br />
-0.0160**<br />
(0.00650)<br />
ΔNonHomicidesi (t-1)<br />
0.000446***<br />
(0.000167)<br />
0.649***<br />
(0.113)<br />
-0.0168**<br />
(0.00673)<br />
0.000766***<br />
(0.000179)<br />
Observations 2,739 2,740<br />
Number <strong>of</strong> geographic areas 396 396<br />
Number <strong>of</strong> instruments 35 31<br />
AR(1) 0 0<br />
AR(2) 0.222 0.253<br />
Hansen 0.214 0<br />
Source: Authors’ calculations.<br />
** p < 0.05; *** p < 0.01; Standard errors in parentheses<br />
<strong>The</strong> results <strong>for</strong> Specification 1 are derived from data <strong>for</strong> Chicago, Jacksonville,<br />
Houston, Milwaukee and Philadelphia. We excluded the data from Boston from<br />
our main regression specification because Boston could only provide two years <strong>of</strong><br />
crime data by zip code. We also excluded data from Seattle from the initial regression<br />
because Seattle could only provide crime data by census tract. Census tracts<br />
cover smaller areas than zip codes, increasing the impact <strong>of</strong> changes in crime rates<br />
relative to the zip code-based analysis <strong>for</strong> the other cities. Specification 2, however,<br />
includes the crime and property value data from Boston and Seattle as well as the<br />
five original cities. <strong>The</strong>se results produce a small, statistically significant positive<br />
effect from reductions in nonhomicide crime rates. We do not consider those<br />
results to be as reliable, however, given the data constraints <strong>for</strong> Boston and Seattle.<br />
54 <strong>Center</strong> <strong>for</strong> American Progress | <strong>The</strong> <strong>Economic</strong> <strong>Benefits</strong> <strong>of</strong> <strong>Reducing</strong> <strong>Violent</strong> <strong>Crime</strong>
Appendix B<br />
Testing the robustness <strong>of</strong> the impact <strong>of</strong> violent crime<br />
on housing prices<br />
Robustness test 1: One lag and two lags <strong>of</strong> independent variables<br />
As the first check <strong>for</strong> the robustness <strong>of</strong> our results, we compare the results with<br />
one lag <strong>of</strong> the independent variables included to the results with two lags <strong>of</strong> the<br />
independent variables. Our main regression is listed again in column (1) <strong>of</strong> Table<br />
B-1. Column (2) includes a second lag <strong>of</strong> changes <strong>of</strong> median residential property<br />
prices, homicides, and nonhomicides. <strong>The</strong> magnitude <strong>of</strong> all coefficients increase<br />
under this specification, however their significance declines.<br />
Still, the Wald test shows joint statistical significance at the 10 percent level, and<br />
just above the 5 percent level, <strong>for</strong> homicides. Nonhomicides are less significant,<br />
but still so at the 10 percent level. We chose to only include one lag in our main<br />
specification since we have a short unbalanced panel and the overall sample size is<br />
degraded sharply with the inclusion <strong>of</strong> additional lags.<br />
Additionally, since we expect the second lag <strong>of</strong> differences is correlated with the<br />
third lag <strong>of</strong> levels, we can only include lags four deep and greater in our instrument<br />
matrix. Finally, with the second lags included, the AR(2) test <strong>for</strong> autocorrelation<br />
barely rejects the null hypothesis <strong>of</strong> no autocorrelation in levels under the two-lag<br />
specification. (see Table B-1)<br />
Appendix B | www.americanprogress.org 55
TABLE B-1<br />
Test <strong>of</strong> robustness–one lag and two lags <strong>of</strong> independent variables<br />
Specification 1 Specification 2 50<br />
Variables Δ(log(MedProp it<br />
)) Δ(log(MedProp it<br />
))<br />
Δ(log(MedProp i(t-1)<br />
))<br />
Δ(log(MedProp i(t-2)<br />
))<br />
Δ(Homicides i(t-1)<br />
)<br />
Δ(Homicides i(t-2)<br />
)<br />
Δ(NonHomicides i(t-1)<br />
)<br />
Δ(NonHomicides i(t-2)<br />
)<br />
0.737***<br />
(0.0947)<br />
-0.0152**<br />
(0.00684)<br />
0.000260<br />
(0.000192)<br />
1.0004***<br />
(0.218)<br />
-0.0632**<br />
(0.210)<br />
-0.0151*<br />
(0.0868)<br />
-0.0247**<br />
(0.0114)<br />
0.000235<br />
(0.000425)<br />
0.000820**<br />
(0.000379)<br />
Observations 1,911 1,657<br />
Number <strong>of</strong> geographic areas 254 253<br />
Number <strong>of</strong> instruments 35 31<br />
AR(1) 0 0.004<br />
AR(2) 0.214 0.067<br />
Hansen 0.256 0.759<br />
Wald Test (homicides) N/A 0.0541<br />
Wald Test (non-homicides) 0.0878<br />
Source: Authors’ calculations.<br />
* p < 0.1; ** p < 0.05; *** p < 0.01; Robust standard errors in parentheses<br />
56 <strong>Center</strong> <strong>for</strong> American Progress | <strong>The</strong> <strong>Economic</strong> <strong>Benefits</strong> <strong>of</strong> <strong>Reducing</strong> <strong>Violent</strong> <strong>Crime</strong>
Robustness test 2: Quadratic effects<br />
For our second test <strong>of</strong> robustness, we test <strong>for</strong> quadratic effects (Table B-2, below).<br />
Again, our main regression specification is in column (1). In column (2) we<br />
include a regression where differences <strong>of</strong> the squares <strong>of</strong> the crime variables are<br />
added as explanatory variables. <strong>The</strong> results show that the coefficients <strong>for</strong> these<br />
terms are small and the coefficients are insignificant. We conclude that quadratic<br />
effects have only little influence on our results. (see Table B-2)<br />
TABLE B-2<br />
Test <strong>of</strong> robustness–quadratic effects<br />
Specification 1 Specification 2 51<br />
Variables Δ(log(MedProp it<br />
)) Δ(log(MedProp it<br />
))<br />
Δ(log(MedProp i(t-1)<br />
))<br />
Δ(Homicides (t-1)<br />
)<br />
Δ(Homicides i(t-1)<br />
)^2<br />
Δ(NonHomicides (t-1)<br />
)<br />
Δ(NonHomicides i(t-1)<br />
)^2<br />
0.737***<br />
(0.0947)<br />
-0.0152**<br />
(0.00684)<br />
0.000260<br />
(0.000192)<br />
0.894***<br />
(0.076)<br />
-0.0298**<br />
(0.0223)<br />
0.000695<br />
(0.000465)<br />
0.000445<br />
(0.0003918)<br />
-1.79e-07<br />
(1.35e-07)<br />
Number <strong>of</strong> geographic areas 1,911 1,911<br />
Number <strong>of</strong> instruments 254 254<br />
AR(1) 35 51<br />
AR(2) 0 0<br />
Hansen 0.214 0.163<br />
Source: Authors’ calculations.<br />
* p < 0.1; ** p < 0.05; *** p < 0.01; Standard errors in parentheses<br />
Appendix B | www.americanprogress.org 57
Robustness test 3: Average versus median residential property price<br />
<strong>The</strong> third robustness test we conduct compares the use <strong>of</strong> median residential<br />
property price data and average residential property price data, which were also<br />
available from DataQuick. Because DataQuick does not take steps to compare<br />
repeat transactions <strong>of</strong> similar homes, there is a chance that outliers exist in the<br />
dataset that they used to calculate average prices by geographic area. Since we have<br />
no means to measure the existence <strong>of</strong> outliers, we chose to use the median prices<br />
that they report rather than the mean prices since medians are relatively invariant<br />
to outliers. In Table B-3, below, we include in column (2), a regression with mean<br />
residential property prices. (see Table B-3)<br />
TABLE B-3<br />
Test <strong>of</strong> robustness–median and average property price data<br />
Specification 1 Specification 2 52<br />
Variables Δ(log(MedProp it<br />
)) Δ(log(MedProp it<br />
))<br />
Δ(log(MedProp i(t-1)<br />
))<br />
Δ(Homicides (t-1)<br />
)<br />
Δ(NonHomicides (t-1)<br />
)<br />
0.737***<br />
(0.0947)<br />
-0.0152**<br />
(0.00684)<br />
0.000260<br />
(0.000192)<br />
0.591***<br />
(0.112)<br />
-0.0122**<br />
(0.00566)<br />
0.000236<br />
(0.000170)<br />
Number <strong>of</strong> geographic areas 1,911 1,909<br />
Number <strong>of</strong> instruments 254 396<br />
AR(1) 35 35<br />
AR(2) 0 0.001<br />
Hansen 0.214 0.253<br />
Source: Authors’ calculations.<br />
* p < 0.1; ** p < 0.05; *** p < 0.01; Standard errors in parentheses<br />
58 <strong>Center</strong> <strong>for</strong> American Progress | <strong>The</strong> <strong>Economic</strong> <strong>Benefits</strong> <strong>of</strong> <strong>Reducing</strong> <strong>Violent</strong> <strong>Crime</strong>
Robustness test 4: One-step and two-step estimators<br />
<strong>The</strong> two-step estimator is preferable to the one-step estimator in that it is robust<br />
to panel autocorrelation and heteroskedasticity, but the standard errors are biased<br />
downwards and so researchers have historically provided both one-step and twostep<br />
results. In our main specification, however, we resolve the downward bias by<br />
employing the Windmeijer (2005) finite-sample correction. We only include onestep<br />
results as a robustness check <strong>for</strong> the sake <strong>of</strong> convention, and they can be seen<br />
in column (2) <strong>of</strong> Table B-4, below.<br />
TABLE B-4<br />
One-step and two-step estimators<br />
Specification 1 Specification 2 52<br />
Variables Δ(log(MedProp it<br />
)) Δ(log(MedProp it<br />
))<br />
Δ(log(MedProp i(t-1)<br />
))<br />
Δ(Homicides (t-1)<br />
)<br />
Δ(NonHomicides (t-1)<br />
)<br />
0.737***<br />
(0.0947)<br />
-0.0152**<br />
(0.00684)<br />
0.000260<br />
(0.000192)<br />
0.740***<br />
(0.0860)<br />
-0.0212**<br />
(0.00614)<br />
0.000459***<br />
(0.000196)<br />
Number <strong>of</strong> geographic areas 1,911 1,911<br />
Number <strong>of</strong> instruments 254 254<br />
AR(1) 35 35<br />
AR(2) 0 0.001<br />
Hansen 0.214 0.189<br />
Source: Authors’ calculations.<br />
* p < 0.1; ** p < 0.05; *** p < 0.01; Standard errors in parentheses<br />
Appendix B | www.americanprogress.org 59
Robustness test 5: Depth <strong>of</strong> lags in the instrument matrix<br />
Our fifth robustness check tests the sensitivity <strong>of</strong> our results to different depths <strong>of</strong><br />
lags in the instrument matrix. Our main specification includes all lags greater than<br />
three deep, and is reported in column (1) <strong>of</strong> Table B-5 below. Column (2) reports a<br />
specification with all lags greater than four deep and the results are roughly similar.<br />
Column (3), however, includes all lags greater than two deep and shows quite a large<br />
difference. We attribute this to overidentification that occurs under this specification,<br />
which can be seen by examining the p-value <strong>of</strong> the Hansen test, which only<br />
barely rejects the null hypothesis <strong>of</strong> no overidentification. (see Table B-5)<br />
TABLE B-5<br />
One-step and two-step estimators<br />
Specification 1 Specification 2 53 Specification 3 54<br />
Variables Δ(log(MedProp it<br />
)) Δ(log(MedProp it<br />
)) Δ(log(MedProp it<br />
))<br />
Δ(log(MedProp i(t-1)<br />
))<br />
Δ(Homicides (t-1)<br />
)<br />
Δ(NonHomicides (t-1)<br />
)<br />
0.737***<br />
(0.0947)<br />
-0.0152**<br />
(0.00684)<br />
0.000260<br />
(0.000192)<br />
0.791***<br />
(0.114)<br />
-0.0127**<br />
(0.007349)<br />
0.000223<br />
(0.000202)<br />
0.718***<br />
(0.0769)<br />
-0.00346**<br />
(0.00166)<br />
0.000057<br />
(0.0000683)<br />
Number <strong>of</strong> zip 1,911 1,911 1,911<br />
Number <strong>of</strong> instruments 254 254 254<br />
AR(1) 35 32 38<br />
AR(2) 0 0 0<br />
Hansen 0.214 0.210 0.286<br />
* p < 0.1; ** p < 0.05; *** p < 0.01; Standard errors in parentheses<br />
Source: Authors’ calculations.<br />
60 <strong>Center</strong> <strong>for</strong> American Progress | <strong>The</strong> <strong>Economic</strong> <strong>Benefits</strong> <strong>of</strong> <strong>Reducing</strong> <strong>Violent</strong> <strong>Crime</strong>
Robustness test 6: Collapsed and uncollapsed instrument matrix<br />
Our final robustness check compares a collapsed instrument matrix to one that<br />
is not collapsed. Our main specification, collapsed, is presented in column (1) <strong>of</strong><br />
Table B-6 below. Column (2) displays the results when the instrument matrix is<br />
left uncollapsed. When uncollapsed the number <strong>of</strong> instruments explodes, going<br />
from 35 to 141. Correspondingly, the Hansen test indicates that the model is<br />
strongly overidentified. <strong>The</strong> coefficients and significance levels remain roughly<br />
similar, except on the lagged dependent variable <strong>for</strong> which the magnitude <strong>of</strong> the<br />
coefficient drops considerably. (see Table B-6)<br />
TABLE B-6<br />
Collapsed and uncollapsed instrument matrix<br />
Specification 1 Specification 2 55<br />
Variables Δ(log(MedProp it<br />
)) Δ(log(MedProp it<br />
))<br />
Δ(log(MedProp i(t-1)<br />
))<br />
Δ(Homicides (t-1)<br />
)<br />
Δ(NonHomicides (t-1)<br />
)<br />
0.737***<br />
(0.0947)<br />
-0.0152**<br />
(0.00684)<br />
0.000260<br />
(0.000192)<br />
0.485***<br />
(0.128)<br />
-0.0138**<br />
(0.00430)<br />
0.000362***<br />
(0.000135)<br />
Number <strong>of</strong> geographic areas 1,911 1,911<br />
Number <strong>of</strong> instruments 254 254<br />
AR(1) 35 141<br />
AR(2) 0 0.001<br />
Hansen 0.214 0.224<br />
Source: Authors’ calculations.<br />
* p < 0.1; ** p < 0.05; *** p < 0.01; Standard errors in parentheses<br />
Appendix B | www.americanprogress.org 61
About the authors<br />
Robert J. Shapiro is the chairman <strong>of</strong> Sonecon, LLC, a private firm that advises<br />
U.S. and <strong>for</strong>eign businesses, governments, nonpr<strong>of</strong>it organizations, and trade<br />
associations on market conditions and economic policy. He is also a senior fellow<br />
<strong>of</strong> the Georgetown University McDonough School <strong>of</strong> Business, an advisor to the<br />
International Monetary Fund, director <strong>of</strong> the NDN Globalization Initiative, and<br />
chairman <strong>of</strong> the U.S. Climate Task Force.<br />
From 1997 to 2001 Shapiro was under secretary <strong>of</strong> commerce <strong>for</strong> economic<br />
affairs. Prior to that, he was co-founder and vice president <strong>of</strong> the Progressive<br />
Policy Institute and legislative director and economic counsel <strong>for</strong> Sen. Daniel P.<br />
Moynihan. Shapiro also served as the principal economic advisor to then- Gov.<br />
Bill Clinton in his 1991-92 presidential campaign, and as senior economic advisor<br />
to Vice President Al Gore and Sen. John Kerry (D-MA) in their presidential<br />
campaigns. In 2008 he advised the presidential campaign and transition <strong>of</strong><br />
Barack Obama. Shapiro has been a fellow <strong>of</strong> Harvard University, the Brookings<br />
Institution, and the National Bureau <strong>of</strong> <strong>Economic</strong> Research. He holds a Ph.D. and<br />
M.A. from Harvard University, a M.Sc. from the London School <strong>of</strong> <strong>Economic</strong>s<br />
and Political Science, and an A.B. from the University <strong>of</strong> Chicago.<br />
Kevin A. Hassett is director <strong>of</strong> economic policy studies and resident scholar at the<br />
American Enterprise Institute. Be<strong>for</strong>e joining AEI Hassett was a senior economist<br />
at the Board <strong>of</strong> Governors <strong>of</strong> the Federal Reserve System and an associate pr<strong>of</strong>essor<br />
at the Graduate School <strong>of</strong> Business <strong>of</strong> Columbia University. He was the chief<br />
economic advisor to Sen. John McCain (R-AZ) during the 2000 primaries and<br />
senior economic advisor during the 2008 campaign. He also served as a policy<br />
consultant to the U.S. Department <strong>of</strong> the Treasury during both the <strong>for</strong>mer Bush<br />
and Clinton administrations. He holds a B.A. from Swarthmore College and a<br />
Ph.D. from the University <strong>of</strong> Pennsylvania.<br />
Hassett is a member <strong>of</strong> the Joint Committee on Taxation’s Dynamic Scoring<br />
Advisory Panel, and an affiliate <strong>of</strong> Sonecon, LLC. He is also the author, coauthor,<br />
or editor <strong>of</strong> six books on economics and economic policy. Hassett has published<br />
articles in many scholarly pr<strong>of</strong>essional journals as well as popular media, and his<br />
economic commentaries are regularly aired on radio and television.<br />
62 <strong>Center</strong> <strong>for</strong> American Progress | <strong>The</strong> <strong>Economic</strong> <strong>Benefits</strong> <strong>of</strong> <strong>Reducing</strong> <strong>Violent</strong> <strong>Crime</strong>
Acknowledgements<br />
<strong>The</strong> authors wish to acknowledge the support <strong>for</strong> the research <strong>for</strong> this study provided<br />
by the <strong>Center</strong> <strong>for</strong> American Progress, and the superb research assistance provided<br />
by Douglas Dowson and Lisa Hamilton <strong>of</strong> Sonecon and by Matthew Jensen.<br />
Acknowledgements | www.americanprogress.org 63
Endnotes<br />
1 “<strong>Crime</strong> and Criminal Justice Statistics,” available at<br />
http://www.unodc.org/unodc/en/data-and-analysis/<br />
statistics/crime.html.<br />
2 Phaedra S. Corso and others, “Medical Costs and Productivity<br />
Losses Due to Interpersonal and Self-Directed<br />
Violence in the United States,” American Journal <strong>of</strong><br />
Preventative Medicine 32 (6) (2007): 474–482, available at<br />
http://www.cdc.gov/ncipc/pub-res/Medical_Costs.pdf.<br />
3 Paul Guerino, Paige M. Harrison, and William J. Sabol,<br />
“Prisoners in 2010” (Washington: Bureau <strong>of</strong> Justice<br />
Statistics, 2011).<br />
4 P.J. Cook and J. Ludwig, “Aiming <strong>for</strong> evidence-based<br />
gun policy,” Journal <strong>of</strong> Policy Analysis and Management<br />
25 (3) (2006): 691–735.<br />
5 A.A. Braga and others, “<strong>The</strong> Strategic Prevention <strong>of</strong><br />
Gun Violence Among Gang-Involved Offenders,” Justice<br />
Quarterly 25 (1) (2008): 132–162.<br />
6 P.J. Cook and others, “Underground gun markets,” <strong>The</strong><br />
<strong>Economic</strong> Journal (117) (2007): F558–588.<br />
7 D.W. Webster and others, “Effects <strong>of</strong> undercover police<br />
stings <strong>of</strong> gun dealers on the supply <strong>of</strong> new guns to<br />
criminals,” Injury Prevention (12) (2006): 225–230.<br />
8 Brandon C. Welsh and David P. Farrington, “Science, politics,<br />
and crime prevention: Toward a new crime policy,”<br />
Journal <strong>of</strong> Criminal Justice 40 (2) (2012): 128–133, available<br />
at http://www.sciencedirect.com/science/article/<br />
pii/S0047235212000232.<br />
9 National Institute <strong>of</strong> Justice, Preventing <strong>Crime</strong>: What<br />
Works, What Doesn’t, What’s Promising (Department<br />
<strong>of</strong> Justice, 1998), available at https://www.ncjrs.gov/<br />
pdffiles/171676.PDF. <strong>The</strong> case <strong>for</strong> enhanced police<br />
resources to reduce serious crime owes much to the<br />
so-called “Broken Windows” strategy first proposed<br />
by political scientists James Q. Wilson and George<br />
Kelling. <strong>The</strong>y argued that zero police tolerance <strong>for</strong> petty<br />
<strong>of</strong>fenses such as graffiti and public urination would<br />
not only improve the quality <strong>of</strong> life in low-income<br />
neighborhoods but also reduce rates <strong>of</strong> much more<br />
serious crimes. While some critics argue that punishing<br />
petty crimes in itself has little effect, the byproduct<br />
<strong>of</strong> an overall increased police presence, especially in<br />
crime hotspots, clearly helped bring down rates <strong>of</strong><br />
violent crimes in the 1990s. Economist Steven Levitt,<br />
<strong>for</strong> example, notes that “at least to a crude first approximation,<br />
the investment in police appears to have<br />
been attractive from a cost-benefit perspective.” Steven<br />
D. Levitt, “Understanding Why <strong>Crime</strong> Fell in the 1990s:<br />
Four Factors that Explain the Decline and Six that Do<br />
Not,” Journal <strong>of</strong> <strong>Economic</strong> Perspectives 18 (1) (2004):<br />
163–190, available at http://pricetheory.uchicago.edu/<br />
levitt/Papers/LevittUnderstandingWhy<strong>Crime</strong>2004.pdf.<br />
10 Peter W. Greenwood and others, “Diverting Children<br />
from a Life <strong>of</strong> <strong>Crime</strong>: Measuring Costs and <strong>Benefits</strong>”<br />
(Arlington, VA: RAND Corporation, 1998).<br />
11 <strong>The</strong> low cost effectiveness <strong>of</strong> three-strikes laws is<br />
consistent with several studies that have found that investments<br />
in preventive measures can drastically reduce<br />
future costs associated with building new prisons and<br />
maintaining a high prison population. See, <strong>for</strong> example:<br />
Steve Aos, Marna G. Miller, and Elizabeth K. Drake,<br />
“Evidence-Based Public Policy Options to Reduce <strong>Crime</strong><br />
and Criminal Justice Costs: Implications in Washington<br />
State,” Victims and Offenders (4) (2009): 170–196, available<br />
at http://www.wsipp.wa.gov/rptfiles/09-00-1201.pdf.<br />
12 See: Roger Przybylski, “What Works: Effective Recidivism<br />
Reduction and Risk-Focused Prevention Programs”<br />
(Bensalem, PA: RKC Group, 2008).<br />
13 Jennifer L. Doleac, “<strong>The</strong> Effects <strong>of</strong> DNA Databases on<br />
<strong>Crime</strong>.” (Stan<strong>for</strong>d University, 2012).<br />
14 Peter Greenwood, “Cost-Effective Violence Prevention<br />
Through Targeted Family Interventions,” Annals <strong>of</strong> the<br />
New York Academy <strong>of</strong> Sciences 1036 (2004): 201–214.<br />
15 Michael E. Porter, “New Strategies <strong>for</strong> Inner-City <strong>Economic</strong><br />
Development,” <strong>Economic</strong> Development Quarterly<br />
11 (1) (1997): 11–27. available at http://geoearth.uncc.<br />
edu/people/iheard/6501Readings/Week6_porter.pdf<br />
Michael E. Porter, “<strong>The</strong> Competitive Advantage <strong>of</strong> the<br />
Inner City,” Harvard Business Review, May–June 1995, pp.<br />
55–72, available at http://www.uc.edu/cdc/Urban_database/food_resources/competitive-advantage-<strong>of</strong>inner-city.pdf.<br />
16 Steven D. Levitt, “<strong>The</strong> Limited Role <strong>of</strong> Changing Age<br />
Structure in Explaining Aggregate <strong>Crime</strong> Rates,” Criminology<br />
37 (3) (1999): 581–598.<br />
17 DataQuick estimated Houston home prices by calculating<br />
first purchase loan values divided by 0.85.<br />
18 W. M. Rokaw, J. A. Mercy, and J. C. Smith, “Comparing<br />
death certificate data with FBI crime reporting<br />
statistics on U.S. homicides,” Public Health 105 (5) (1990):<br />
447–455;.P. White, “Homicide.” In M. A. Walker, ed., Interpreting<br />
<strong>Crime</strong> Statistics, (Ox<strong>for</strong>d: Ox<strong>for</strong>d University Press,<br />
1995); John J. Donohue III, “Understanding the Time<br />
Path <strong>of</strong> <strong>Crime</strong>,” Journal <strong>of</strong> Criminal Law and Criminology<br />
88 (1998): 1423–1451.<br />
19 Yeng Bun, “U.S. Homes Set to Lose $1.7 Trillion in Value<br />
During 2010” (Seattle: Zillow, 2010), available at http://<br />
www.zillow.com/blog/research/2010/12/09/u-s-homesset-to-lose-1-7-trillion-in-value-during-2010/.<br />
20 <strong>The</strong> UCR also includes data on less serious or “Part II”<br />
<strong>of</strong>fenses, such as simple assault and driving under the<br />
influence <strong>of</strong> alcohol or drugs.<br />
21 J. Frederick Shenk and Patsy A. Klaus, “<strong>The</strong> <strong>Economic</strong><br />
Cost <strong>of</strong> <strong>Crime</strong>s to Victims” (Washington: Bureau <strong>of</strong><br />
Justice Statistics, 1984), available at http://www.bjs.<br />
gov/content/pub/pdf/eccv.pdf.<br />
22 Survey responses <strong>of</strong> “I don’t know” were excluded from<br />
these calculations.<br />
23 Tracey Kyckelhahn, “Justice Expenditures and Employment,<br />
FY 1982-2007 – Statistical Tables” (Washington:<br />
Bureau <strong>of</strong> Justice Statistics, 2011).<br />
24 “Consumer Price Index History Table,” available at ftp://<br />
ftp.bls.gov/pub/special.requests/cpi/cpiai.txt.<br />
25 Paul Guerino, Paige M. Harrison, and William J. Sabol,<br />
“Prisoners in 2010” (Washington: Bureau <strong>of</strong> Justice<br />
Statistics, 2011), available at http://bjs.ojp.usdoj.gov/<br />
content/pub/pdf/p10.pdf.<br />
26 Sean Rosenmerkel and Donald Farole, “Felony Sentences<br />
in State Courts, 2006, Statistical Tables” (Washington:<br />
Bureau <strong>of</strong> Justice Statistics, 2009); Matthew R. Durose<br />
and Patrick A. Langan, “Felony Sentences in State<br />
Courts, 2002” (Washington: Bureau <strong>of</strong> Justice Statistics,<br />
2004).<br />
64 <strong>Center</strong> <strong>for</strong> American Progress | <strong>The</strong> <strong>Economic</strong> <strong>Benefits</strong> <strong>of</strong> <strong>Reducing</strong> <strong>Violent</strong> <strong>Crime</strong>
27 Doris J. James, “Pr<strong>of</strong>ile <strong>of</strong> Jail Inmates, 2002” (Washington:<br />
Bureau <strong>of</strong> Justice Statistics, 2004), available at<br />
http://bjs.ojp.usdoj.gov/content/pub/pdf/pji02.pdf.<br />
28 Richard Thaler, “A note on the value <strong>of</strong> crime control:<br />
Evidence from the property market,” Journal <strong>of</strong> Urban<br />
<strong>Economic</strong>s 5 (1) (1978): 137–145.<br />
29 Julie Berry Cullen and Steven D. Levitt, “<strong>Crime</strong>, Urban<br />
Flight, and the Consequences <strong>for</strong> Cities,” <strong>The</strong> Review <strong>of</strong><br />
<strong>Economic</strong>s and Statistics 81 (2) (1999): 159–169.<br />
30 Keith Ihlanfeldt and Tom Mayock, “Panel Data Estimates<br />
<strong>of</strong> the Effects <strong>of</strong> Different Types <strong>of</strong> <strong>Crime</strong> on Housing<br />
Prices,” Regional Science and Urban <strong>Economic</strong>s 40 (2–3)<br />
(2010): 161–172.<br />
31 Jens Ludwig and Philip J. Cook, “<strong>The</strong> <strong>Benefits</strong> <strong>of</strong> <strong>Reducing</strong><br />
Gun Violence: Evidence from Contigent-Valuation<br />
Survey Data,” <strong>The</strong> Journal <strong>of</strong> Risk and Uncertainty 22 (3)<br />
(2001): 207–226, available at http://home.uchicago.<br />
edu/~ludwigj/papers/RU-CookLudwig-RedGunContinEval.pdf.<br />
32 Mark A. Cohen and others, “Willingness-To-Pay <strong>for</strong><br />
<strong>Crime</strong> Control Programs,” Criminology 42 (1) (2004):<br />
89–109.<br />
33 Peter A. Diamond and Jerry A. Hausman, “Contingent<br />
Valuation: Is Some Number better than No Number?”,<br />
<strong>The</strong> Journal <strong>of</strong> <strong>Economic</strong> Perspectives 8 (4) (1994): 45–64,<br />
available at http://darp.lse.ac.uk/PapersDB/Diamond-<br />
Hausman_%28JEP_94%29.pdf.<br />
34 Kenneth Arrow and others, “Report <strong>of</strong> the NOAA Panel<br />
on Contingent Valuation” Federal Register 58 (1993):<br />
4601–4614, available at http://www.<strong>for</strong>estrymaps.<br />
alaska.gov/response/nrda/spillcd/regs/cv_panel.pdf.<br />
35 Mark A. Cohen, “Pain, Suffering, and Jury Awards: A<br />
Study <strong>of</strong> the Cost <strong>of</strong> <strong>Crime</strong> to Victims,” Law & Society<br />
Review 22 (3) (1988): 537–556.<br />
36 Ted R. Miller, Mark A. Cohen, and Brian Wiersema,<br />
“Victim Costs and Consequences: A New Look” (Washington:<br />
National Institute <strong>of</strong> Justice, 1996), available at<br />
https://www.ncjrs.gov/pdffiles/victcost.pdf.<br />
37 <strong>The</strong> study also estimated long-term medical costs arising<br />
from rapes and assaults, supplementing NCVS data<br />
with hospital discharge data on lengths <strong>of</strong> stay and<br />
treatment costs <strong>for</strong> serious injuries.<br />
38 Miller and others, “Victim Costs and Consequences: A<br />
New Look,” addresses this problem by modeling pain<br />
and suffering costs <strong>for</strong> crime victims using data on out<strong>of</strong>-pocket<br />
costs, injuries, and other relevant variables.<br />
39 See, <strong>for</strong> example: Andrea Isoni, Graham Loomes, and<br />
Robert Sugden, “<strong>The</strong> Willingness to Pay—Willingness<br />
to Accept Gap, the ‘Endowment Effect,’ Subject Misconceptions,<br />
and Experimental Procedures <strong>for</strong> Eliciting<br />
Valuations,” American <strong>Economic</strong> Review 101 (2) (2011):<br />
991–1011.<br />
40 Kathryn E. McCollister, Michael T. French, and Hai Fang,<br />
“<strong>The</strong> Cost <strong>of</strong> <strong>Crime</strong> to Society: New <strong>Crime</strong>-Specific<br />
Estimates <strong>for</strong> Policy and Program Evaluation,” Drug and<br />
Alcohol Dependence 108 (1-2) (2010): 98–109.<br />
43 Cohen and others, “Willingness-To-Pay <strong>for</strong> <strong>Crime</strong> Control<br />
Programs.”<br />
44 For example, Miller Cohen, and Wiersema, “Victim<br />
Costs and Consequences: A New Look” estimated that<br />
the average victim <strong>of</strong> rape spends more than $5,200<br />
on related mental health care, spending that low- and<br />
moderate-income victims could not af<strong>for</strong>d.<br />
45 Peter Hermann, “Baltimore murder victims, suspects<br />
share ties to criminal justice system,” <strong>The</strong> Baltimore Sun,<br />
January 2, 2012, available at http://articles.baltimoresun.com/2012-01-02/news/bs-md-ci-homicide-analysis-20120102_1_killings-baltimore-murder-victims-violent-crime;<br />
Neely Tucker, “Most D.C. Homicide Victims<br />
Had Arrests; Analysis Highlights ‘Criminal Subculture,”<br />
<strong>The</strong> Washington Post, February 15, 2004; Katy Reckdahl,<br />
“NOPD release <strong>of</strong> murder victims’ criminal records is<br />
challenged,” <strong>The</strong> Times-Picayune, January 01, 2012,<br />
available at http://www.nola.com/crime/index.<br />
ssf/2012/01/nopd_release_<strong>of</strong>_murder_victims.html;<br />
Charles Well<strong>for</strong>d, Brenda J. Bond, and Sean Goodison,<br />
“<strong>Crime</strong> in New Orleans: Analyzing <strong>Crime</strong> Trends and<br />
New Orleans’ Responses to <strong>Crime</strong>” (Washington: Bureau<br />
<strong>of</strong> Justice Assistance, 2011)..In 2010 homicide victims<br />
in Baltimore had been arrested an average <strong>of</strong> 10 times.<br />
See: Ben Nuckols, “Homicides in violent Baltimore hit<br />
25-year low,” Associated Press, December 30, 2010.<br />
46 Criminal Victimization in the United States, 2006 (Department<br />
<strong>of</strong> Justice, 2007); LRP Publications, “Jury Verdict<br />
Research.”<br />
47 <strong>The</strong>se estimates <strong>of</strong> annual victim costs, justice system<br />
costs, and criminal productivity costs <strong>for</strong> violent crimes<br />
are based on the per-<strong>of</strong>fense costs and the incidence<br />
<strong>of</strong> <strong>of</strong>fenses reported in each city in 2010 by the FBI’s<br />
Uni<strong>for</strong>m <strong>Crime</strong> Reports. Per-<strong>of</strong>fense victim costs are<br />
based on direct out-<strong>of</strong>-pocket costs reported by victims<br />
<strong>of</strong> violent crimes in the NCVS surveys <strong>for</strong> 2006–2010.<br />
Per-<strong>of</strong>fense police and judicial system costs are based<br />
on BJS data on U.S. justice system expenditures and arrest<br />
data from the FBI. Per-<strong>of</strong>fense corrections costs are<br />
based on BJS data on the average cost per-inmate in all<br />
U.S. jails and prisons, the number <strong>of</strong> convicted violent<br />
criminals in 2010, and the average incarceration time<br />
<strong>for</strong> criminals convicted <strong>of</strong> each type <strong>of</strong> violent crime.<br />
Estimates <strong>of</strong> criminal productivity costs are based on<br />
2002 BJS survey data on the pre-arrest incomes <strong>of</strong> jail<br />
inmates, their average age at sentencing, and their<br />
average sentence served. Finally, justice system costs<br />
borne by federal, state, and local governments are<br />
derived from BJS data, which in turn come from the<br />
Census Bureau Annual Government Finance Survey<br />
and Annual Survey <strong>of</strong> Public Employment.<br />
48 Jean Lemaire, “<strong>The</strong> Cost <strong>of</strong> Firearm Deaths in the United<br />
States: Reduced Life Expectancies and Increased<br />
Insurance Costs,” <strong>The</strong> Journal <strong>of</strong> Risk and Insurance 72 (3)<br />
(2005): 359–374.<br />
49 We assume here a one-to-one relationship between<br />
growth in local economic activity and growth in local<br />
tax revenues, based on extensive evidence on the<br />
sensitivity <strong>of</strong> local sales, business, and income taxes to<br />
local economic growth. See: Jesse Edgerton, Andrew F.<br />
Haughwout, and Rae Rosen, “Revenue Implications <strong>of</strong><br />
New York City’s Tax System,” Current Issues in <strong>Economic</strong>s<br />
and Finance: Second District Highlights 10 (4) (2004): 1-7.<br />
41 LRP Publications, “Jury Verdict Research: Personal Injury<br />
Case Evaluation Service” (2004).<br />
42 McCollister, French, and Fang, “<strong>The</strong> Cost <strong>of</strong> <strong>Crime</strong> to<br />
Society: New <strong>Crime</strong>-Specific Estimates <strong>for</strong> Policy and<br />
Program Evaluation.”\<br />
Endnotes | www.americanprogress.org 65
50 In this case, Granger-causality testing is being per<strong>for</strong>med<br />
with panel data, which can lead to panel bias<br />
if conducted using a standard OLS model. This occurs<br />
because the lagged dependent variable is endogenous<br />
to the error term. In other words, if in period one, a<br />
geographic area experiences a negative shock to the<br />
dependent variable that is not explicitly modeled, then<br />
the error term will soak up the entire shock and the<br />
fixed effect <strong>for</strong> that geographic area will appear lower<br />
in every period. In period two, the lagged dependent<br />
variable and the fixed effect will both be lower, and so<br />
there is a positive correlation between a regressor and<br />
the error, and the model is inconsistent. To account <strong>for</strong><br />
this issue, we explore the Granger causality between<br />
violent crime and property prices using the Arellano-<br />
Bond (1991) two-step linear generalized method <strong>of</strong><br />
moments estimator, which was designed <strong>for</strong> dynamic<br />
panel analysis where there are few time periods but<br />
many individuals, or in our case, geographic areas. We<br />
implement the Arellano-Bond estimator using the STA-<br />
TA program xtabond2, developed by David Roodman<br />
and described in Roodman (2006). See: Manuel Arellano<br />
and Stephen Bond, “Some Tests <strong>of</strong> Specification <strong>for</strong><br />
Panel Data: Monte Carlo Evidence and an Application<br />
to Employment Equations,” Review <strong>of</strong> <strong>Economic</strong> Studies<br />
58 (2) (1991): 277–297; David Roodman, “How to Do<br />
xtabond2: An Introduction to ‘Difference’ and ‘System’<br />
GMM in Stata.” Working Paper 103 (<strong>Center</strong> <strong>for</strong> Global<br />
Development, 2006), available at http://repec.org/<br />
nasug2006/howtodoxtabond2.cgdev.pdf.<br />
51 <strong>The</strong> difference trans<strong>for</strong>mation eliminates fixed effects,<br />
but the independent variables are still potentially<br />
endogenous and so we draw instruments from within<br />
our dataset. Specifically, we assume all independent<br />
variables are potentially endogenous and so we<br />
include third and deeper lags <strong>of</strong> each independent<br />
variable in levels as GMM style instruments. <strong>The</strong> year<br />
dummy variables are assumed to be strictly exogenous<br />
and included as IV style instruments, or in other words,<br />
we use the year dummy variables as their own instruments.<br />
We also employ small-sample adjustments, corrected<br />
standard errors, and we collapse the instrument<br />
matrix to avoid overidentification.<br />
52 xtabond2 logMedPriceR L(1/1).logMedPriceR L(1/1).homicides<br />
L(1/1).nonHomicides yr*, gmmstyle(homicides<br />
nonHomicides logMedPriceR, lag(3 .) c) ivstyle(yr*) two<br />
noleveleq nocons robust small<br />
53 xtabond2 logMedPriceR L(1/1).logMedPriceR L(1/1).homicides<br />
L(1/1).nonHomicides yr*, gmmstyle(homicides<br />
nonHomicides logMedPriceR, lag(3 .) c) ivstyle(yr*) two<br />
orth noleveleq nocons robust small<br />
54 xtabond2 logMedPriceR L(1/2).logMedPriceR L(1/2).homicides<br />
L(1/2).nonHomicides yr*, gmmstyle(homicides<br />
nonHomicides logMedPriceR, lag(4 .) c) ivstyle(yr*) two<br />
noleveleq nocons robust small<br />
55 xtabond2 logMedPriceR L(1/1).logMedPriceR L(1/1).<br />
homicides L(1/1).homicidesSq L(1/1).nonHomicidesSq<br />
yr*, gmmstyle(homicides nonHomicides logMedPriceR<br />
homicidesSq nonHomicidesSq, lag(3 .) c) ivstyle(yr*)<br />
two noleveleq nocons robust small<br />
56 xtabond2 logAvgPriceR L(1/1).logAvgPriceR L(1/1).homicides<br />
L(1/1).nonHomicides yr*, gmmstyle(homicides<br />
nonHomicides logAvgPriceR, lag(3 .) c) ivstyle(yr*) two<br />
noleveleq nocons robust small<br />
57 xtabond2 logMedPriceR L(1/1).logMedPriceR L(1/1).homicides<br />
L(1/1).nonHomicides yr*, gmmstyle(homicides<br />
nonHomicides logMedPriceR, lag(4 .) c) ivstyle(yr*) two<br />
noleveleq nocons robust small<br />
58 xtabond2 logMedPriceR L(1/1).logMedPriceR L(1/1).homicides<br />
L(1/1).nonHomicides yr*, gmmstyle(homicides<br />
nonHomicides logMedPriceR, lag(2 .) c) ivstyle(yr*) two<br />
noleveleq nocons robust small<br />
59 xtabond2 logMedPriceR L(1/1).logMedPriceR L(1/1).homicides<br />
L(1/1).nonHomicides yr*, gmmstyle(homicides<br />
nonHomicides logMedPriceR, lag(3 .)) ivstyle(yr*) two<br />
noleveleq nocons robust small<br />
66 <strong>Center</strong> <strong>for</strong> American Progress | <strong>The</strong> <strong>Economic</strong> <strong>Benefits</strong> <strong>of</strong> <strong>Reducing</strong> <strong>Violent</strong> <strong>Crime</strong>
About <strong>The</strong> <strong>Center</strong> <strong>for</strong> American Progress<br />
<strong>The</strong> <strong>Center</strong> <strong>for</strong> American Progress is a nonpartisan research and educational institute<br />
dedicated to promoting a strong, just, and free America that ensures opportunity <strong>for</strong> all.<br />
We believe that Americans are bound together by a common commitment to these values<br />
and we aspire to ensure that our national policies reflect these values. We work to find progressive<br />
and pragmatic solutions to significant domestic and international problems and develop policy<br />
proposals that foster a government that is “<strong>of</strong> the people, by the people, and <strong>for</strong> the people.”<br />
About Doing What Works<br />
CAP’s Doing What Works project promotes government re<strong>for</strong>m to efficiently allocate scarce resources<br />
and achieve greater results <strong>for</strong> the American people. This project specifically has three key objectives:<br />
• Eliminating or redesigning misguided spending programs and tax expenditures,<br />
focused on priority areas such as health care, energy, and education<br />
• Boosting government productivity by streamlining management and strengthening<br />
operations in the areas <strong>of</strong> human resources, in<strong>for</strong>mation technology, and procurement<br />
• Building a foundation <strong>for</strong> smarter decision-making by enhancing transparency<br />
and per<strong>for</strong>mance measurement and evaluation<br />
1333 H Street, NW, 10th Floor, Washington, DC 20005 • Tel: 202-682-1611 • Fax: 202-682-1867 • www.americanprogress.org