Lynne Wong's PhD thesis
Lynne Wong's PhD thesis Lynne Wong's PhD thesis
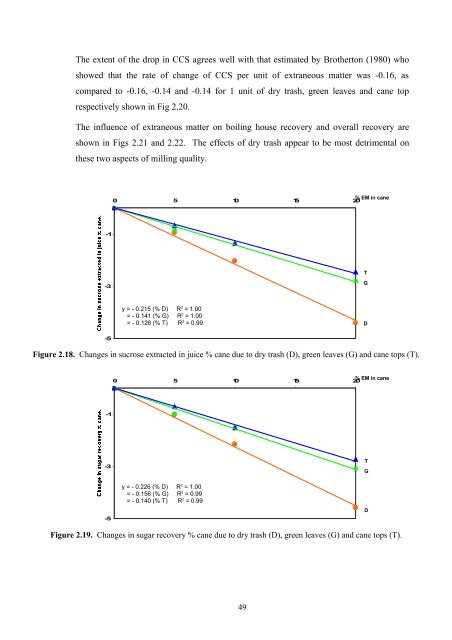
The extent of the drop in CCS agrees well with that estimated by Brotherton (1980) who showed that the rate of change of CCS per unit of extraneous matter was -0.16, as compared to -0.16, -0.14 and -0.14 for 1 unit of dry trash, green leaves and cane top respectively shown in Fig 2.20. The influence of extraneous matter on boiling house recovery and overall recovery are shown in Figs 2.21 and 2.22. The effects of dry trash appear to be most detrimental on these two aspects of milling quality. % EM in cane 0 5 10 15 20 -1 T -3 G y = - 0.215 (% D) R 2 = 1.00 = - 0.141 (% G) R 2 = 1.00 = - 0.126 (% T) R 2 = 0.99 D -5 Figure 2.18. Changes in sucrose extracted in juice % cane due to dry trash (D), green leaves (G) and cane tops (T). 0 5 10 15 20 % EM in cane -1 -3 T G -5 y = - 0.226 (% D) R 2 = 1.00 = - 0.156 (% G) R 2 = 0.99 = - 0.140 (% T) R 2 = 0.99 D Figure 2.19. Changes in sugar recovery % cane due to dry trash (D), green leaves (G) and cane tops (T). 49
% EM in cane 0 5 10 15 20 0 -2 y = - 0.160 (% D) R 2 = 0.99 = - 0.135 (% G) R 2 = 1.00 = - 0.141 (% T) R 2 = 1.00 G T D -4 Figure 2.20. Changes in commercial cane sugar due to dry trash (D), green leaves (G) and cane tops (T). % EM in cane 0 5 10 15 20 0.0 -2.0 -4.0 y = - 0.255 (% D) R 2 = 0.99 = - 0.216 (% G) R 2 = 0.98 = - 0.195 (% T) R 2 = 0.99 T G D -6.0 Figure 2.21. Changes in boiling house recovery due to dry trash (D), green leaves (G) and cane tops (T). 50
- Page 45 and 46: LIST OF MAIN SYMBOLS Symbol Descrip
- Page 47 and 48: s c s Slope of Caurie I isotherm pl
- Page 49 and 50: number of 255, and cane land covere
- Page 51 and 52: Nouvelle Mon In Trésor ustrie and
- Page 53 and 54: Figure 1.3. Cane sampling by core s
- Page 55 and 56: In Mauritius, most of the sugar fac
- Page 57 and 58: are: cane tops, dry and green leave
- Page 59 and 60: 1.4 TRENDS IN CANE QUALITY RECEIVED
- Page 61 and 62: campaign was launched to encourage
- Page 63 and 64: The level of extraneous matter in c
- Page 65 and 66: In Australia (Cargill, 1976), cane
- Page 67 and 68: The effect of soil on factory perfo
- Page 69 and 70: leaves increased the level of impur
- Page 71 and 72: • From 1976 to 1980, when the pro
- Page 73 and 74: Clerget purity of molasses 40 Clerg
- Page 75 and 76: CHAPTER 2. IMPACT OF EXTRANEOUS MAT
- Page 77 and 78: Since the extrapolated purity of mo
- Page 79 and 80: Figure 2.1. Jeffco cutter grinder.
- Page 81 and 82: 2.1.4 Results The analytical result
- Page 83 and 84: Table 2.3. Analytical results of re
- Page 85 and 86: Table 2.5. Composition of dry trash
- Page 87 and 88: Table 2.7. Predicted factory perfor
- Page 89 and 90: Boiling house recovery 91.0 89.8 89
- Page 91 and 92: 0 5 10 15 20 % EM in cane y = 0.572
- Page 93 and 94: % EM in cane 0 5 10 15 20 0 -2 -4 -
- Page 95: 1 y = 0.020 (% D) R 2 = 1.00 = 0.03
- Page 99 and 100: esulting in 0.015 unit sucrose loss
- Page 101 and 102: 2.2.1 Experimental procedure Cane m
- Page 103 and 104: filter paper, rejecting the first f
- Page 105 and 106: Table 2.9. Effect of increased addi
- Page 107 and 108: Table 2.11. Effect of increased add
- Page 109 and 110: Table 2.13. Effect of increased add
- Page 111 and 112: various components such as stalk fi
- Page 113 and 114: in the presence of dry leaves, if c
- Page 115 and 116: Table 2.17. Moisture content in sug
- Page 117 and 118: CHAPTER 3. SEPARATION OF THE SUGAR
- Page 119 and 120: Table 3.1. It can be seen that the
- Page 121 and 122: Table 3.2. Fibrous physical composi
- Page 123 and 124: R 579 R 570 M 1557/70 M 1400/86 74
- Page 125 and 126: loosen the fibre. The woody core is
- Page 127 and 128: agitate the mixture in the pot, and
- Page 129 and 130: Figure 3.7. Custom-built fibre-pith
- Page 131 and 132: The extraction of fibres starting f
- Page 133 and 134: pre-treatment in a Jeffco cutter-gr
- Page 135 and 136: Figure 3.19. Stalk cake washed free
- Page 137 and 138: not have many dry leaves attached t
- Page 139 and 140: Table 3.5. Masses of cane samples a
- Page 141 and 142: Table 3.7. Masses of cane samples a
- Page 143 and 144: Table 3.9. Masses of cane component
- Page 145 and 146: 3 57.6 126.3 23.7 97.2 31.1 53.8 11
The extent of the drop in CCS agrees well with that estimated by Brotherton (1980) who<br />
showed that the rate of change of CCS per unit of extraneous matter was -0.16, as<br />
compared to -0.16, -0.14 and -0.14 for 1 unit of dry trash, green leaves and cane top<br />
respectively shown in Fig 2.20.<br />
The influence of extraneous matter on boiling house recovery and overall recovery are<br />
shown in Figs 2.21 and 2.22. The effects of dry trash appear to be most detrimental on<br />
these two aspects of milling quality.<br />
% EM in cane<br />
0 5 10 15 20<br />
-1<br />
T<br />
-3<br />
G<br />
y = - 0.215 (% D) R 2 = 1.00<br />
= - 0.141 (% G) R 2 = 1.00<br />
= - 0.126 (% T) R 2 = 0.99<br />
D<br />
-5<br />
Figure 2.18. Changes in sucrose extracted in juice % cane due to dry trash (D), green leaves (G) and cane tops (T).<br />
0 5 10 15 20<br />
% EM in cane<br />
-1<br />
-3<br />
T<br />
G<br />
-5<br />
y = - 0.226 (% D) R 2 = 1.00<br />
= - 0.156 (% G) R 2 = 0.99<br />
= - 0.140 (% T) R 2 = 0.99<br />
D<br />
Figure 2.19. Changes in sugar recovery % cane due to dry trash (D), green leaves (G) and cane tops (T).<br />
49


