Lynne Wong's PhD thesis
Lynne Wong's PhD thesis Lynne Wong's PhD thesis
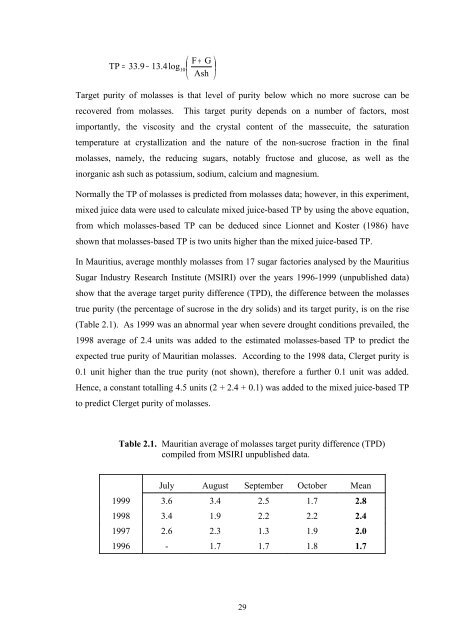
⎛ F + G ⎞ TP = 33.9 − 13.4log10 ⎜ ⎟ ⎝ Ash ⎠ Target purity of molasses is that level of purity below which no more sucrose can be recovered from molasses. This target purity depends on a number of factors, most importantly, the viscosity and the crystal content of the massecuite, the saturation temperature at crystallization and the nature of the non-sucrose fraction in the final molasses, namely, the reducing sugars, notably fructose and glucose, as well as the inorganic ash such as potassium, sodium, calcium and magnesium. Normally the TP of molasses is predicted from molasses data; however, in this experiment, mixed juice data were used to calculate mixed juice-based TP by using the above equation, from which molasses-based TP can be deduced since Lionnet and Koster (1986) have shown that molasses-based TP is two units higher than the mixed juice-based TP. In Mauritius, average monthly molasses from 17 sugar factories analysed by the Mauritius Sugar Industry Research Institute (MSIRI) over the years 1996-1999 (unpublished data) show that the average target purity difference (TPD), the difference between the molasses true purity (the percentage of sucrose in the dry solids) and its target purity, is on the rise (Table 2.1). As 1999 was an abnormal year when severe drought conditions prevailed, the 1998 average of 2.4 units was added to the estimated molasses-based TP to predict the expected true purity of Mauritian molasses. According to the 1998 data, Clerget purity is 0.1 unit higher than the true purity (not shown), therefore a further 0.1 unit was added. Hence, a constant totalling 4.5 units (2 + 2.4 + 0.1) was added to the mixed juice-based TP to predict Clerget purity of molasses. Table 2.1. Mauritian average of molasses target purity difference (TPD) compiled from MSIRI unpublished data. July August September October Mean 1999 3.6 3.4 2.5 1.7 2.8 1998 3.4 1.9 2.2 2.2 2.4 1997 2.6 2.3 1.3 1.9 2.0 1996 - 1.7 1.7 1.8 1.7 29
Since the extrapolated purity of molasses (M) and the purities of mixed juice (J) and sugar (S) were known, the SJM formula of Deerr (1921) could be used to predict the portion of the sucrose in the original material that goes to the sugar produced, after deduction of sucrose losses in filter cake and undetermined losses. The latter is the unaccounted sucrose loss when sucrose is extracted from cane after taking into account the sucrose losses in bagasse, in filter cake and in molasses. The SJM formula states that given a juice (or initial material, e.g. syrup or massecuite) of J purity and producing a sugar of S purity with a molasses of M purity, the percentage of the total sucrose (or pol) in the original material to go into the sugar will be 100S(J-M)/[J(S-M)]. The formula predicts the portion of the sucrose (or pol) in the original material that goes to the sugar produced, and the remainder goes to the molasses. No losses of any kind are taken into account in this formula. In this experiment, sucrose losses in filter cake and undetermined losses were unknown, and they were assumed to be 0.08 and 0.13% cane, respectively. These were the 1998 island average (Anon., 1999). When these values are compared to the 2004 values (Anon., 2005a) of 0.08 and 0.08% cane, respectively, it can be seen that they have remained more or less constant. The experiment also enabled the estimation of mill extraction (or more appropriately, press extraction, in the context in which the experiment was carried out); sucrose losses in bagasse and in molasses, boiling house recovery and overall recovery. Mill extraction is defined as the percent mass of pol originally present in the cane that has been extracted into the mixed juice. Boiling house recovery is the percentage of the pol in mixed juice that passes into the sugar produced. The product of mill extraction and boiling house recovery is known as overall recovery. 2.1.1 Materials For each trial of EM addition to clean cane, about 2 kg each of dry leaves, green leaves and cane tops, and about 20 kg of cane stalks were obtained from a neighbouring sugar factory. The cane stalks were cleaned of dry leaves, green leaves and cane tops. 1.3.1 Mercuric iodide juice preservative This is prepared by dissolving 500 g of red mercuric iodide in a saturated aqueous solution of potassium iodide and made up to a total volume of 1 L. The potassium iodide solution 30
- Page 25 and 26: Figure 5.11. Residual plots for the
- Page 27 and 28: total adsorbed water (m) and the pr
- Page 29 and 30: Table 2.18. Moisture content in sug
- Page 31 and 32: Page Table 4.4. Results of the dete
- Page 33 and 34: Page Table 4.24. Analysis of varian
- Page 35 and 36: Page Table 5.13. Table 5.14. Equili
- Page 37 and 38: Table 6.3. Heat of sorption of the
- Page 39 and 40: GLOSSARY OF TERMS Absorption is the
- Page 41 and 42: Filterability of a raw sugar is mea
- Page 43 and 44: Sorption is the generic term used w
- Page 45 and 46: LIST OF MAIN SYMBOLS Symbol Descrip
- Page 47 and 48: s c s Slope of Caurie I isotherm pl
- Page 49 and 50: number of 255, and cane land covere
- Page 51 and 52: Nouvelle Mon In Trésor ustrie and
- Page 53 and 54: Figure 1.3. Cane sampling by core s
- Page 55 and 56: In Mauritius, most of the sugar fac
- Page 57 and 58: are: cane tops, dry and green leave
- Page 59 and 60: 1.4 TRENDS IN CANE QUALITY RECEIVED
- Page 61 and 62: campaign was launched to encourage
- Page 63 and 64: The level of extraneous matter in c
- Page 65 and 66: In Australia (Cargill, 1976), cane
- Page 67 and 68: The effect of soil on factory perfo
- Page 69 and 70: leaves increased the level of impur
- Page 71 and 72: • From 1976 to 1980, when the pro
- Page 73 and 74: Clerget purity of molasses 40 Clerg
- Page 75: CHAPTER 2. IMPACT OF EXTRANEOUS MAT
- Page 79 and 80: Figure 2.1. Jeffco cutter grinder.
- Page 81 and 82: 2.1.4 Results The analytical result
- Page 83 and 84: Table 2.3. Analytical results of re
- Page 85 and 86: Table 2.5. Composition of dry trash
- Page 87 and 88: Table 2.7. Predicted factory perfor
- Page 89 and 90: Boiling house recovery 91.0 89.8 89
- Page 91 and 92: 0 5 10 15 20 % EM in cane y = 0.572
- Page 93 and 94: % EM in cane 0 5 10 15 20 0 -2 -4 -
- Page 95 and 96: 1 y = 0.020 (% D) R 2 = 1.00 = 0.03
- Page 97 and 98: % EM in cane 0 5 10 15 20 0 -2 y =
- Page 99 and 100: esulting in 0.015 unit sucrose loss
- Page 101 and 102: 2.2.1 Experimental procedure Cane m
- Page 103 and 104: filter paper, rejecting the first f
- Page 105 and 106: Table 2.9. Effect of increased addi
- Page 107 and 108: Table 2.11. Effect of increased add
- Page 109 and 110: Table 2.13. Effect of increased add
- Page 111 and 112: various components such as stalk fi
- Page 113 and 114: in the presence of dry leaves, if c
- Page 115 and 116: Table 2.17. Moisture content in sug
- Page 117 and 118: CHAPTER 3. SEPARATION OF THE SUGAR
- Page 119 and 120: Table 3.1. It can be seen that the
- Page 121 and 122: Table 3.2. Fibrous physical composi
- Page 123 and 124: R 579 R 570 M 1557/70 M 1400/86 74
- Page 125 and 126: loosen the fibre. The woody core is
⎛ F + G ⎞<br />
TP = 33.9 − 13.4log10<br />
⎜ ⎟<br />
⎝ Ash ⎠<br />
Target purity of molasses is that level of purity below which no more sucrose can be<br />
recovered from molasses. This target purity depends on a number of factors, most<br />
importantly, the viscosity and the crystal content of the massecuite, the saturation<br />
temperature at crystallization and the nature of the non-sucrose fraction in the final<br />
molasses, namely, the reducing sugars, notably fructose and glucose, as well as the<br />
inorganic ash such as potassium, sodium, calcium and magnesium.<br />
Normally the TP of molasses is predicted from molasses data; however, in this experiment,<br />
mixed juice data were used to calculate mixed juice-based TP by using the above equation,<br />
from which molasses-based TP can be deduced since Lionnet and Koster (1986) have<br />
shown that molasses-based TP is two units higher than the mixed juice-based TP.<br />
In Mauritius, average monthly molasses from 17 sugar factories analysed by the Mauritius<br />
Sugar Industry Research Institute (MSIRI) over the years 1996-1999 (unpublished data)<br />
show that the average target purity difference (TPD), the difference between the molasses<br />
true purity (the percentage of sucrose in the dry solids) and its target purity, is on the rise<br />
(Table 2.1). As 1999 was an abnormal year when severe drought conditions prevailed, the<br />
1998 average of 2.4 units was added to the estimated molasses-based TP to predict the<br />
expected true purity of Mauritian molasses. According to the 1998 data, Clerget purity is<br />
0.1 unit higher than the true purity (not shown), therefore a further 0.1 unit was added.<br />
Hence, a constant totalling 4.5 units (2 + 2.4 + 0.1) was added to the mixed juice-based TP<br />
to predict Clerget purity of molasses.<br />
Table 2.1. Mauritian average of molasses target purity difference (TPD)<br />
compiled from MSIRI unpublished data.<br />
July August September October Mean<br />
1999 3.6 3.4 2.5 1.7 2.8<br />
1998 3.4 1.9 2.2 2.2 2.4<br />
1997 2.6 2.3 1.3 1.9 2.0<br />
1996 - 1.7 1.7 1.8 1.7<br />
29


