Lynne Wong's PhD thesis
Lynne Wong's PhD thesis Lynne Wong's PhD thesis
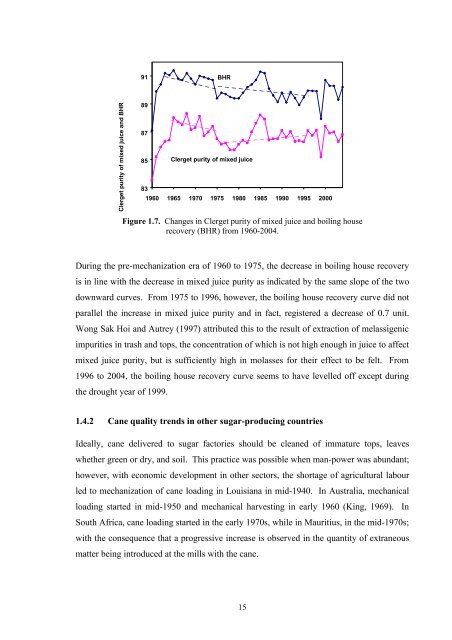
91 BHR Clerget purity of mixed juice and BHR 89 87 85 Clerget purity of mixed juice 83 1960 1965 1970 1975 1980 1985 1990 1995 2000 Figure 1.7. Changes in Clerget purity of mixed juice and boiling house recovery (BHR) from 1960-2004. During the pre-mechanization era of 1960 to 1975, the decrease in boiling house recovery is in line with the decrease in mixed juice purity as indicated by the same slope of the two downward curves. From 1975 to 1996, however, the boiling house recovery curve did not parallel the increase in mixed juice purity and in fact, registered a decrease of 0.7 unit. Wong Sak Hoi and Autrey (1997) attributed this to the result of extraction of melassigenic impurities in trash and tops, the concentration of which is not high enough in juice to affect mixed juice purity, but is sufficiently high in molasses for their effect to be felt. From 1996 to 2004, the boiling house recovery curve seems to have levelled off except during the drought year of 1999. 1.4.2 Cane quality trends in other sugar-producing countries Ideally, cane delivered to sugar factories should be cleaned of immature tops, leaves whether green or dry, and soil. This practice was possible when man-power was abundant; however, with economic development in other sectors, the shortage of agricultural labour led to mechanization of cane loading in Louisiana in mid-1940. In Australia, mechanical loading started in mid-1950 and mechanical harvesting in early 1960 (King, 1969). In South Africa, cane loading started in the early 1970s, while in Mauritius, in the mid-1970s; with the consequence that a progressive increase is observed in the quantity of extraneous matter being introduced at the mills with the cane. 15
The level of extraneous matter in cane depends on the weather at harvest, and the harvesting and loading methods chosen. The loading method known as push-piling entrains a lot of soil and trash in the cane, and is banned in certain parts of the world. In his review of cane quality in South Africa, Lionnet (1996) examined the industrial average of pol % cane (the data became sucrose % cane as from 1981 onwards), fibre % cane and pol purity of mixed juice from 1960 to 1995, and produced graphs to show the trend in cane quality received at South African sugar mills over the years. These graphs have been updated to 2004 (Figs 1.8 and 1.9) by making use of South African published data from 1960-2004 (Anon., 1985a; Anon., 2002b and Anon., 2005b). Sucrose % cane and fibre % cane 16 fibre % cane 14 sucrose % cane 12 sucrose / fibre ratio in cane 10 1960 1970 1980 1990 2000 2.5 2.0 1.5 1.0 0.5 Sucrose / fibre ratio in cane Figure 1.8. Changes in fibre % cane, sucrose % cane and sucrose/fibre ratio in South African cane from 1960-2004. 91 89 87 Purity of mixed juice 85 83 1960 1965 1970 1975 1980 1985 1990 1995 2000 Figure 1.9. Changes in purity of South African mixed juice from 1960-2004. 16
- Page 11 and 12: Page 3.4.3.3 Cane tops 83 3.4.4 Cha
- Page 13 and 14: 4.3.3 Temperature at which Brix-fre
- Page 15 and 16: 4.6.1 Materials 143 4.6.1.1 Samples
- Page 17 and 18: CHAPTER 6. PROPERTIES OF THE SORBED
- Page 19 and 20: APPENDIX 3. CALCULATIONS LEADING TO
- Page 21 and 22: LIST OF FIGURES Page Figure 1.1. Fi
- Page 23 and 24: Figure 3.1. Glucose and fructose an
- Page 25 and 26: Figure 5.11. Residual plots for the
- Page 27 and 28: total adsorbed water (m) and the pr
- Page 29 and 30: Table 2.18. Moisture content in sug
- Page 31 and 32: Page Table 4.4. Results of the dete
- Page 33 and 34: Page Table 4.24. Analysis of varian
- Page 35 and 36: Page Table 5.13. Table 5.14. Equili
- Page 37 and 38: Table 6.3. Heat of sorption of the
- Page 39 and 40: GLOSSARY OF TERMS Absorption is the
- Page 41 and 42: Filterability of a raw sugar is mea
- Page 43 and 44: Sorption is the generic term used w
- Page 45 and 46: LIST OF MAIN SYMBOLS Symbol Descrip
- Page 47 and 48: s c s Slope of Caurie I isotherm pl
- Page 49 and 50: number of 255, and cane land covere
- Page 51 and 52: Nouvelle Mon In Trésor ustrie and
- Page 53 and 54: Figure 1.3. Cane sampling by core s
- Page 55 and 56: In Mauritius, most of the sugar fac
- Page 57 and 58: are: cane tops, dry and green leave
- Page 59 and 60: 1.4 TRENDS IN CANE QUALITY RECEIVED
- Page 61: campaign was launched to encourage
- Page 65 and 66: In Australia (Cargill, 1976), cane
- Page 67 and 68: The effect of soil on factory perfo
- Page 69 and 70: leaves increased the level of impur
- Page 71 and 72: • From 1976 to 1980, when the pro
- Page 73 and 74: Clerget purity of molasses 40 Clerg
- Page 75 and 76: CHAPTER 2. IMPACT OF EXTRANEOUS MAT
- Page 77 and 78: Since the extrapolated purity of mo
- Page 79 and 80: Figure 2.1. Jeffco cutter grinder.
- Page 81 and 82: 2.1.4 Results The analytical result
- Page 83 and 84: Table 2.3. Analytical results of re
- Page 85 and 86: Table 2.5. Composition of dry trash
- Page 87 and 88: Table 2.7. Predicted factory perfor
- Page 89 and 90: Boiling house recovery 91.0 89.8 89
- Page 91 and 92: 0 5 10 15 20 % EM in cane y = 0.572
- Page 93 and 94: % EM in cane 0 5 10 15 20 0 -2 -4 -
- Page 95 and 96: 1 y = 0.020 (% D) R 2 = 1.00 = 0.03
- Page 97 and 98: % EM in cane 0 5 10 15 20 0 -2 y =
- Page 99 and 100: esulting in 0.015 unit sucrose loss
- Page 101 and 102: 2.2.1 Experimental procedure Cane m
- Page 103 and 104: filter paper, rejecting the first f
- Page 105 and 106: Table 2.9. Effect of increased addi
- Page 107 and 108: Table 2.11. Effect of increased add
- Page 109 and 110: Table 2.13. Effect of increased add
- Page 111 and 112: various components such as stalk fi
91<br />
BHR<br />
Clerget purity of mixed juice and BHR<br />
89<br />
87<br />
85 Clerget purity of mixed juice<br />
83<br />
1960 1965 1970 1975 1980 1985 1990 1995 2000<br />
Figure 1.7. Changes in Clerget purity of mixed juice and boiling house<br />
recovery (BHR) from 1960-2004.<br />
During the pre-mechanization era of 1960 to 1975, the decrease in boiling house recovery<br />
is in line with the decrease in mixed juice purity as indicated by the same slope of the two<br />
downward curves. From 1975 to 1996, however, the boiling house recovery curve did not<br />
parallel the increase in mixed juice purity and in fact, registered a decrease of 0.7 unit.<br />
Wong Sak Hoi and Autrey (1997) attributed this to the result of extraction of melassigenic<br />
impurities in trash and tops, the concentration of which is not high enough in juice to affect<br />
mixed juice purity, but is sufficiently high in molasses for their effect to be felt. From<br />
1996 to 2004, the boiling house recovery curve seems to have levelled off except during<br />
the drought year of 1999.<br />
1.4.2 Cane quality trends in other sugar-producing countries<br />
Ideally, cane delivered to sugar factories should be cleaned of immature tops, leaves<br />
whether green or dry, and soil. This practice was possible when man-power was abundant;<br />
however, with economic development in other sectors, the shortage of agricultural labour<br />
led to mechanization of cane loading in Louisiana in mid-1940. In Australia, mechanical<br />
loading started in mid-1950 and mechanical harvesting in early 1960 (King, 1969). In<br />
South Africa, cane loading started in the early 1970s, while in Mauritius, in the mid-1970s;<br />
with the consequence that a progressive increase is observed in the quantity of extraneous<br />
matter being introduced at the mills with the cane.<br />
15


