Lynne Wong's PhD thesis
Lynne Wong's PhD thesis Lynne Wong's PhD thesis
Table 5.13. Equilibrium moisture content (on a dry basis) of dry leaf fibre from R 570 aged 52 weeks and 36 weeks at various temperatures and water activities. 30 o C 45 o C 55 o C 60 o C Water water adsorbed Water water adsorbed Water water adsorbed Water water adsorbed m/m of 96% activity, a w (g/100g dry fibre) activity, a w (g/100g dry fibre) activity, a w (g/100g dry fibre) activity, a w (g/100g dry fibre) H 2SO 4 soln 52 weeks 36 weeks 52 weeks 36 weeks 52 weeks 36 weeks 52 weeks 36 weeks 5% 0.9808 26.21 28.02 0.9812 31.59 33.21 0.9816 31.65 33.21 0.9818 48.23 64.56 27.59 27.02 27.58 28.35 36.35 26.59 40.56 54.97 mean 26.90 27.52 29.59 30.78 34.00 29.90 44.40 59.77 10% 0.9746 25.49 25.58 0.9751 24.61 27.74 0.9760 26.14 25.09 0.9764 26.03 19.24 22.04 24.34 24.28 25.27 19.67 22.33 33.18 21.42 mean 23.77 24.96 24.45 26.51 22.91 23.71 29.61 20.33 20% 0.8814 16.75 17.12 0.8839 18.02 16.91 0.8868 16.94 17.13 0.8882 17.21 13.91 16.35 16.40 16.44 15.43 15.85 16.38 15.82 14.74 mean 16.55 16.76 17.23 16.17 16.40 16.76 16.52 14.33 30% 0.7549 17.51 13.29 0.7629 12.51 13.18 0.7684 14.44 12.50 0.7711 10.77 10.93 15.10 14.01 10.75 12.91 12.37 12.01 9.41 11.99 mean 16.31 13.65 11.63 13.05 13.41 12.26 10.09 11.46 40% 0.5711 10.80 8.92 0.5866 8.97 8.35 0.5948 8.58 9.73 0.5989 7.77 7.43 8.49 8.56 8.37 8.56 8.08 8.37 9.14 4.33 mean 9.65 8.74 8.67 8.46 8.33 9.05 8.46 5.88 50% 0.3574 5.98 5.97 0.3765 5.54 8.80 0.3879 5.29 5.49 0.3936 5.26 5.45 6.20 5.77 5.86 8.21 5.27 8.59 5.06 5.07 mean 6.09 5.87 5.70 8.51 5.28 7.04 5.16 5.26 60% 0.1677 4.11 4.83 0.1834 3.79 3.70 0.1937 3.73 4.08 0.1988 3.59 3.71 7.36 4.59 3.89 3.72 2.64 3.71 3.66 3.53 mean 5.74 4.71 3.84 3.71 3.19 3.90 3.63 3.62 Table 5.14. Equilibrium moisture content (on a dry basis) of dry leaf fines from R 570 aged 52 weeks and 36 weeks at various temperatures and water activities. 199
30 o C 45 o C 55 o C 60 o C Water water adsorbed Water water adsorbed Water water adsorbed Water water adsorbed m/m of 96% activity, a w (g/100g dry fibre) activity, a w (g/100g dry fibre) activity, a w (g/100g dry fibre) activity, a w (g/100g dry fibre) H 2SO 4 soln 52 weeks 36 weeks 52 weeks 36 weeks 52 weeks 36 weeks 52 weeks 36 weeks 5% 0.9808 27.36 28.12 0.9812 27.76 32.63 0.9816 28.61 30.82 0.9818 34.04 31.06 28.61 27.84 28.51 31.65 26.61 25.10 34.39 26.39 mean 27.99 27.98 28.14 32.14 27.61 27.96 34.22 28.73 10% 0.9746 23.52 23.32 0.9751 27.11 26.78 0.9760 30.08 27.78 0.9764 24.12 23.74 22.92 21.81 25.78 27.50 24.00 26.39 32.15 27.48 mean 23.22 22.57 26.45 27.14 27.04 27.09 28.14 25.61 20% 0.8814 22.38 18.09 0.8839 18.68 17.46 0.8868 17.75 17.44 0.8882 16.89 15.52 19.43 16.81 16.33 16.71 16.73 16.70 16.19 14.00 mean 20.91 17.45 17.51 17.09 17.24 17.07 16.54 14.76 30% 0.7549 18.51 12.94 0.7629 12.25 11.93 0.7684 11.64 12.49 0.7711 11.36 13.23 13.52 12.14 11.72 12.25 9.32 13.87 11.32 10.98 mean 16.02 12.54 11.99 12.09 10.48 13.18 11.34 12.11 40% 0.5711 11.22 9.38 0.5866 8.79 11.60 0.5948 8.28 9.81 0.5989 8.19 8.39 9.83 10.65 9.19 8.87 6.26 10.67 7.84 8.83 mean 10.53 10.02 8.99 10.24 7.27 10.24 8.02 8.61 50% 0.3574 7.40 6.44 0.3765 5.44 6.74 0.3879 9.48 5.60 0.3936 5.46 5.58 8.57 6.21 6.59 6.48 4.21 6.87 4.38 7.12 mean 7.99 6.33 6.02 6.61 6.85 6.24 4.92 6.35 60% 0.1677 4.42 5.02 0.1834 3.56 3.87 0.1937 3.87 4.24 0.1988 4.04 3.40 4.84 4.99 4.98 2.54 3.23 3.10 2.77 3.17 mean 4.63 5.01 4.27 3.21 3.55 3.67 3.41 3.29 Table 5.15. Equilibrium moisture content (on a dry basis) of green leaf fibre from R 570 aged 52 weeks and 36 weeks at various temperatures and water activities. 30 o C 45 o C 55 o C 60 o C Water water adsorbed Water water adsorbed Water water adsorbed Water water adsorbed 200
- Page 201 and 202: Table 4.18. Brix-free water values/
- Page 203 and 204: Table 4.20. Brix-free water values/
- Page 205 and 206: 4.7.3 Statistical analysis It is es
- Page 207 and 208: Table 4.23. Analysis of variance (B
- Page 209 and 210: pointing out that at 52 weeks old,
- Page 211 and 212: The crop of R 570 sampled in 2001 w
- Page 213 and 214: 4.7.4. Estimated Brix-free water co
- Page 215 and 216: The main difference in the two sets
- Page 217 and 218: Table 4.27. Predicted Brix-free wat
- Page 219 and 220: 4.8 SUMMARY AND CONCLUSIONS An anal
- Page 221 and 222: component parts, and verify the Bri
- Page 223 and 224: 3) Thermodynamic, water in equilibr
- Page 225 and 226: Langmuir (1916, 1917, 1918) propose
- Page 227 and 228: to determine the moisture sorption
- Page 229 and 230: Table 5.1. Some commonly used isoth
- Page 231 and 232: Lomauro et al. (1985) found that wi
- Page 233 and 234: and on agricultural products such a
- Page 235 and 236: Bruijn (1963) studied the mass incr
- Page 237 and 238: After measuring the EMC of dry corn
- Page 239 and 240: approached, that is, either by adso
- Page 241 and 242: Table 5.4. Water activity (a w ) of
- Page 243 and 244: 5.6.3 Procedure to determine equili
- Page 245 and 246: 5.6.4 Results and discussion An exa
- Page 247 and 248: Table 5.8. Equilibrium moisture con
- Page 249 and 250: Table 5.10. Equilibrium moisture co
- Page 251: Table 5.12. Equilibrium moisture co
- Page 255 and 256: m/m of 96% activity, a w (g/100g dr
- Page 257 and 258: vaporisation generally decreases fr
- Page 259 and 260: 30 o C isotherm 45 o C isotherm 55
- Page 261 and 262: 4 0 Stalk fibre 5 0 Stalk pith 5 0
- Page 263 and 264: 5.6.4.4 Fitting of sorption models
- Page 265 and 266: Table 5.19. Parameters of the sorpt
- Page 267 and 268: Table 5.21. Parameters of the sorpt
- Page 269 and 270: Table 5.23. Parameters of the sorpt
- Page 271 and 272: Table 5.25. Parameters of the sorpt
- Page 273 and 274: Table 5.27. Parameters of the sorpt
- Page 275 and 276: Modified GAB Kuhn Iglesias - Chirif
- Page 277 and 278: Table 5.28. Classification of resid
- Page 279 and 280: Stalk fibre Stalk pith Rind fibre 4
- Page 281 and 282: 5.6.4.5 Calculated EMC values of re
- Page 283 and 284: Table 5.30. Calculated equilibrium
- Page 285 and 286: m/m of 96% Table 5.32. Calculated e
- Page 287 and 288: Table 5.33. Parameters of the Hailw
- Page 289 and 290: CHAPTER 6. PROPERTIES OF THE SORBED
- Page 291 and 292: where m is the equilibrium moisture
- Page 293 and 294: Stalk fibre Stalk pith Rind fibre 8
- Page 295 and 296: Stalk fibre Stalk pith Rind fibre 4
- Page 297 and 298: 6.2 THE NUMBER OF ADSORBED MONOLAYE
- Page 299 and 300: 6.3 TOTAL SOLID SURFACE AREA AVAILA
- Page 301 and 302: Thus, for each cane component of ea
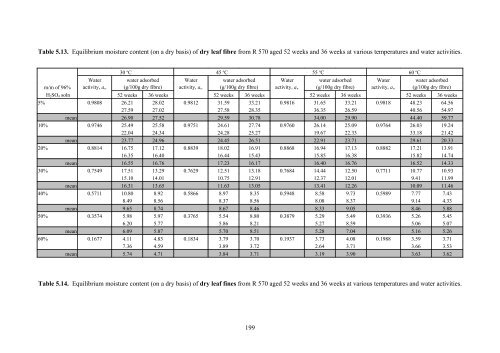
Table 5.13. Equilibrium moisture content (on a dry basis) of dry leaf fibre from R 570 aged 52 weeks and 36 weeks at various temperatures and water activities.<br />
30 o C 45 o C 55 o C 60 o C<br />
Water water adsorbed Water water adsorbed Water water adsorbed Water water adsorbed<br />
m/m of 96% activity, a w (g/100g dry fibre) activity, a w (g/100g dry fibre) activity, a w (g/100g dry fibre) activity, a w (g/100g dry fibre)<br />
H 2SO 4 soln 52 weeks 36 weeks 52 weeks 36 weeks 52 weeks 36 weeks 52 weeks 36 weeks<br />
5% 0.9808 26.21 28.02 0.9812 31.59 33.21 0.9816 31.65 33.21 0.9818 48.23 64.56<br />
27.59 27.02 27.58 28.35 36.35 26.59 40.56 54.97<br />
mean 26.90 27.52 29.59 30.78 34.00 29.90 44.40 59.77<br />
10% 0.9746 25.49 25.58 0.9751 24.61 27.74 0.9760 26.14 25.09 0.9764 26.03 19.24<br />
22.04 24.34 24.28 25.27 19.67 22.33 33.18 21.42<br />
mean 23.77 24.96 24.45 26.51 22.91 23.71 29.61 20.33<br />
20% 0.8814 16.75 17.12 0.8839 18.02 16.91 0.8868 16.94 17.13 0.8882 17.21 13.91<br />
16.35 16.40 16.44 15.43 15.85 16.38 15.82 14.74<br />
mean 16.55 16.76 17.23 16.17 16.40 16.76 16.52 14.33<br />
30% 0.7549 17.51 13.29 0.7629 12.51 13.18 0.7684 14.44 12.50 0.7711 10.77 10.93<br />
15.10 14.01 10.75 12.91 12.37 12.01 9.41 11.99<br />
mean 16.31 13.65 11.63 13.05 13.41 12.26 10.09 11.46<br />
40% 0.5711 10.80 8.92 0.5866 8.97 8.35 0.5948 8.58 9.73 0.5989 7.77 7.43<br />
8.49 8.56 8.37 8.56 8.08 8.37 9.14 4.33<br />
mean 9.65 8.74 8.67 8.46 8.33 9.05 8.46 5.88<br />
50% 0.3574 5.98 5.97 0.3765 5.54 8.80 0.3879 5.29 5.49 0.3936 5.26 5.45<br />
6.20 5.77 5.86 8.21 5.27 8.59 5.06 5.07<br />
mean 6.09 5.87 5.70 8.51 5.28 7.04 5.16 5.26<br />
60% 0.1677 4.11 4.83 0.1834 3.79 3.70 0.1937 3.73 4.08 0.1988 3.59 3.71<br />
7.36 4.59 3.89 3.72 2.64 3.71 3.66 3.53<br />
mean 5.74 4.71 3.84 3.71 3.19 3.90 3.63 3.62<br />
Table 5.14. Equilibrium moisture content (on a dry basis) of dry leaf fines from R 570 aged 52 weeks and 36 weeks at various temperatures and water activities.<br />
199


