Lynne Wong's PhD thesis
Lynne Wong's PhD thesis Lynne Wong's PhD thesis
Table 4.12. Impact of concentration of contact solution on Brix-free water. Sample Concentration of sucrose Brix-free water/% contact solution/°Brix Rind fibre 5 10.15 Rind fibre 10 9.76 Rind fibre 15 14.03 Stalk pith 5 15.80 Stalk pith 10 19.41 Stalk pith 15 19.19 Table 4.13. Impact of concentration of contact solution on Brix-free water. Sample Concentration of sucrose Brix-free Mean/% contact solution/°Brix water/% Stalk fibre 5 9.43 8.22 Stalk fibre 5 7.01 Stalk fibre 10 13.02 13.89 Stalk fibre 10 14.75 Stalk fibre 15 14.22 14.46 Stalk fibre 15 14.70 Rind fibre 5 6.25 7.74 Rind fibre 5 9.22 Rind fibre 10 10.70 10.84 Rind fibre 10 10.97 Rind fibre 15 11.17 11.11 Rind fibre 15 11.05 Table 4.14. Impact of ratio of contact solution to sample size on Brix-free water. Sample Ratio of contact Brix-free water/% solution to sample Rind fibre 1 19 21.69 Rind fibre 1 14 17.72 Rind fibre 1 9 16.87 Stalk pith 1 20 28.14 Stalk pith 1 14 24.72 Stalk pith 1 9 20.75 Rind fibre 2 25 14.36 Rind fibre 2 20 10.04 Rind fibre 2 15 11.99 Stalk pith 2 24 15.16 Stalk pith 2 20 15.80 Stalk pith 2 13 20.40 140
Qin and White’s finding was confirmed in a later experiment with a stalk fibre sample, when 10° Brix and 15° Brix sucrose solutions were used; the ratio of the contact solution was varied from 14.0 to 25.6 (Table 4.15). Table 4.15. Impact of ratio of contact solution to sample size on Brix-free water. Sample Concentration of contact Ratio of contact Brix-free water/% Mean/% sucrose solution/°Brix solution to sample Stalk fibre 10 25.0 15.36 15.71 Stalk fibre 10 25.6 16.06 Stalk fibre 10 18.8 15.47 15.75 Stalk fibre 10 19.3 16.02 Stalk fibre 10 14.3 16.65 16.55 Stalk fibre 10 14.0 16.45 Stalk fibre 15 25.5 16.99 16.96 Stalk fibre 15 25.2 16.92 Stalk fibre 15 18.9 15.94 16.26 Stalk fibre 15 19.0 16.57 Stalk fibre 15 14.4 16.33 16.21 Stalk fibre 15 14.9 16.09 4.4.9 Contact time The contact time was also checked, it appears that one and a half hours is sufficient to reach equilibrium. 4.4.10 Sample fineness According to Mangion and Player (1991), a sample in a finer state has a higher Brix-free water value due to the increased surface area per unit mass. It was therefore decided to reduce some fibre samples to a finer state (about 3 mm long) by using a pair of scissors, and to carry out Brix-free water determinations before and after the operation. Results obtained for duplicate analyses of 21 fibre samples are tabulated in Table 4.16. Statistical analysis by the Student’s t-test showed that there was no significant difference (P = 0.89) between the samples whether in their original or finer states. The standard error of the mean for 21 data points is 0.547 for a mean of 12.82 on the original samples, and 0.500 for a mean of 12.72 on finely cut samples. This shows that increased surface area does not increase the Brix-free water value, contrary to the finding of Mangion and Player (1991). 141
- Page 141 and 142: Table 3.7. Masses of cane samples a
- Page 143 and 144: Table 3.9. Masses of cane component
- Page 145 and 146: 3 57.6 126.3 23.7 97.2 31.1 53.8 11
- Page 147 and 148: Table 3.12. Material loss (%) from
- Page 149 and 150: 3.5.3 Fibre/pith ratios in cane com
- Page 151 and 152: Table 3.15. Effect of extraneous ma
- Page 153 and 154: Snow (1974) investigated the season
- Page 155 and 156: from Figure 2.9 that the change in
- Page 157 and 158: Table 3.18. Fibre % cane results by
- Page 159 and 160: 110
- Page 161 and 162: (a). Dry leaf (b). Green leaf (c).
- Page 163 and 164: dry fibre, or a factor, is used in
- Page 165 and 166: Steuerwald (1912) applied sucrose s
- Page 167 and 168: solution/fibre ratio was lowered fr
- Page 169 and 170: leave some residual moisture on the
- Page 171 and 172: instead of 150 g of 10° Brix sucro
- Page 173 and 174: Table 4.2. Determination of Brix-fr
- Page 175 and 176: Table 4.3. Comparison of Brix-free
- Page 177 and 178: Table 4.4. Results of the determina
- Page 179 and 180: In order to test for homogeneity of
- Page 181 and 182: Table 4.7. Results of the repeat de
- Page 183 and 184: The experiment was repeated with th
- Page 185 and 186: e any residual moisture in the samp
- Page 187 and 188: By means of the same technique, Won
- Page 189 and 190: was still hot. Since the filter was
- Page 191: value determined could be corrected
- Page 195 and 196: A sample size of 3.5 g with 75 g co
- Page 197 and 198: Figure 4.4. Fibre samples drying in
- Page 199 and 200: - One large fibre sample (rind) of
- Page 201 and 202: Table 4.18. Brix-free water values/
- Page 203 and 204: Table 4.20. Brix-free water values/
- Page 205 and 206: 4.7.3 Statistical analysis It is es
- Page 207 and 208: Table 4.23. Analysis of variance (B
- Page 209 and 210: pointing out that at 52 weeks old,
- Page 211 and 212: The crop of R 570 sampled in 2001 w
- Page 213 and 214: 4.7.4. Estimated Brix-free water co
- Page 215 and 216: The main difference in the two sets
- Page 217 and 218: Table 4.27. Predicted Brix-free wat
- Page 219 and 220: 4.8 SUMMARY AND CONCLUSIONS An anal
- Page 221 and 222: component parts, and verify the Bri
- Page 223 and 224: 3) Thermodynamic, water in equilibr
- Page 225 and 226: Langmuir (1916, 1917, 1918) propose
- Page 227 and 228: to determine the moisture sorption
- Page 229 and 230: Table 5.1. Some commonly used isoth
- Page 231 and 232: Lomauro et al. (1985) found that wi
- Page 233 and 234: and on agricultural products such a
- Page 235 and 236: Bruijn (1963) studied the mass incr
- Page 237 and 238: After measuring the EMC of dry corn
- Page 239 and 240: approached, that is, either by adso
- Page 241 and 242: Table 5.4. Water activity (a w ) of
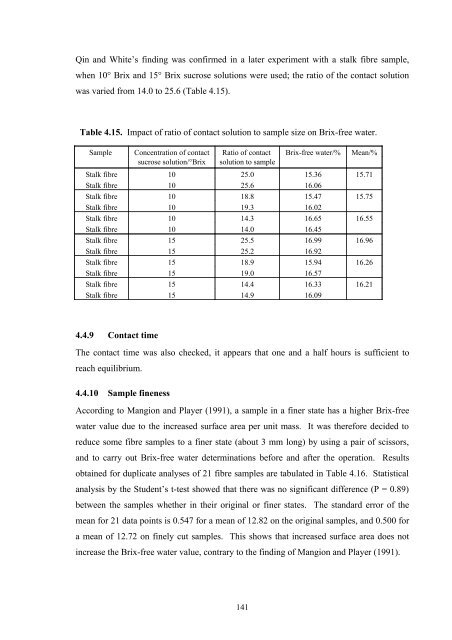
Qin and White’s finding was confirmed in a later experiment with a stalk fibre sample,<br />
when 10° Brix and 15° Brix sucrose solutions were used; the ratio of the contact solution<br />
was varied from 14.0 to 25.6 (Table 4.15).<br />
Table 4.15. Impact of ratio of contact solution to sample size on Brix-free water.<br />
Sample Concentration of contact Ratio of contact Brix-free water/% Mean/%<br />
sucrose solution/°Brix solution to sample<br />
Stalk fibre 10 25.0 15.36 15.71<br />
Stalk fibre 10 25.6 16.06<br />
Stalk fibre 10 18.8 15.47 15.75<br />
Stalk fibre 10 19.3 16.02<br />
Stalk fibre 10 14.3 16.65 16.55<br />
Stalk fibre 10 14.0 16.45<br />
Stalk fibre 15 25.5 16.99 16.96<br />
Stalk fibre 15 25.2 16.92<br />
Stalk fibre 15 18.9 15.94 16.26<br />
Stalk fibre 15 19.0 16.57<br />
Stalk fibre 15 14.4 16.33 16.21<br />
Stalk fibre 15 14.9 16.09<br />
4.4.9 Contact time<br />
The contact time was also checked, it appears that one and a half hours is sufficient to<br />
reach equilibrium.<br />
4.4.10 Sample fineness<br />
According to Mangion and Player (1991), a sample in a finer state has a higher Brix-free<br />
water value due to the increased surface area per unit mass. It was therefore decided to<br />
reduce some fibre samples to a finer state (about 3 mm long) by using a pair of scissors,<br />
and to carry out Brix-free water determinations before and after the operation. Results<br />
obtained for duplicate analyses of 21 fibre samples are tabulated in Table 4.16. Statistical<br />
analysis by the Student’s t-test showed that there was no significant difference (P = 0.89)<br />
between the samples whether in their original or finer states. The standard error of the<br />
mean for 21 data points is 0.547 for a mean of 12.82 on the original samples, and 0.500 for<br />
a mean of 12.72 on finely cut samples. This shows that increased surface area does not<br />
increase the Brix-free water value, contrary to the finding of Mangion and Player (1991).<br />
141


