Lynne Wong's PhD thesis
Lynne Wong's PhD thesis Lynne Wong's PhD thesis
Table 3.11. Masses of cane components of R 570 of three ages harvested in 2001 after fibre extraction and dry sieving. Sample Total dry mass after fibre extraction/g Dry mass of two fractions* after dry sieving/g Fibre/fines ratio Dry leaf Green leaf Top Rind Stalk Dry leaf Green leaf Top Rind Stalk Dry leaf Green leaf Top Rind Stalk 52 weeks 1 137.8 111.0 91.1 183.8 115.5 62.9 80.7 71.1 113.7 40.8 0.76 2.24 2.45 1.43 0.50 82.4 36.1 29.0 79.3 82.2 2 191.0 102.0 80.2 132.3 92.5 80.3 73.3 63.8 86.0 31.8 0.65 1.98 2.64 1.63 0.48 122.8 37.0 24.2 52.7 66.7 3 143.3 119.2 88.7 103.4 81.7 53.3 88.1 72.8 73.0 26.7 0.53 2.34 2.95 1.96 0.42 101.1 37.6 24.7 37.3 64.2 Mean 0.65 2.19 2.68 1.67 0.46 44 weeks 1 28.4 174.7 6.4 95.2 109.9 21.2 91.9 4.9 71.0 30.3 2.10 1.59 3.06 3.74 0.63 10.1 57.8 1.6 19.0 47.9 2 27.6 177.0 11.1 122.7 147.0 21.3 112.5 8.9 82.1 35.4 2.45 1.99 3.30 2.70 0.60 8.7 56.4 2.7 30.4 59.3 3 4.4 182.2 6.0 94.5 85.7 2.6 123.5 6.0 59.6 22.4 1.24 2.09 10.00 2.27 0.50 2.1 59.1 0.6 26.2 45.1 Mean 1.93 1.89 5.45 2.90 0.58 37 weeks 1 112.4 136.2 20.5 120.8 94.2 69.6 93.2 18.2 83.9 40.5 1.39 1.82 4.33 2.01 0.68 49.9 51.2 4.2 41.7 59.8 2 97.8 95.9 14.0 145.5 121.0 57.4 66.2 12.5 97.0 54.8 1.21 1.82 4.31 2.10 0.73 47.3 36.3 2.9 46.1 74.7 3 92.0 173.1 16.2 159.2 121.2 48.8 114.3 14.0 114.5 62.0 0.98 1.69 3.50 2.36 0.83 49.6 67.5 4.0 48.6 74.6 * The two fractions are > 1.18 mm and < 1.18 mm. Mean 1.20 1.78 4.05 2.16 0.75 97
Table 3.12. Material loss (%) from sugarcane component parts after fibre extraction. Sample aged 52 weeks Sample aged 44 weeks Sample aged 36 weeks Sample Dry leaf Green leaf Top Rind Stalk Dry leaf Green leaf Top Rind Stalk Dry leaf Green leaf Top Rind Stalk R 579 1 33.6 76.4 90.3 NA NA 69.0 81.0 88.9 82.5 95.1 42.5 76.7 90.3 91.8 93.9 2 38.8 76.2 93.5 NA NA 56.8 79.1 88.9 85.7 96.1 38.5 77.3 88.2 92.4 95.3 3 37.3 79.2 93.3 NA NA 57.8 79.7 87.9 84.4 95.7 44.1 79.1 87.0 80.0 96.0 R 570 1 40.0 77.0 89.3 NA NA 59.9 77.8 86.4 77.8 95.3 32.8 74.5 86.0 80.9 94.5 2 46.5 76.9 91.7 NA NA 58.2 79.7 87.3 78.7 95.2 32.0 74.6 87.7 34.6 96.3 3 38.4 77.3 94.7 NA NA 65.2 78.4 87.9 76.4 95.2 36.0 76.2 87.0 47.7 96.8 M 1557/70 1 40.1 74.3 87.8 NA NA 70.8 79.4 86.6 80.5 95.4 41.7 78.7 88.7 82.0 96.0 2 47.0 76.2 86.4 NA NA 70.7 76.6 88.3 76.8 94.3 42.2 78.7 89.1 77.7 95.7 3 39.8 76.2 94.6 NA NA 60.9 81.0 87.9 81.5 95.9 37.3 76.1 87.3 80.2 96.3 M 1400/86 1 40.9 77.9 84.6 NA NA 65.3 75.6 86.2 83.1 95.2 30.3 72.3 85.0 83.7 96.1 2 33.7 73.1 85.1 NA NA 56.8 76.7 86.3 80.3 94.7 38.4 77.6 86.0 81.6 95.2 3 44.6 72.6 88.1 NA NA 60.0 76.1 85.4 79.7 94.9 33.5 74.8 86.7 80.8 95.8 98
- Page 95 and 96: 1 y = 0.020 (% D) R 2 = 1.00 = 0.03
- Page 97 and 98: % EM in cane 0 5 10 15 20 0 -2 y =
- Page 99 and 100: esulting in 0.015 unit sucrose loss
- Page 101 and 102: 2.2.1 Experimental procedure Cane m
- Page 103 and 104: filter paper, rejecting the first f
- Page 105 and 106: Table 2.9. Effect of increased addi
- Page 107 and 108: Table 2.11. Effect of increased add
- Page 109 and 110: Table 2.13. Effect of increased add
- Page 111 and 112: various components such as stalk fi
- Page 113 and 114: in the presence of dry leaves, if c
- Page 115 and 116: Table 2.17. Moisture content in sug
- Page 117 and 118: CHAPTER 3. SEPARATION OF THE SUGAR
- Page 119 and 120: Table 3.1. It can be seen that the
- Page 121 and 122: Table 3.2. Fibrous physical composi
- Page 123 and 124: R 579 R 570 M 1557/70 M 1400/86 74
- Page 125 and 126: loosen the fibre. The woody core is
- Page 127 and 128: agitate the mixture in the pot, and
- Page 129 and 130: Figure 3.7. Custom-built fibre-pith
- Page 131 and 132: The extraction of fibres starting f
- Page 133 and 134: pre-treatment in a Jeffco cutter-gr
- Page 135 and 136: Figure 3.19. Stalk cake washed free
- Page 137 and 138: not have many dry leaves attached t
- Page 139 and 140: Table 3.5. Masses of cane samples a
- Page 141 and 142: Table 3.7. Masses of cane samples a
- Page 143 and 144: Table 3.9. Masses of cane component
- Page 145: 3 57.6 126.3 23.7 97.2 31.1 53.8 11
- Page 149 and 150: 3.5.3 Fibre/pith ratios in cane com
- Page 151 and 152: Table 3.15. Effect of extraneous ma
- Page 153 and 154: Snow (1974) investigated the season
- Page 155 and 156: from Figure 2.9 that the change in
- Page 157 and 158: Table 3.18. Fibre % cane results by
- Page 159 and 160: 110
- Page 161 and 162: (a). Dry leaf (b). Green leaf (c).
- Page 163 and 164: dry fibre, or a factor, is used in
- Page 165 and 166: Steuerwald (1912) applied sucrose s
- Page 167 and 168: solution/fibre ratio was lowered fr
- Page 169 and 170: leave some residual moisture on the
- Page 171 and 172: instead of 150 g of 10° Brix sucro
- Page 173 and 174: Table 4.2. Determination of Brix-fr
- Page 175 and 176: Table 4.3. Comparison of Brix-free
- Page 177 and 178: Table 4.4. Results of the determina
- Page 179 and 180: In order to test for homogeneity of
- Page 181 and 182: Table 4.7. Results of the repeat de
- Page 183 and 184: The experiment was repeated with th
- Page 185 and 186: e any residual moisture in the samp
- Page 187 and 188: By means of the same technique, Won
- Page 189 and 190: was still hot. Since the filter was
- Page 191 and 192: value determined could be corrected
- Page 193 and 194: Qin and White’s finding was confi
- Page 195 and 196: A sample size of 3.5 g with 75 g co
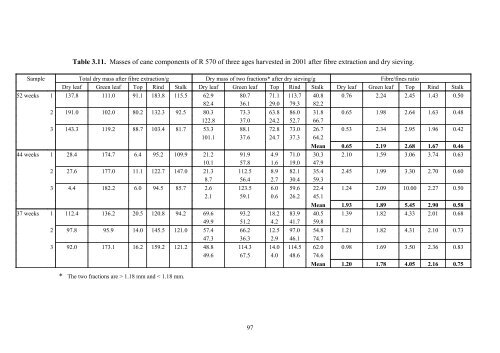
Table 3.11. Masses of cane components of R 570 of three ages harvested in 2001 after fibre extraction and dry sieving.<br />
Sample Total dry mass after fibre extraction/g Dry mass of two fractions* after dry sieving/g Fibre/fines ratio<br />
Dry leaf Green leaf Top Rind Stalk Dry leaf Green leaf Top Rind Stalk Dry leaf Green leaf Top Rind Stalk<br />
52 weeks 1 137.8 111.0 91.1 183.8 115.5 62.9 80.7 71.1 113.7 40.8 0.76 2.24 2.45 1.43 0.50<br />
82.4 36.1 29.0 79.3 82.2<br />
2 191.0 102.0 80.2 132.3 92.5 80.3 73.3 63.8 86.0 31.8 0.65 1.98 2.64 1.63 0.48<br />
122.8 37.0 24.2 52.7 66.7<br />
3 143.3 119.2 88.7 103.4 81.7 53.3 88.1 72.8 73.0 26.7 0.53 2.34 2.95 1.96 0.42<br />
101.1 37.6 24.7 37.3 64.2<br />
Mean 0.65 2.19 2.68 1.67 0.46<br />
44 weeks 1 28.4 174.7 6.4 95.2 109.9 21.2 91.9 4.9 71.0 30.3 2.10 1.59 3.06 3.74 0.63<br />
10.1 57.8 1.6 19.0 47.9<br />
2 27.6 177.0 11.1 122.7 147.0 21.3 112.5 8.9 82.1 35.4 2.45 1.99 3.30 2.70 0.60<br />
8.7 56.4 2.7 30.4 59.3<br />
3 4.4 182.2 6.0 94.5 85.7 2.6 123.5 6.0 59.6 22.4 1.24 2.09 10.00 2.27 0.50<br />
2.1 59.1 0.6 26.2 45.1<br />
Mean 1.93 1.89 5.45 2.90 0.58<br />
37 weeks 1 112.4 136.2 20.5 120.8 94.2 69.6 93.2 18.2 83.9 40.5 1.39 1.82 4.33 2.01 0.68<br />
49.9 51.2 4.2 41.7 59.8<br />
2 97.8 95.9 14.0 145.5 121.0 57.4 66.2 12.5 97.0 54.8 1.21 1.82 4.31 2.10 0.73<br />
47.3 36.3 2.9 46.1 74.7<br />
3 92.0 173.1 16.2 159.2 121.2 48.8 114.3 14.0 114.5 62.0 0.98 1.69 3.50 2.36 0.83<br />
49.6 67.5 4.0 48.6 74.6<br />
* The two fractions are > 1.18 mm and < 1.18 mm.<br />
Mean 1.20 1.78 4.05 2.16 0.75<br />
97


