Lynne Wong's PhD thesis
Lynne Wong's PhD thesis Lynne Wong's PhD thesis
Table 2.19. Moisture content in sugar cane dry leaves at FUEL sugar factory. Date % moisture Date % moisture Date % moisture Date % moisture 23.10.03 24.2 31.10.03 9.2 6.11.03 17.1 10.11.03 8.2 24.10.03 18.8 3.11.03 16.7 6.11.03 13.3 10.11.03 8.9 29.10.03 18.9 4.11.03 10.1 7.11.03 10.7 11.11.03 11.4 30.10.03 15.8 4.11.03 8.6 7.11.03 10.1 11.11.03 8.7 30.10.03 7.3 5.11.03 11.2 8.11.03 22.1 31.10.03 11.5 5.11.03 12.4 8.11.03 19.9 Mean of 22 determinations = 13.41 Standard deviation of the mean = 4.95 69
CHAPTER 3. SEPARATION OF THE SUGAR CANE PLANT INTO FIBRES OF VARIOUS COMPONENT PARTS This chapter describes the separation of the sugar cane plant, of four cane varieties and of three different ages, into fibres of various component parts by means of a method devised in this work. This was carried out in order to study their Brix-free water capacity and sorption behaviour. 3.1 THE SUGAR CANE PLANT Sugar cane is a perennial tropical grass of the genus saccharum, thought to have evolved in the Burma-China-India area of southern Asia, and later spread to other areas. It produces sturdy stalks 2 to 5 m in height and 3 to 5 cm in diameter. Cane leaves take up water, nutrients and carbon dioxide in the air to form photosynthate (glucose and fructose), the condensation reaction of which produces sucrose, a disaccharide, α-D-glucopyranosyl-β- D-fructofuranoside, which is then stored in the internodes of the cane stalk. 6CO 2 + 6 H 2 O C 6 H 12 O 6 + 6O 2 C 6 H 12 O 6 + C 6 H 12 O 6 C 12 H 22 O 11 + H 2 O glucose fructose sucrose The structures of glucose, fructose and their condensation product sucrose are shown in Fig 3.1.
- Page 65 and 66: In Australia (Cargill, 1976), cane
- Page 67 and 68: The effect of soil on factory perfo
- Page 69 and 70: leaves increased the level of impur
- Page 71 and 72: • From 1976 to 1980, when the pro
- Page 73 and 74: Clerget purity of molasses 40 Clerg
- Page 75 and 76: CHAPTER 2. IMPACT OF EXTRANEOUS MAT
- Page 77 and 78: Since the extrapolated purity of mo
- Page 79 and 80: Figure 2.1. Jeffco cutter grinder.
- Page 81 and 82: 2.1.4 Results The analytical result
- Page 83 and 84: Table 2.3. Analytical results of re
- Page 85 and 86: Table 2.5. Composition of dry trash
- Page 87 and 88: Table 2.7. Predicted factory perfor
- Page 89 and 90: Boiling house recovery 91.0 89.8 89
- Page 91 and 92: 0 5 10 15 20 % EM in cane y = 0.572
- Page 93 and 94: % EM in cane 0 5 10 15 20 0 -2 -4 -
- Page 95 and 96: 1 y = 0.020 (% D) R 2 = 1.00 = 0.03
- Page 97 and 98: % EM in cane 0 5 10 15 20 0 -2 y =
- Page 99 and 100: esulting in 0.015 unit sucrose loss
- Page 101 and 102: 2.2.1 Experimental procedure Cane m
- Page 103 and 104: filter paper, rejecting the first f
- Page 105 and 106: Table 2.9. Effect of increased addi
- Page 107 and 108: Table 2.11. Effect of increased add
- Page 109 and 110: Table 2.13. Effect of increased add
- Page 111 and 112: various components such as stalk fi
- Page 113 and 114: in the presence of dry leaves, if c
- Page 115: Table 2.17. Moisture content in sug
- Page 119 and 120: Table 3.1. It can be seen that the
- Page 121 and 122: Table 3.2. Fibrous physical composi
- Page 123 and 124: R 579 R 570 M 1557/70 M 1400/86 74
- Page 125 and 126: loosen the fibre. The woody core is
- Page 127 and 128: agitate the mixture in the pot, and
- Page 129 and 130: Figure 3.7. Custom-built fibre-pith
- Page 131 and 132: The extraction of fibres starting f
- Page 133 and 134: pre-treatment in a Jeffco cutter-gr
- Page 135 and 136: Figure 3.19. Stalk cake washed free
- Page 137 and 138: not have many dry leaves attached t
- Page 139 and 140: Table 3.5. Masses of cane samples a
- Page 141 and 142: Table 3.7. Masses of cane samples a
- Page 143 and 144: Table 3.9. Masses of cane component
- Page 145 and 146: 3 57.6 126.3 23.7 97.2 31.1 53.8 11
- Page 147 and 148: Table 3.12. Material loss (%) from
- Page 149 and 150: 3.5.3 Fibre/pith ratios in cane com
- Page 151 and 152: Table 3.15. Effect of extraneous ma
- Page 153 and 154: Snow (1974) investigated the season
- Page 155 and 156: from Figure 2.9 that the change in
- Page 157 and 158: Table 3.18. Fibre % cane results by
- Page 159 and 160: 110
- Page 161 and 162: (a). Dry leaf (b). Green leaf (c).
- Page 163 and 164: dry fibre, or a factor, is used in
- Page 165 and 166: Steuerwald (1912) applied sucrose s
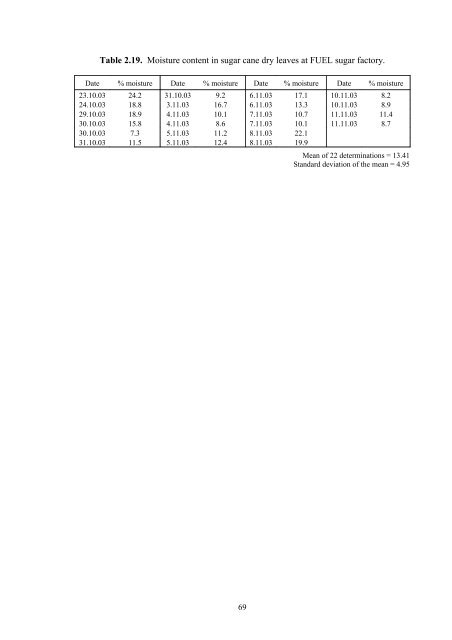
Table 2.19. Moisture content in sugar cane dry leaves at FUEL sugar factory.<br />
Date % moisture Date % moisture Date % moisture Date % moisture<br />
23.10.03 24.2 31.10.03 9.2 6.11.03 17.1 10.11.03 8.2<br />
24.10.03 18.8 3.11.03 16.7 6.11.03 13.3 10.11.03 8.9<br />
29.10.03 18.9 4.11.03 10.1 7.11.03 10.7 11.11.03 11.4<br />
30.10.03 15.8 4.11.03 8.6 7.11.03 10.1 11.11.03 8.7<br />
30.10.03 7.3 5.11.03 11.2 8.11.03 22.1<br />
31.10.03 11.5 5.11.03 12.4 8.11.03 19.9<br />
Mean of 22 determinations = 13.41<br />
Standard deviation of the mean = 4.95<br />
69


