Lynne Wong's PhD thesis
Lynne Wong's PhD thesis Lynne Wong's PhD thesis
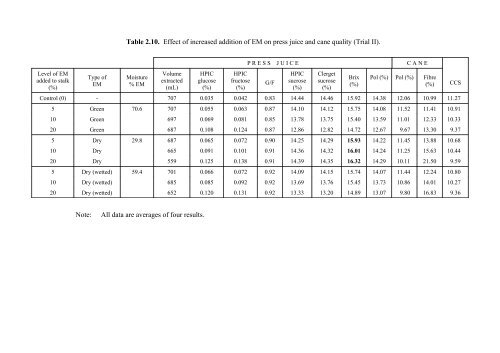
Table 2.10. Effect of increased addition of EM on press juice and cane quality (Trial II). Level of EM added to stalk (%) Type of EM Moisture % EM Volume extracted (mL) HPIC glucose (%) HPIC fructose (%) P R E S S J U I C E G/F HPIC sucrose (%) Clerget sucrose (%) Brix (%) C A N E Pol (%) Pol (%) Fibre (%) CCS Control (0) - 707 0.035 0.042 0.83 14.44 14.46 15.92 14.38 12.06 10.99 11.27 5 Green 70.6 707 0.055 0.063 0.87 14.10 14.12 15.75 14.08 11.52 11.41 10.91 10 Green 697 0.069 0.081 0.85 13.78 13.75 15.40 13.59 11.01 12.33 10.33 20 Green 687 0.108 0.124 0.87 12.86 12.82 14.72 12.67 9.67 13.30 9.37 5 Dry 29.8 687 0.065 0.072 0.90 14.25 14.29 15.93 14.22 11.45 13.88 10.68 10 Dry 665 0.091 0.101 0.91 14.36 14.32 16.01 14.24 11.25 15.63 10.44 20 Dry 559 0.125 0.138 0.91 14.39 14.35 16.32 14.29 10.11 21.50 9.59 5 Dry (wetted) 59.4 701 0.066 0.072 0.92 14.09 14.15 15.74 14.07 11.44 12.24 10.80 10 Dry (wetted) 685 0.085 0.092 0.92 13.69 13.76 15.45 13.73 10.86 14.01 10.27 20 Dry (wetted) 652 0.120 0.131 0.92 13.33 13.20 14.89 13.07 9.80 16.83 9.36 Note: All data are averages of four results.
Table 2.11. Effect of increased addition of EM on press juice and cane quality (Trial III). Level of EM added to stalk (%) Type of EM Moisture % EM Volume extracted (mL) HPIC glucose (%) HPIC fructose (%) P R E S S J U I C E G/F HPIC sucrose (%) Clerget sucrose (%) Brix (%) C A N E Pol (%) Pol (%) Fibre (%) CCS Control (0) 741 0.083 0.089 0.93 20.25 20.07 21.61 20.18 16.94 11.31 16.07 5 Green 72.2 723 0.106 0.111 0.95 19.65 19.54 21.15 19.61 16.25 11.93 15.44 10 Green 711 0.130 0.128 1.02 18.95 18.81 20.58 18.89 15.53 12.37 14.70 20 Green 685 0.172 0.166 1.04 17.56 17.39 19.39 17.44 13.68 12.92 13.32 5 Dry 15.1 693 0.135 0.137 0.99 20.23 20.08 21.84 20.18 15.90 13.96 15.46 10 Dry 645 0.155 0.157 0.99 20.43 20.25 22.17 20.37 14.90 17.34 14.90 20 Dry 563 0.258 0.260 0.99 20.65 20.49 22.77 20.57 13.60 23.64 13.67 5 Dry (wetted) 65.4 727 0.111 0.116 0.96 19.44 19.33 20.97 19.44 16.01 12.60 15.18 10 Dry (wetted) 716 0.136 0.134 1.01 18.89 18.73 20.41 18.79 15.16 13.25 14.49 20 Dry (wetted) 693 0.174 0.175 0.99 17.43 17.19 19.02 17.27 13.63 14.90 12.94 5 Dry (oven-dried) 7.1 689 0.130 0.132 0.98 20.46 20.29 22.09 20.40 16.16 14.48 15.52 10 Dry (oven-dried) 636 0.157 0.152 1.04 20.74 20.54 22.46 20.64 15.40 17.86 15.00 20 Dry (oven-dried) 547 0.194 0.189 1.03 21.11 20.98 23.25 21.05 14.03 25.17 13.70 Note: All data are averages of four results.
- Page 55 and 56: In Mauritius, most of the sugar fac
- Page 57 and 58: are: cane tops, dry and green leave
- Page 59 and 60: 1.4 TRENDS IN CANE QUALITY RECEIVED
- Page 61 and 62: campaign was launched to encourage
- Page 63 and 64: The level of extraneous matter in c
- Page 65 and 66: In Australia (Cargill, 1976), cane
- Page 67 and 68: The effect of soil on factory perfo
- Page 69 and 70: leaves increased the level of impur
- Page 71 and 72: • From 1976 to 1980, when the pro
- Page 73 and 74: Clerget purity of molasses 40 Clerg
- Page 75 and 76: CHAPTER 2. IMPACT OF EXTRANEOUS MAT
- Page 77 and 78: Since the extrapolated purity of mo
- Page 79 and 80: Figure 2.1. Jeffco cutter grinder.
- Page 81 and 82: 2.1.4 Results The analytical result
- Page 83 and 84: Table 2.3. Analytical results of re
- Page 85 and 86: Table 2.5. Composition of dry trash
- Page 87 and 88: Table 2.7. Predicted factory perfor
- Page 89 and 90: Boiling house recovery 91.0 89.8 89
- Page 91 and 92: 0 5 10 15 20 % EM in cane y = 0.572
- Page 93 and 94: % EM in cane 0 5 10 15 20 0 -2 -4 -
- Page 95 and 96: 1 y = 0.020 (% D) R 2 = 1.00 = 0.03
- Page 97 and 98: % EM in cane 0 5 10 15 20 0 -2 y =
- Page 99 and 100: esulting in 0.015 unit sucrose loss
- Page 101 and 102: 2.2.1 Experimental procedure Cane m
- Page 103 and 104: filter paper, rejecting the first f
- Page 105: Table 2.9. Effect of increased addi
- Page 109 and 110: Table 2.13. Effect of increased add
- Page 111 and 112: various components such as stalk fi
- Page 113 and 114: in the presence of dry leaves, if c
- Page 115 and 116: Table 2.17. Moisture content in sug
- Page 117 and 118: CHAPTER 3. SEPARATION OF THE SUGAR
- Page 119 and 120: Table 3.1. It can be seen that the
- Page 121 and 122: Table 3.2. Fibrous physical composi
- Page 123 and 124: R 579 R 570 M 1557/70 M 1400/86 74
- Page 125 and 126: loosen the fibre. The woody core is
- Page 127 and 128: agitate the mixture in the pot, and
- Page 129 and 130: Figure 3.7. Custom-built fibre-pith
- Page 131 and 132: The extraction of fibres starting f
- Page 133 and 134: pre-treatment in a Jeffco cutter-gr
- Page 135 and 136: Figure 3.19. Stalk cake washed free
- Page 137 and 138: not have many dry leaves attached t
- Page 139 and 140: Table 3.5. Masses of cane samples a
- Page 141 and 142: Table 3.7. Masses of cane samples a
- Page 143 and 144: Table 3.9. Masses of cane component
- Page 145 and 146: 3 57.6 126.3 23.7 97.2 31.1 53.8 11
- Page 147 and 148: Table 3.12. Material loss (%) from
- Page 149 and 150: 3.5.3 Fibre/pith ratios in cane com
- Page 151 and 152: Table 3.15. Effect of extraneous ma
- Page 153 and 154: Snow (1974) investigated the season
- Page 155 and 156: from Figure 2.9 that the change in
Table 2.10. Effect of increased addition of EM on press juice and cane quality (Trial II).<br />
Level of EM<br />
added to stalk<br />
(%)<br />
Type of<br />
EM<br />
Moisture<br />
% EM<br />
Volume<br />
extracted<br />
(mL)<br />
HPIC<br />
glucose<br />
(%)<br />
HPIC<br />
fructose<br />
(%)<br />
P R E S S J U I C E<br />
G/F<br />
HPIC<br />
sucrose<br />
(%)<br />
Clerget<br />
sucrose<br />
(%)<br />
Brix<br />
(%)<br />
C A N E<br />
Pol (%) Pol (%) Fibre<br />
(%) CCS<br />
Control (0) - 707 0.035 0.042 0.83 14.44 14.46 15.92 14.38 12.06 10.99 11.27<br />
5 Green 70.6 707 0.055 0.063 0.87 14.10 14.12 15.75 14.08 11.52 11.41 10.91<br />
10 Green 697 0.069 0.081 0.85 13.78 13.75 15.40 13.59 11.01 12.33 10.33<br />
20 Green 687 0.108 0.124 0.87 12.86 12.82 14.72 12.67 9.67 13.30 9.37<br />
5 Dry 29.8 687 0.065 0.072 0.90 14.25 14.29 15.93 14.22 11.45 13.88 10.68<br />
10 Dry 665 0.091 0.101 0.91 14.36 14.32 16.01 14.24 11.25 15.63 10.44<br />
20 Dry 559 0.125 0.138 0.91 14.39 14.35 16.32 14.29 10.11 21.50 9.59<br />
5 Dry (wetted) 59.4 701 0.066 0.072 0.92 14.09 14.15 15.74 14.07 11.44 12.24 10.80<br />
10 Dry (wetted) 685 0.085 0.092 0.92 13.69 13.76 15.45 13.73 10.86 14.01 10.27<br />
20 Dry (wetted) 652 0.120 0.131 0.92 13.33 13.20 14.89 13.07 9.80 16.83 9.36<br />
Note:<br />
All data are averages of four results.


