Design Compatibility of Classroom Furniture in Urban and ... - IOSR
Design Compatibility of Classroom Furniture in Urban and ... - IOSR
Design Compatibility of Classroom Furniture in Urban and ... - IOSR

Create successful ePaper yourself
Turn your PDF publications into a flip-book with our unique Google optimized e-Paper software.
The Impact Of Corporate Governance And Leadership On Entrepreneurship Development In Nigeria<br />
The available figures <strong>in</strong> table 20 above reveals that, 41 or 41% <strong>of</strong> the respondents strongly agreed 46 or 46%<br />
agreed, 6 or 6% undecided, 2 or 2% strongly disagreed, while 5 or 5% disagreed. As the largest population <strong>of</strong><br />
the respondents were <strong>in</strong> support <strong>of</strong> the above question, it means that, corporate governance has been <strong>of</strong><br />
tremendous assistance <strong>in</strong> the achievement <strong>of</strong> the organizations goals.<br />
4.3 PRESENTATION AND ANALYSIS OF DATA ACCORDING TO TESTS OF HYPOTHESES<br />
For an acceptable decision to be taken either to accept or reject the hypothesis to be tested, the hypotheses are be<br />
tested us<strong>in</strong>g the formula known as spearman‟s coefficient <strong>of</strong> rank correlation.<br />
The formula is stated thus:<br />
r = 1 – 6 ∑d 2<br />
n(n 2 - 1)<br />
where:<br />
r = coefficient <strong>of</strong> the correlation<br />
d = the difference between the rank <strong>of</strong> each pairs<br />
n = the number <strong>of</strong> paired observations.<br />
In order to know the strength <strong>of</strong> the relationships between the pairs (rank 1 <strong>and</strong> 2), the spearman‟s rank<br />
correlation shall be converted to t – statistics us<strong>in</strong>g the formula below:<br />
t = r<br />
where:<br />
n - 2<br />
n = number <strong>of</strong> element 1 (Pair – r 2 observation)<br />
t = student‟s t – distribution<br />
However, the null <strong>and</strong> alternative hypotheses are:<br />
H 0 : The rank correlation <strong>in</strong> the population is zero.<br />
H i : There is a positive association among the ranks<br />
Decision Rule:<br />
The decision rule is to reject H0 if the computed value <strong>of</strong> t is greater than the tabulated value <strong>of</strong> t at<br />
0.05 (5%) level <strong>of</strong> significance.<br />
HYPOTHESIS ONE<br />
H 0 : Organizational success or otherwise does not largely depend on the type or quality <strong>of</strong> leadership style used<br />
by the leaders.<br />
H i : Organizational success or otherwise largely depends on the type or quality <strong>of</strong> leadership style used by the<br />
leaders.<br />
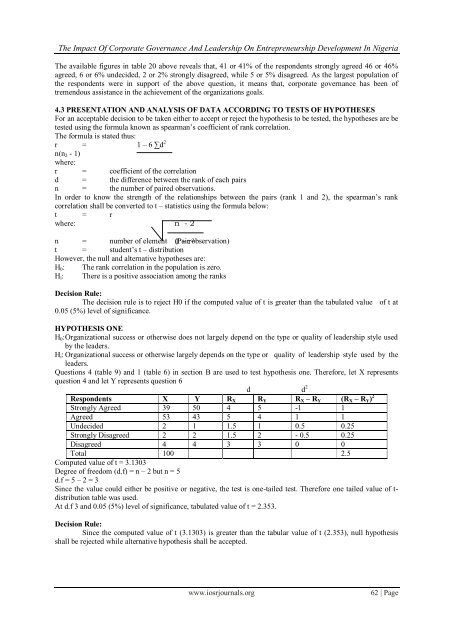
Questions 4 (table 9) <strong>and</strong> 1 (table 6) <strong>in</strong> section B are used to test hypothesis one. Therefore, let X represents<br />
question 4 <strong>and</strong> let Y represents question 6<br />
d d 2<br />
Respondents X Y R X R Y R X – R Y (R X – R Y ) 2<br />
Strongly Agreed 39 50 4 5 -1 1<br />
Agreed 53 43 5 4 1 1<br />
Undecided 2 1 1.5 1 0.5 0.25<br />
Strongly Disagreed 2 2 1.5 2 - 0.5 0.25<br />
Disagreed 4 4 3 3 0 0<br />
Total 100 2.5<br />
Computed value <strong>of</strong> t = 3.1303<br />
Degree <strong>of</strong> freedom (d.f) = n – 2 but n = 5<br />
d.f = 5 – 2 = 3<br />
S<strong>in</strong>ce the value could either be positive or negative, the test is one-tailed test. Therefore one tailed value <strong>of</strong> t-<br />
distribution table was used.<br />
At d.f 3 <strong>and</strong> 0.05 (5%) level <strong>of</strong> significance, tabulated value <strong>of</strong> t = 2.353.<br />
Decision Rule:<br />
S<strong>in</strong>ce the computed value <strong>of</strong> t (3.1303) is greater than the tabular value <strong>of</strong> t (2.353), null hypothesis<br />
shall be rejected while alternative hypothesis shall be accepted.<br />
www.iosrjournals.org<br />
62 | Page