Determination of Propagation Path Loss and Contour Map for ... - IOSR
Determination of Propagation Path Loss and Contour Map for ... - IOSR
Determination of Propagation Path Loss and Contour Map for ... - IOSR

You also want an ePaper? Increase the reach of your titles
YUMPU automatically turns print PDFs into web optimized ePapers that Google loves.
<strong>IOSR</strong> Journal <strong>of</strong> Electronics <strong>and</strong> Communication Engineering (<strong>IOSR</strong>-JECE)<br />
e-ISSN: 2278-2834,p- ISSN: 2278-8735. Volume 6, Issue 3 (May. - Jun. 2013), PP 04-09<br />
www.iosrjournals.org<br />
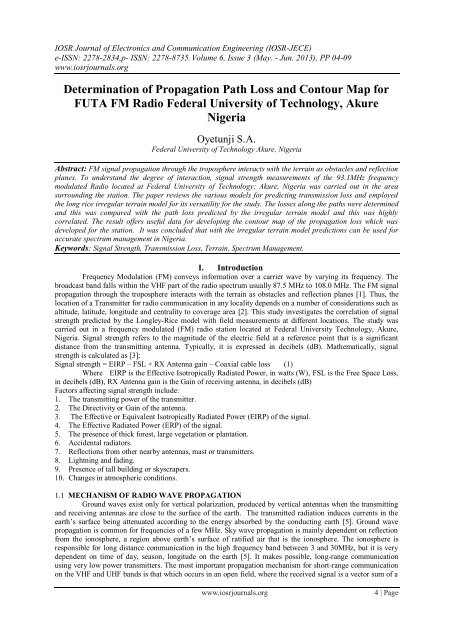
<strong>Determination</strong> <strong>of</strong> <strong>Propagation</strong> <strong>Path</strong> <strong>Loss</strong> <strong>and</strong> <strong>Contour</strong> <strong>Map</strong> <strong>for</strong><br />
FUTA FM Radio Federal University <strong>of</strong> Technology, Akure<br />
Nigeria<br />
Oyetunji S.A.<br />
Federal University <strong>of</strong> Technology Akure, Nigeria<br />
Abstract: FM signal propagation through the troposphere interacts with the terrain as obstacles <strong>and</strong> reflection<br />
planes. To underst<strong>and</strong> the degree <strong>of</strong> interaction, signal strength measurements <strong>of</strong> the 93.1MHz frequency<br />
modulated Radio located at Federal University <strong>of</strong> Technology; Akure, Nigeria was carried out in the area<br />
surrounding the station. The paper reviews the various models <strong>for</strong> predicting transmission loss <strong>and</strong> employed<br />
the long rice irregular terrain model <strong>for</strong> its versatility <strong>for</strong> the study. The losses along the paths were determined<br />
<strong>and</strong> this was compared with the path loss predicted by the irregular terrain model <strong>and</strong> this was highly<br />
correlated. The result <strong>of</strong>fers useful data <strong>for</strong> developing the contour map <strong>of</strong> the propagation loss which was<br />
developed <strong>for</strong> the station. It was concluded that with the irregular terrain model predictions can be used <strong>for</strong><br />
accurate spectrum management in Nigeria.<br />
Keywords: Signal Strength, Transmission <strong>Loss</strong>, Terrain, Spectrum Management.<br />
I. Introduction<br />
Frequency Modulation (FM) conveys in<strong>for</strong>mation over a carrier wave by varying its frequency. The<br />
broadcast b<strong>and</strong> falls within the VHF part <strong>of</strong> the radio spectrum usually 87.5 MHz to 108.0 MHz. The FM signal<br />
propagation through the troposphere interacts with the terrain as obstacles <strong>and</strong> reflection planes [1]. Thus, the<br />
location <strong>of</strong> a Transmitter <strong>for</strong> radio communication in any locality depends on a number <strong>of</strong> considerations such as<br />
altitude, latitude, longitude <strong>and</strong> centrality to coverage area [2]. This study investigates the correlation <strong>of</strong> signal<br />
strength predicted by the Longley-Rice model with field measurements at different locations. The study was<br />
carried out in a frequency modulated (FM) radio station located at Federal University Technology, Akure,<br />
Nigeria. Signal strength refers to the magnitude <strong>of</strong> the electric field at a reference point that is a significant<br />
distance from the transmitting antenna. Typically, it is expressed in decibels (dB). Mathematically, signal<br />
strength is calculated as [3];<br />
Signal strength = EIRP – FSL + RX Antenna gain – Coaxial cable loss (1)<br />
Where EIRP is the Effective Isotropically Radiated Power, in watts (W), FSL is the Free Space <strong>Loss</strong>,<br />
in decibels (dB), RX Antenna gain is the Gain <strong>of</strong> receiving antenna, in decibels (dB)<br />
Factors affecting signal strength include:<br />
1. The transmitting power <strong>of</strong> the transmitter.<br />
2. The Directivity or Gain <strong>of</strong> the antenna.<br />
3. The Effective or Equivalent Isotropically Radiated Power (EIRP) <strong>of</strong> the signal.<br />
4. The Effective Radiated Power (ERP) <strong>of</strong> the signal.<br />
5. The presence <strong>of</strong> thick <strong>for</strong>est, large vegetation or plantation.<br />
6. Accidental radiators.<br />
7. Reflections from other nearby antennas, mast or transmitters.<br />
8. Lightning <strong>and</strong> fading.<br />
9. Presence <strong>of</strong> tall building or skyscrapers.<br />
10. Changes in atmospheric conditions.<br />
1.1 MECHANISM OF RADIO WAVE PROPAGATION<br />
Ground waves exist only <strong>for</strong> vertical polarization, produced by vertical antennas when the transmitting<br />
<strong>and</strong> receiving antennas are close to the surface <strong>of</strong> the earth. The transmitted radiation induces currents in the<br />
earth‟s surface being attenuated according to the energy absorbed by the conducting earth [5]. Ground wave<br />
propagation is common <strong>for</strong> frequencies <strong>of</strong> a few MHz. Sky wave propagation is mainly dependent on reflection<br />
from the ionosphere, a region above earth‟s surface <strong>of</strong> ratified air that is the ionosphere. The ionosphere is<br />
responsible <strong>for</strong> long distance communication in the high frequency b<strong>and</strong> between 3 <strong>and</strong> 30MHz, but it is very<br />
dependent on time <strong>of</strong> day, season, longitude on the earth [5]. It makes possible, long-range communication<br />
using very low power transmitters. The most important propagation mechanism <strong>for</strong> short-range communication<br />
on the VHF <strong>and</strong> UHF b<strong>and</strong>s is that which occurs in an open field, where the received signal is a vector sum <strong>of</strong> a<br />
www.iosrjournals.org<br />
4 | Page
<strong>Determination</strong> Of <strong>Propagation</strong> <strong>Path</strong> <strong>Loss</strong> And <strong>Contour</strong> <strong>Map</strong> For Futa Fm Radio Federal University<br />
direct line-<strong>of</strong>-sight signal <strong>and</strong> as signal from the same source that is reflected <strong>of</strong>f the earth [6]. This shows that<br />
there exist a relationship between signal strength <strong>and</strong> range in line-<strong>of</strong>-sight <strong>and</strong> open field topographies. For this<br />
free-space case, the signal strength, E decreases in inverse proportion to the distance away from the transmitter<br />
antenna which is derived by [6]:<br />
E<br />
30P G<br />
d<br />
t<br />
t<br />
(2)<br />
Where: P t is the Transmitter power (Watts), G t is the Transmitter Antenna gain, d is the distance. The received<br />
power (P r ) is given by:<br />
2<br />
PtGtGr<br />
Pr (3)<br />
2<br />
(4d)<br />
Where: λ is the Wavelength <strong>and</strong> G r is the Receiver Antenna gains.<br />
It is very important to take into consideration the field strength versus distance <strong>for</strong> open field propagation. As<br />
the range increases, the signal strength followed an Inverse Square Law [7]. The propagation <strong>of</strong> radio waves is<br />
influenced by a lot <strong>of</strong> factors which are frequency dependent. These include:<br />
(a) Curvature <strong>of</strong> the earth terrain<br />
(b) The dielectric <strong>and</strong> resistivity constant <strong>of</strong> the earth <strong>and</strong> sea.<br />
(c) Troposphere absorption<br />
1.2 MODELS FOR PREDICTING RADIO PROPAGATION LOSS<br />
Various models have been developed <strong>for</strong> predicting the propagation <strong>of</strong> radio signal in the atmosphere<br />
[8]. These models considered factors limiting the propagation <strong>of</strong> radio waves <strong>and</strong> are useful in the<br />
determination <strong>of</strong> the primary <strong>and</strong> secondary coverage areas <strong>for</strong> Broadcasting Stations [9]. A station‟s coverage<br />
map is an essential ingredient in comparing the station‟s predicted signal strength with the actual measured<br />
values. Some <strong>of</strong> the prediction models are discussed below.<br />
1.2.1 LONGLEY-RICE MODEL<br />
In January 1, 1967, the American National Bureau <strong>of</strong> St<strong>and</strong>ards published Technical Note 101, [10] on<br />
propagation treatise that is being referred to as the “Longley-Rice Model”. The Longley-Rice Model considers<br />
atmospheric absorption including atmospheric absorption by water vapour <strong>and</strong> oxygen, loss due to sky-noise<br />
temperature <strong>and</strong> attenuation caused by rain <strong>and</strong> clouds. It considers terrain roughness, ground reflections, knifeedge,<br />
loss due to isolated obstacles, diffraction, <strong>for</strong>ward scatter <strong>and</strong> long-term power fading in its pre-defined<br />
signal level representations. It is usually used <strong>for</strong> calculating coverage areas <strong>and</strong> interference <strong>for</strong> broadcasting<br />
stations. The model predicts long-term median transmission loss. The model was designed <strong>for</strong> frequencies<br />
between 20 MHz to 40 GHz <strong>and</strong> <strong>for</strong> path lengths between 1Km to 2,000 Km. The Longley-Rice Model requires<br />
the input <strong>of</strong> certain general parameters so as to set-up the programme <strong>for</strong> propagation calculations. These<br />
parameters include: Frequency; Effective Radiated Power; Antenna Direction; Heights; Polarization;<br />
Refractivity; Permittivity; Conductivity; Variability <strong>and</strong> Climate<br />
1,2,2 OKUMURA PROPAGATION MODEL<br />
The basic Okumura Model uses the height above average terrain to calculate path loss <strong>and</strong> it does not<br />
consider specific terrain obstacles, a set <strong>of</strong> equations have been provided <strong>for</strong> the computer use <strong>of</strong> Okumura<br />
Model Predictions [11]. The Okumura model <strong>for</strong> Urban Areas is a Radio <strong>Propagation</strong> Model that was built<br />
using the data collected in the city <strong>of</strong> Tokyo, Japan. Okumura model was built into three modes which are<br />
urban, suburban <strong>and</strong> open areas. The frequency range <strong>of</strong> Okumura Model is between 200MHz <strong>and</strong> 1,900MHz<br />
[12] <strong>and</strong> it is mathematically expressed as:<br />
L L A H H K<br />
(4)<br />
FSL<br />
MU<br />
MG<br />
BG<br />
<br />
correction<br />
where,<br />
L = The median path loss unit: Decibel (dB)<br />
L FSL = The free space loss unit: Decibel (dB)<br />
A MU = Median attenuation unit: Decibel (dB)<br />
H MG = Mobile station antenna height gain factor.<br />
H BG = Base station antenna height gain factor.<br />
K correction = Correction factor gain (such as type <strong>of</strong> environment, water surfaces, isolated obstacle etc.)<br />
www.iosrjournals.org<br />
5 | Page
<strong>Determination</strong> Of <strong>Propagation</strong> <strong>Path</strong> <strong>Loss</strong> And <strong>Contour</strong> <strong>Map</strong> For Futa Fm Radio Federal University<br />
1.2.3 INTERNATIONAL TELECOMMUNICATIONS UNION (ITU-RP 1546-1)<br />
The ITU Model is widely used in Europe <strong>and</strong> Central America [13]. The model developed field<br />
strength predictions <strong>for</strong> terrestrial sources in the 30MHz to 3,000MHz frequency range [13]. It used a set <strong>of</strong><br />
propagation curves that are based on measurement data mainly relating mean climatic conditions in temperature<br />
climates. The model considers the transmitter height above average terrain, the receiver antenna height <strong>and</strong><br />
incorporates a correction <strong>for</strong> terrain clearance angle when making field strength predictions.<br />
1.2.4 COST-231 PROPAGATION MODEL<br />
This model uses the (Height Above Average Terrain) HAAT along each radial to determine the<br />
attenuation based on the following [14](ITU, 1998):<br />
<strong>Path</strong> <strong>Loss</strong> (dB):- 46 .3 33.9log( f ) 13.82log(<br />
H)<br />
[44.9<br />
6.55log(<br />
H)]log(<br />
d)<br />
C<br />
(5)<br />
Where: f is the Frequency (MHz); d is the distance between base station <strong>and</strong> receiver; H is the HAAT in the<br />
direction <strong>of</strong> the receiver (m); C is the environmental Correction factor (dB). This model impalements the cost-<br />
231/HATA version <strong>of</strong> COST – 231 <strong>Propagation</strong> Model. The HATA correction <strong>for</strong> receiver height <strong>and</strong> frequency<br />
is then applied <strong>for</strong> the attenuation.<br />
1.2.5 TIREM MODEL<br />
TIREM st<strong>and</strong>s <strong>for</strong> Terrain Integrated Rough Earth Model [13]. This model with Tech Note 101 base<br />
but has been modified over the years to make up <strong>for</strong> believed inaccuracies in the Longley-Rice Model. These<br />
techniques considered factors/components such as free-space spreading, reflection, diffraction, surface-wave,<br />
tropospheric-scattering <strong>and</strong> atmospheric absorption to arrive at the path loss. As opposed to Longley-Rice,<br />
TIREM has built-in routines <strong>for</strong> evaluating radio paths over sea water. TIREM is used by the US Department <strong>of</strong><br />
Defense. However, as a proprietary model, it is less attractive.<br />
II. Justification<br />
This research work was embarked upon to establish the following:<br />
a) to know their actual coverage area as compared to the specified value.<br />
b) to establish the level <strong>of</strong> compliance with the National broadcasting Commission (NBC)<br />
regulation;<br />
c) to reveal places with poor signal quality <strong>and</strong> suggest possible solutions on improvement<br />
d)<br />
2.1 FUTA RADIO 93.1 FM IN BRIEF<br />
Futa FM 93.1 commenced broadcast operation on the 19 th <strong>of</strong> November, 2010. The station was issued a<br />
Community Radio licensed by the National Broadcasting Commission <strong>for</strong> teaching, research <strong>and</strong> community<br />
development. Table 1 shows the technical parameter <strong>of</strong> the station [4].<br />
Table 1.0: List <strong>of</strong> technical parameters <strong>of</strong> the radio station<br />
PARAMETER<br />
VALUE<br />
Frequency <strong>of</strong> operation<br />
Frequency B<strong>and</strong>width<br />
Transmitting Power (TX Power)<br />
Effective Isotropically Radiated Power<br />
(EIRP)<br />
Maximum Deviation<br />
Antenna Gain<br />
Antenna Directivity<br />
Antenna Polarization<br />
Antenna type/ model<br />
93.1 fm<br />
200 kHz<br />
250W<br />
500W<br />
295 kHz<br />
1.93 dB<br />
1.56 dB<br />
Horizontal or 90 0<br />
vertical<br />
Yagi-Uda antenna<br />
to the<br />
Maximum Height <strong>of</strong> antenna / mast 48.768m<br />
Number <strong>of</strong> antennas installed Seven (7)<br />
Coverage Area<br />
25km (25000m)<br />
www.iosrjournals.org<br />
6 | Page
<strong>Determination</strong> Of <strong>Propagation</strong> <strong>Path</strong> <strong>Loss</strong> And <strong>Contour</strong> <strong>Map</strong> For Futa Fm Radio Federal University<br />
III. Methodology<br />
The methodology adopted includes the following:<br />
a. segmentation <strong>of</strong> the coverage area into eight (8) different sectors <strong>for</strong> measurement <strong>of</strong> signal strength,<br />
longitude <strong>and</strong> latitude,<br />
b. point-to-point measurements <strong>for</strong> determining the signal strength at different locations using a GPS<br />
Receiver <strong>and</strong> Digital Signal Strength Meter;<br />
c. collection <strong>of</strong> relevant in<strong>for</strong>mation about the station under consideration as presented in table 3;<br />
d. development <strong>of</strong> coverage contour map <strong>for</strong> the station under consideration<br />
3.1 METHOD OF DATA COLLECTION<br />
Four locations marked out to be visited were Ondo town, Owo town, Ilesha <strong>and</strong> Ikere-Ekiti. These<br />
locations were chosen because <strong>of</strong> their geographical positions which represent the South-Western part; the<br />
North-Western part, the South-Eastern <strong>and</strong> Northern part <strong>of</strong> Akure. These locations provide an adequate<br />
estimation <strong>of</strong> Futa radio signal strength on all sides. The equipments used in the acquisition <strong>of</strong> data are:<br />
1. A Digital Signal Level Meter (GILBERIT, GE - 5499)<br />
2. A GPS (Global Positioning System) Receiver (UBLOX ANTARIS 4)<br />
3. Laptop Computer<br />
4. Laptop Computer<br />
5.<br />
The collected data includes the following:<br />
Geographical Cordinates: comprises the Latitude, Longitude <strong>and</strong> Elevation <strong>of</strong> the points. This data was<br />
provided by the ANTARIS GPS Device.<br />
SIGNAL STRENGTH: the strength <strong>of</strong> the Futa 93.1 fm radio station signal as indicated by the digital signal<br />
level meter device at the various points.<br />
DISATANCE ITM: this is the distance,<br />
Along the line-<strong>of</strong>-sight, between the transmitter <strong>and</strong> a point as provided by the ITM s<strong>of</strong>tware.<br />
Figure 1.0 geographical map <strong>of</strong> Ondo showing the locations visited.<br />
IV. Data Presenttation And Analysis Of Results<br />
Three s<strong>of</strong>twares were used in the analysis <strong>of</strong> the results <strong>and</strong> values obtained. They are the Surfer 8<br />
s<strong>of</strong>tware, Irregular terrain Model <strong>and</strong> Micros<strong>of</strong>t excel. ITM estimates radio propagation losses over irregular<br />
terrain. It is an improved version <strong>of</strong> the Longley-Rice Model which gives an algorithm developed <strong>for</strong> computer<br />
applications [15]. The output is a list <strong>of</strong> estimated transmission losses <strong>for</strong> specifies values <strong>of</strong> reliability <strong>and</strong><br />
confidence levels. For this project work, the Point-to-Point prediction mode was used because the specific value<br />
<strong>of</strong> each location was known. The comparison <strong>of</strong> the measured <strong>and</strong> predicted is shown in Figure 2.<br />
www.iosrjournals.org<br />
7 | Page
LATITUDE (°E)<br />
LATITUDE (°E)<br />
Transmission <strong>Loss</strong> (dB)<br />
<strong>Determination</strong> Of <strong>Propagation</strong> <strong>Path</strong> <strong>Loss</strong> And <strong>Contour</strong> <strong>Map</strong> For Futa Fm Radio Federal University<br />
140<br />
130<br />
120<br />
110<br />
100<br />
90<br />
80<br />
70<br />
60<br />
Measured<br />
Predicted<br />
0 5 10 15 20 25 30 35<br />
Measurement Point<br />
Figure 2 Comparison <strong>of</strong> the basic transmission losses<br />
The contour map generated from the Latitude, Longitude <strong>and</strong> Signal strength values at the various locations is<br />
as shown Figure 3.<br />
5.22<br />
5.2<br />
5.18<br />
5.16<br />
5.14<br />
5.12<br />
5.1<br />
5.08<br />
82<br />
80<br />
78<br />
76<br />
74<br />
72<br />
70<br />
68<br />
66<br />
64<br />
62<br />
60<br />
58<br />
56<br />
54<br />
52<br />
50<br />
48<br />
46<br />
44<br />
42<br />
40<br />
38<br />
36<br />
34<br />
32<br />
30<br />
28<br />
KEY<br />
5.06<br />
5.04<br />
7.22 7.24 7.26 7.28 7.3 7.32 7.34 7.36 7.38<br />
LONGITUDE (°N)<br />
FIGURE 3.0 – the contour map <strong>of</strong> Ondo, Ilesha, Owo <strong>and</strong> Ado-Ekiti.<br />
The map in Figure 2 shows the distribution <strong>of</strong> the signal across Akure <strong>and</strong> its environs. The red colored<br />
regions shows the areas with very strong signal strength, the green areas are <strong>for</strong> locations with less strong signal<br />
strengths while the yellow region is <strong>for</strong> locations with the least signal strengths. The middle region is Akure<br />
where the radio station transmitter is located <strong>and</strong> from the contour map it is obvious that the signal strength is<br />
high at the middle region. The overlay <strong>of</strong> the geographical map <strong>and</strong> the contour map <strong>for</strong> the same coverage area<br />
having maximum value <strong>of</strong> (7.09456, 4.81809) to (7.606518, 5.498938) is shown in Figure. This value was used<br />
in order to get the exact locations <strong>of</strong> the coverage area <strong>and</strong> <strong>for</strong> proper overlay <strong>of</strong> both maps.<br />
5.22<br />
5.2<br />
5.18<br />
5.16<br />
5.14<br />
5.12<br />
5.1<br />
5.08<br />
5.06<br />
5.04<br />
LONGITUDE (°N)<br />
7.22 7.24 7.26 7.28 7.3 7.32 7.34 7.36 7.38<br />
www.iosrjournals.org<br />
8 | Page
<strong>Determination</strong> Of <strong>Propagation</strong> <strong>Path</strong> <strong>Loss</strong> And <strong>Contour</strong> <strong>Map</strong> For Futa Fm Radio Federal University<br />
Figure 4.1 – an overlay <strong>of</strong> the contour map on the terrain map<br />
5.22<br />
5.2<br />
5.18<br />
5.16<br />
5.14<br />
5.12<br />
5.1<br />
5.08<br />
5.06<br />
5.04<br />
7.22 7.24 7.26 7.28 7.3 7.32 7.34 7.36 7.38<br />
Figure 4.0 – an overlay <strong>of</strong> the contour map on the geographical map<br />
The overlay <strong>of</strong> the geographical map <strong>and</strong> the contour map <strong>for</strong> the same range <strong>of</strong> values or coverage<br />
area is shown in Figure .The geographical map was derived using the Longitude, Latitude <strong>and</strong> elevation <strong>of</strong> the<br />
l<strong>and</strong> at the various locations while the contour map was gotten from the Latitude, Longitude <strong>and</strong> Signal strength<br />
<strong>of</strong> the Signals at the various locations. The contour map indicates the magnitude <strong>of</strong> the signal strength by the<br />
distance between consecutive lines or curves.<br />
V. Conclusion<br />
It was observed that the signal was strongest along the Ondo town axis. The route to Ado-Ekiti had the<br />
lowest signal strength observed while Owo <strong>and</strong> Ilesha had an average signal strength value. With the analysis <strong>of</strong><br />
the readings obtained, the antennas should be repositioned to enhance the reception along Ado-Ekiti <strong>and</strong> keep<br />
the signal within the coverage area.<br />
Acknowledgement<br />
The contribution <strong>of</strong> Late Engr. (Dr) Alowolodu Kehinde Ezekiel, my research partner <strong>and</strong> brother,<br />
is appreciated.. He will <strong>for</strong>ever be remembered. His work lingers on…<br />
References<br />
[1] A. F. Bruce, “RF Basis: Radio <strong>Propagation</strong>” 2008,www.connectos.com/spix/rd/gi/nme.<br />
[2] George, A. G., Rice, P. L., Norton, K. A <strong>and</strong> Barsts, A. P., “Transmission loss Prediction <strong>for</strong> tropic communication circuits T ech.<br />
Note 101” U.S. Government Printing Office 1967 http://www.s<strong>of</strong>twright.com/faq/engineering/prop_longley_rice.html<br />
[3] Longley Rice<br />
[4] Harry W, “Field Prediction in Irregular Terrain”, 2002, http://www.fcc.gov/oet/fm/ptp/report.pdf<br />
[5] D. John, <strong>and</strong> D. G Smith., „‟Telecommunication Engineering” London 1997.<br />
[6] T. S. Rappaport, “Wireless Communications Principles <strong>and</strong> Practice” Prentice Hall, Upper Saddle River, NJ. 1996<br />
[7] J. S Seybold,., (2005) “Introduction to RF propagation”, Wiley<br />
[8] J. Klima <strong>and</strong> Mozucha Marian‟‟ Influence <strong>of</strong> Terrain on Multipath <strong>Propagation</strong> <strong>of</strong> FM‟‟, Signal journal <strong>of</strong> Electrical Engineering,<br />
VOL56 NO 5-6 pp. 113-120,2005<br />
[9] R. Grosskopf, „‟Field Strength Prediction in the VHF <strong>and</strong> UHF Range Including Multipath‟‟, <strong>Propagation</strong>, Proc. 7 th International<br />
Conference on Antennas <strong>and</strong> <strong>Propagation</strong> (ICAP 1991), York Conference Publication, 333, vol 2,pp. 965-967, London 1991.<br />
[10] N. Blaunstern, et al. ,‟‟Characteristics Prediction in Urban <strong>and</strong> suburban Environment‟‟, IEEE Trans. Veh. Technol, Vol(47) pp 225-<br />
234,1998<br />
[11] ITU-R <strong>Propagation</strong> over Irregular Terrain with <strong>and</strong> without Vegetation, Report 1145, Geneva (CD), 2000<br />
[12] ITU-R <strong>Propagation</strong> Statistics Required <strong>for</strong> Broadcasting Services Using the Frequency Range 30 to1000 MHz, Rec. 616, Rep 239-6,<br />
Geneva (CD), 2000<br />
[13] ITU-R VHF <strong>and</strong> UHF <strong>Propagation</strong> Curves <strong>for</strong> L<strong>and</strong> Mobile Services, Rec. 529, Report 567-3, Geneva (CD), 2000<br />
[14] Gibson, J.D. (1996) “The mobile Communications h<strong>and</strong>book” CRC Press Inc<br />
www.iosrjournals.org<br />
9 | Page