Impact of agricultural management on arbuscular mycorrhizal fungal ...
Impact of agricultural management on arbuscular mycorrhizal fungal ...
Impact of agricultural management on arbuscular mycorrhizal fungal ...

You also want an ePaper? Increase the reach of your titles
YUMPU automatically turns print PDFs into web optimized ePapers that Google loves.
N. Mathimaran et al. / Agriculture, Ecosystems and Envir<strong>on</strong>ment 119 (2007) 22–32 27<br />
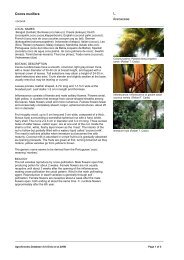
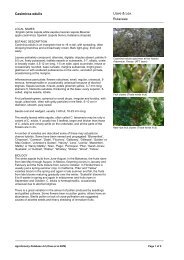
Fig. 2. Effect <str<strong>on</strong>g>of</str<strong>on</strong>g> crop rotati<strong>on</strong> <strong>on</strong> the community compositi<strong>on</strong> (relative<br />
species abundances) <str<strong>on</strong>g>of</str<strong>on</strong>g> the AMF in the field soil. Results <str<strong>on</strong>g>of</str<strong>on</strong>g> redundancy<br />
analysis are shown using the spore abundances <str<strong>on</strong>g>of</str<strong>on</strong>g> the different AMF<br />
species. Size and orientati<strong>on</strong> <str<strong>on</strong>g>of</str<strong>on</strong>g> the vectors represents correlati<strong>on</strong> am<strong>on</strong>g<br />
them and with the axes. The smaller the angle between the vectors (or a<br />
vector and an axis) and the l<strong>on</strong>ger the vectors, the more correlated are the<br />
variables represented by the vectors. Axis 1 represents the effect <str<strong>on</strong>g>of</str<strong>on</strong>g> the crop<br />
rotati<strong>on</strong> (a gradient from c<strong>on</strong>tinuous maize to maize–crotalaria rotati<strong>on</strong>),<br />
axis 2 is the most explanatory axis pooling all other envir<strong>on</strong>mental effects <strong>on</strong><br />
compositi<strong>on</strong> <str<strong>on</strong>g>of</str<strong>on</strong>g> the AMF community.<br />
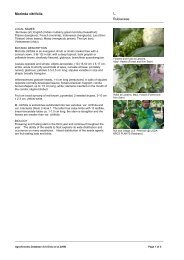
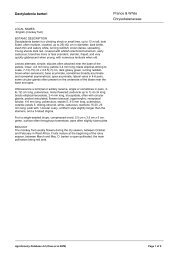
Fig. 1. Compositi<strong>on</strong> <str<strong>on</strong>g>of</str<strong>on</strong>g> AMF community in (a) field soil and (b) trap<br />
cultures. Grand means and associated standard errors <str<strong>on</strong>g>of</str<strong>on</strong>g> means are shown<br />
for 16 and 128 replicates, respectively. Spore abundances are expressed <strong>on</strong> a<br />
dry weight basis for field soil and <strong>on</strong> a fresh weight basis for trap pot<br />
substrate.<br />
variability in the dataset (RDA, F = 3.52, p = 0.005; Fig. 2).<br />
The compositi<strong>on</strong> <str<strong>on</strong>g>of</str<strong>on</strong>g> AMF community was not affected by P<br />
fertilizati<strong>on</strong> (RDA, F = 0.91, p = 0.48) or the interacti<strong>on</strong><br />
between soil fertilizati<strong>on</strong> and crop rotati<strong>on</strong> (RDA, F = 1.56,<br />
p = 0.18). The abundance <str<strong>on</strong>g>of</str<strong>on</strong>g> spores <str<strong>on</strong>g>of</str<strong>on</strong>g> both Acaulospora<br />
scrobiculata and Scutellospora verrucosa were higher in<br />
MCF than COM soils ( p = 0.037 and 0.021, respectively;<br />
Fig. 3). The community compositi<strong>on</strong> <str<strong>on</strong>g>of</str<strong>on</strong>g> AMF in the trap pots<br />
was not affected by P fertilizati<strong>on</strong> history <str<strong>on</strong>g>of</str<strong>on</strong>g> the soil used for<br />
establishment <str<strong>on</strong>g>of</str<strong>on</strong>g> the pots (RDA, F = 1.62, p = 0.14).<br />
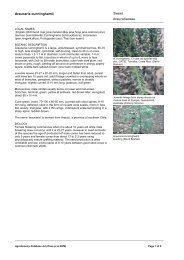
However, it was significantly affected by the identity <str<strong>on</strong>g>of</str<strong>on</strong>g><br />
plant species in the pots (RDA, F = 6.37, p < 0.001; Fig. 4),<br />
which explained 13.3% <str<strong>on</strong>g>of</str<strong>on</strong>g> variability in the dataset.<br />
Abundances <str<strong>on</strong>g>of</str<strong>on</strong>g> 7 out <str<strong>on</strong>g>of</str<strong>on</strong>g> 16 <str<strong>on</strong>g>of</str<strong>on</strong>g> the AMF species were<br />
affected by the identity <str<strong>on</strong>g>of</str<strong>on</strong>g> plant species in the trap pots<br />
(Fig. 5). The significance <str<strong>on</strong>g>of</str<strong>on</strong>g> interacti<strong>on</strong> between the identity<br />
<str<strong>on</strong>g>of</str<strong>on</strong>g> crop plant species (four levels, coded as four dummy<br />
variables) and P fertilizati<strong>on</strong> <str<strong>on</strong>g>of</str<strong>on</strong>g> the field soil was not possible<br />
to test directly because <str<strong>on</strong>g>of</str<strong>on</strong>g> s<str<strong>on</strong>g>of</str<strong>on</strong>g>tware limitati<strong>on</strong>s. The<br />
significance <str<strong>on</strong>g>of</str<strong>on</strong>g> the interacti<strong>on</strong> between P fertilizati<strong>on</strong> and<br />
plant species identity was thus tested within all possible<br />
pairs <str<strong>on</strong>g>of</str<strong>on</strong>g> species, where plant species identity could be coded<br />
as <strong>on</strong>e dummy variable (values 0 and 1 for absence and<br />
presence <str<strong>on</strong>g>of</str<strong>on</strong>g> a particular species). This set <str<strong>on</strong>g>of</str<strong>on</strong>g> analyses did not<br />
indicate any significant interacti<strong>on</strong> between the identity <str<strong>on</strong>g>of</str<strong>on</strong>g><br />
plant species and P fertilizati<strong>on</strong> <str<strong>on</strong>g>of</str<strong>on</strong>g> the field soil <strong>on</strong> the<br />
compositi<strong>on</strong> <str<strong>on</strong>g>of</str<strong>on</strong>g> AMF spore community in trap pots (analyses<br />
not shown).<br />
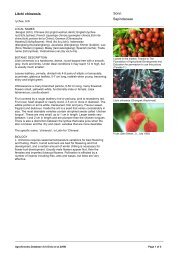
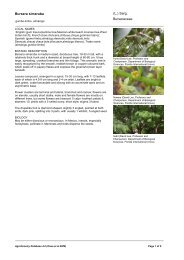
Fig. 3. Abundances <str<strong>on</strong>g>of</str<strong>on</strong>g> spores <str<strong>on</strong>g>of</str<strong>on</strong>g> two AMF species in the field soil as affected by crop rotati<strong>on</strong> (c<strong>on</strong>tinuous maize, COM and maize–crotalaria rotati<strong>on</strong>, MCF).<br />
Spore abundances are expressed <strong>on</strong> a dry weight basis <str<strong>on</strong>g>of</str<strong>on</strong>g> the soil. Means and standard errors <str<strong>on</strong>g>of</str<strong>on</strong>g> means are shown for eight replicates. Different letters indicate<br />
significant differences between the means as determined by LSD multiple range comparis<strong>on</strong> ( p < 0.05).