K - College of Natural Resources - University of California, Berkeley
K - College of Natural Resources - University of California, Berkeley
K - College of Natural Resources - University of California, Berkeley
Create successful ePaper yourself
Turn your PDF publications into a flip-book with our unique Google optimized e-Paper software.
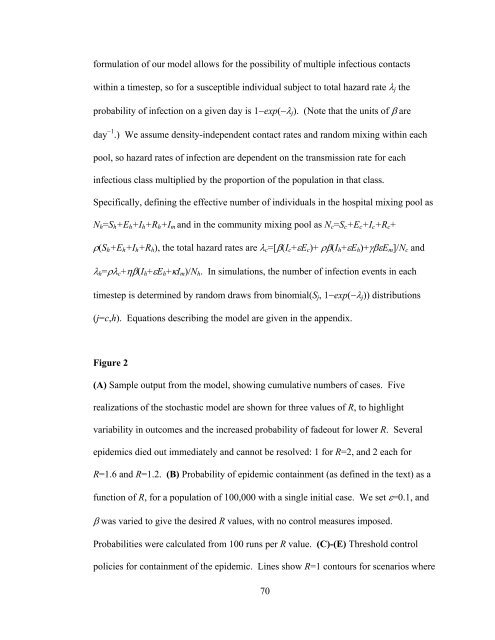
formulation <strong>of</strong> our model allows for the possibility <strong>of</strong> multiple infectious contacts<br />
within a timestep, so for a susceptible individual subject to total hazard rate λj the<br />
probability <strong>of</strong> infection on a given day is 1−exp(−λj). (Note that the units <strong>of</strong> β are<br />
day −1 .) We assume density-independent contact rates and random mixing within each<br />
pool, so hazard rates <strong>of</strong> infection are dependent on the transmission rate for each<br />
infectious class multiplied by the proportion <strong>of</strong> the population in that class.<br />
Specifically, defining the effective number <strong>of</strong> individuals in the hospital mixing pool as<br />
Nh=Sh+Eh+Ih+Rh+Im and in the community mixing pool as Nc=Sc+Ec+Ic+Rc+<br />
ρ(Sh+Eh+Ih+Rh), the total hazard rates are λc=[β(Ic+εEc)+ ρβ(Ih+εEh)+γβεEm]/Nc and<br />
λh=ρλc+ηβ(Ih+εEh+κIm)/Nh. In simulations, the number <strong>of</strong> infection events in each<br />
timestep is determined by random draws from binomial(Sj, 1−exp(−λj)) distributions<br />
(j=c,h). Equations describing the model are given in the appendix.<br />
Figure 2<br />
(A) Sample output from the model, showing cumulative numbers <strong>of</strong> cases. Five<br />
realizations <strong>of</strong> the stochastic model are shown for three values <strong>of</strong> R, to highlight<br />
variability in outcomes and the increased probability <strong>of</strong> fadeout for lower R. Several<br />
epidemics died out immediately and cannot be resolved: 1 for R=2, and 2 each for<br />
R=1.6 and R=1.2. (B) Probability <strong>of</strong> epidemic containment (as defined in the text) as a<br />
function <strong>of</strong> R, for a population <strong>of</strong> 100,000 with a single initial case. We set ε=0.1, and<br />
β was varied to give the desired R values, with no control measures imposed.<br />
Probabilities were calculated from 100 runs per R value. (C)-(E) Threshold control<br />
policies for containment <strong>of</strong> the epidemic. Lines show R=1 contours for scenarios where<br />
70


