

genomewide characterization of host-pathogen interactions by ...
genomewide characterization of host-pathogen interactions by ...
genomewide characterization of host-pathogen interactions by ...

You also want an ePaper? Increase the reach of your titles
YUMPU automatically turns print PDFs into web optimized ePapers that Google loves.
Maren Depke<br />
Results<br />
Gene Expression Pattern <strong>of</strong> Bone-Marrow Derived Macrophages after Interferon-gamma Treatment<br />
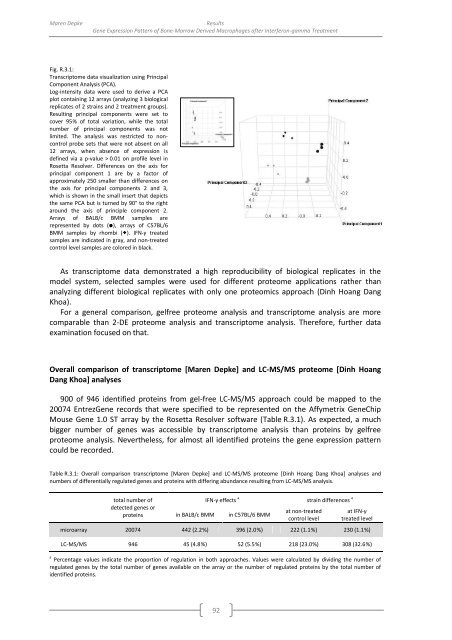
Fig. R.3.1:<br />
Transcriptome data visualization using Principal<br />
Component Analysis (PCA).<br />
Log-intensity data were used to derive a PCA<br />
plot containing 12 arrays (analyzing 3 biological<br />
replicates <strong>of</strong> 2 strains and 2 treatment groups).<br />
Resulting principal components were set to<br />
cover 95 % <strong>of</strong> total variation, while the total<br />
number <strong>of</strong> principal components was not<br />
limited. The analysis was restricted to noncontrol<br />
probe sets that were not absent on all<br />
12 arrays, when absence <strong>of</strong> expression is<br />
defined via a p-value > 0.01 on pr<strong>of</strong>ile level in<br />
Rosetta Resolver. Differences on the axis for<br />
principal component 1 are <strong>by</strong> a factor <strong>of</strong><br />
approximately 250 smaller than differences on<br />
the axis for principal components 2 and 3,<br />
which is shown in the small insert that depicts<br />
the same PCA but is turned <strong>by</strong> 90° to the right<br />
around the axis <strong>of</strong> principle component 2.<br />
Arrays <strong>of</strong> BALB/c BMM samples are<br />
represented <strong>by</strong> dots (•), arrays <strong>of</strong> C57BL/6<br />
BMM samples <strong>by</strong> rhombi (). IFN-γ treated<br />
samples are indicated in gray, and non-treated<br />
control level samples are colored in black.<br />
As transcriptome data demonstrated a high reproducibility <strong>of</strong> biological replicates in the<br />
model system, selected samples were used for different proteome applications rather than<br />
analyzing different biological replicates with only one proteomics approach (Dinh Hoang Dang<br />
Khoa).<br />
For a general comparison, gelfree proteome analysis and transcriptome analysis are more<br />
comparable than 2-DE proteome analysis and transcriptome analysis. Therefore, further data<br />
examination focused on that.<br />
Overall comparison <strong>of</strong> transcriptome [Maren Depke] and LC-MS/MS proteome [Dinh Hoang<br />
Dang Khoa] analyses<br />
900 <strong>of</strong> 946 identified proteins from gel-free LC-MS/MS approach could be mapped to the<br />
20074 EntrezGene records that were specified to be represented on the Affymetrix GeneChip<br />
Mouse Gene 1.0 ST array <strong>by</strong> the Rosetta Resolver s<strong>of</strong>tware (Table R.3.1). As expected, a much<br />
bigger number <strong>of</strong> genes was accessible <strong>by</strong> transcriptome analysis than proteins <strong>by</strong> gelfree<br />
proteome analysis. Nevertheless, for almost all identified proteins the gene expression pattern<br />
could be recorded.<br />
Table R.3.1: Overall comparison transcriptome [Maren Depke] and LC-MS/MS proteome [Dinh Hoang Dang Khoa] analyses and<br />
numbers <strong>of</strong> differentially regulated genes and proteins with differing abundance resulting from LC-MS/MS analysis.<br />
total number <strong>of</strong><br />
detected genes or<br />
proteins<br />
in BALB/c BMM<br />
IFN-γ effects a<br />
in C57BL/6 BMM<br />
at non-treated<br />
control level<br />
strain differences a<br />
at IFN-γ<br />
treated level<br />
microarray 20074 442 (2.2 %) 396 (2.0 %) 222 (1.1 %) 230 (1.1 %)<br />
LC-MS/MS 946 45 (4.8 %) 52 (5.5 %) 218 (23.0 %) 308 (32.6 %)<br />
a Percentage values indicate the proportion <strong>of</strong> regulation in both approaches. Values were calculated <strong>by</strong> dividing the number <strong>of</strong><br />
regulated genes <strong>by</strong> the total number <strong>of</strong> genes available on the array or the number <strong>of</strong> regulated proteins <strong>by</strong> the total number <strong>of</strong><br />
identified proteins.<br />
92


